By Todd Pierce
Reading Time: 7 minutes 46 seconds
TL;DR: GIS has long supported EHS compliance through contamination mapping, site monitoring, and water quality management. But the same technology is now enabling something fundamentally different: integrated intelligence loops that connect environmental data to geography, to automated systems, and to human decision-makers in real time. Inspired by a Dutch precision farming operation featured in Clarkson’s Farm, this article explores five emerging use cases where GIS is transforming how organizations manage ESG disclosure, contamination risk, environmental justice, supply chain footprinting, and cross-domain environmental data. Locus GIS+ is built for exactly this kind of integration, connecting spatial intelligence across all environmental data types in a single platform.
I recently watched an episode of Clarkson’s Farm (“Tripping”, season 5, episode 3) in which British TV personality and farmer Jeremy Clarkson travels to the Netherlands for a look at precision farming technology. At one potato farm, he learns how automated machinery such as seeders, tractors, sprayers, and drones all work together so every operational parameter (such as pesticide volume, seed density, or irrigation amounts) are calibrated to the exact square meter of land. Nothing is left to guesswork, resulting in major gains in productivity, yield, and profits, all while lowering costs and labor.
What really impressed me was how the farm owner used GIS to monitor and guide the effectiveness of the automated operations. For example, different amounts of seeds are put into various plots of ground based on the predicted soil yield. The farmer used GIS to review the plans, which was essential because the actual seeding was done by automated machinery. If the technology made a mistake and started putting seeds into the wrong place – such as a pond – no one was present in the field to know. With the GIS, though, a manager could immediately see the problem and issue corrections.
You can think of the total operation as a combined machine and human intelligence loop: the automated technology undertakes a course of action that the human manager reviews with GIS, who sends any revisions back to the machinery, which modifies its actions, which are reviewed by the manager…and so on.
So, what does a Dutch potato farm have to do with EHS compliance and ESG reporting? Everything. The same intelligence loop is transforming environmental data management.
How GIS Has Always Served EHS
GIS has always been a key part of EHS. In fact, the first operational GIS system was used by the Canada Land Inventory in 1963 to manage land-use and resources in rural Ontario (shades of Clarkson’s Farm!). https://en.wikipedia.org/wiki/Canada_Geographic_Information_System
Since then, GIS has been used for many environmental purposes such as:
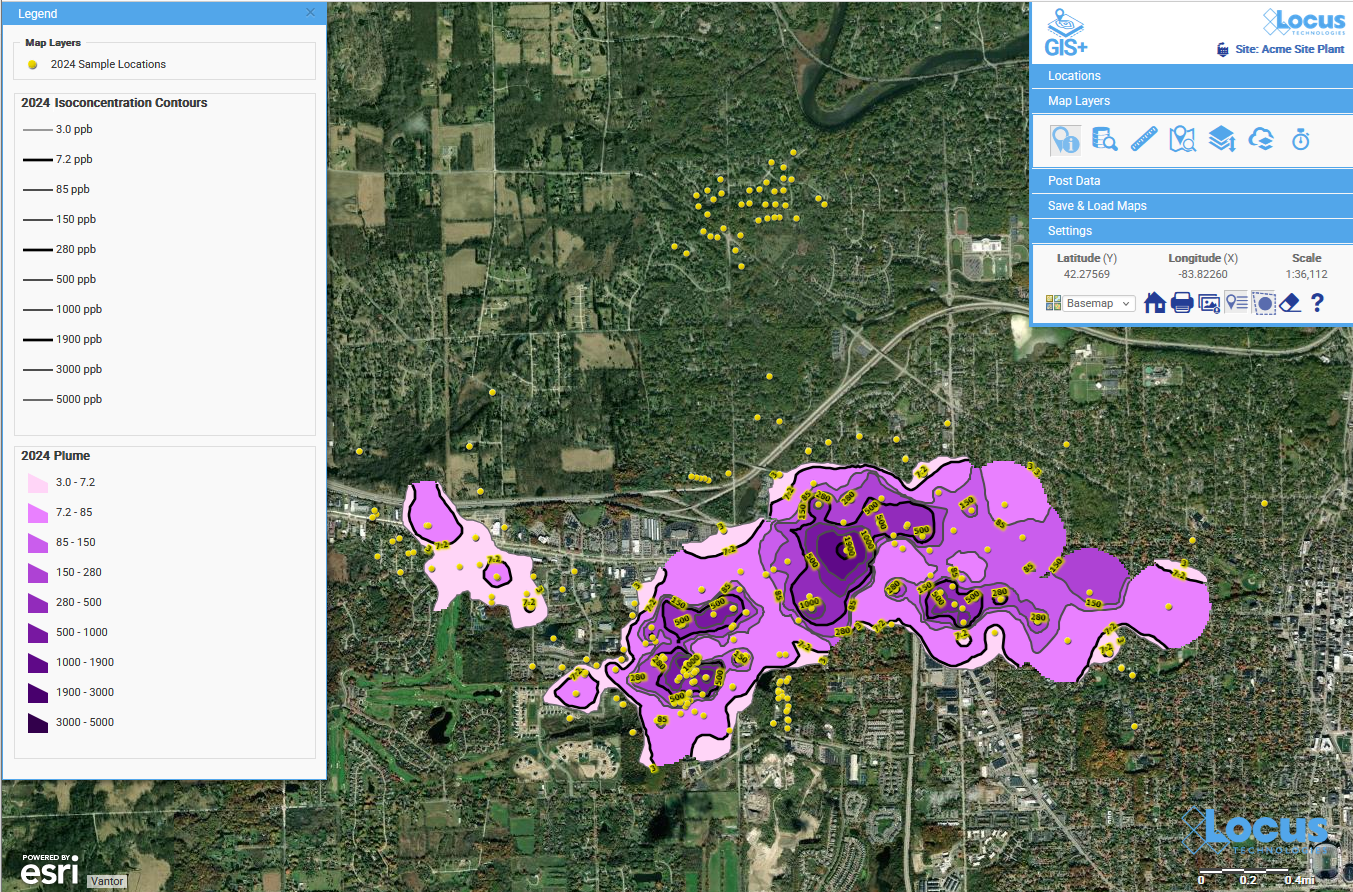
- Contamination mapping and plume visualization
- Emergency response and risk visualization and
These uses of GIS are mature and proven, but they’re the floor, not the ceiling.
Five Emerging Use Cases
Looking back at the Dutch farm, what was their real “killer app”? It wasn’t any tool, sensor, or GIS product – it was the integration of it all. They had one intelligence loop connecting every data point to every decision, with the opportunity for human review of all operations.
Successful environmental data management requires implementing similar intelligence loops that integrate multiple datasets and applications. Here are some potential scenarios:
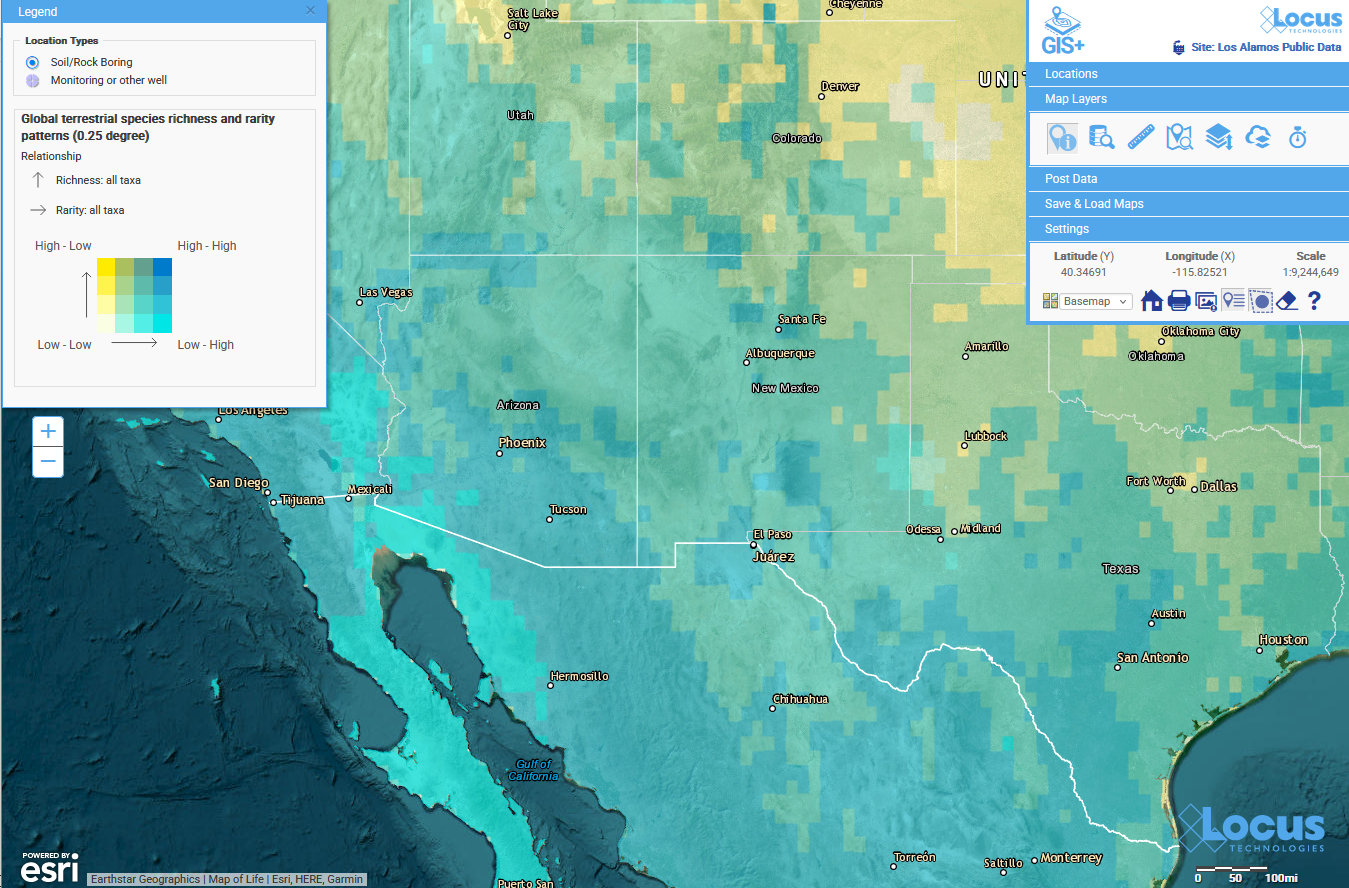
1. Spatial ESG: GIS can produce location-anchored, verifiable ESG disclosures, instead of enterprise-wide estimates, a need driven by the European Corporate Sustainability Reporting Directive (CSRD) and the global Taskforce on Nature-related Financial Disclosures (TNFD). ESG reports have a credibility problem. Many are built on estimated data, self-reported inputs, and methodologies that vary from year to year. Regulators and investors are increasingly skeptical, and with good reason. GIS is emerging as the infrastructure that makes ESG disclosure verifiable rather than asserted, by anchoring sustainability claims to specific locations and cross-referencing them with satellite imagery, earth observation data, and third-party spatial datasets.This matters enormously under CSRD and TNFD, both of which require companies to assess and disclose environmental dependencies and impacts at the asset level, meaning by location, not just enterprise wide. TNFD’s LEAP approach (Locate, Evaluate, Assess, Prepare) begins explicitly with a GIS-based location step: which of your operations and supply chain nodes are in or near areas sensitive to nature loss? You cannot answer that question from a spreadsheet.
Think of it as precision ESG, the same philosophy the Dutch potato farmer applies to his fields. Instead of applying a uniform sustainability claim across the whole enterprise, you map your actual footprint at the site level, identify where performance is strong and where exposure exists, and generate spatially verifiable reports that hold up to third-party assurance. The difference between that and a traditional ESG report is the difference between a map and a guess.
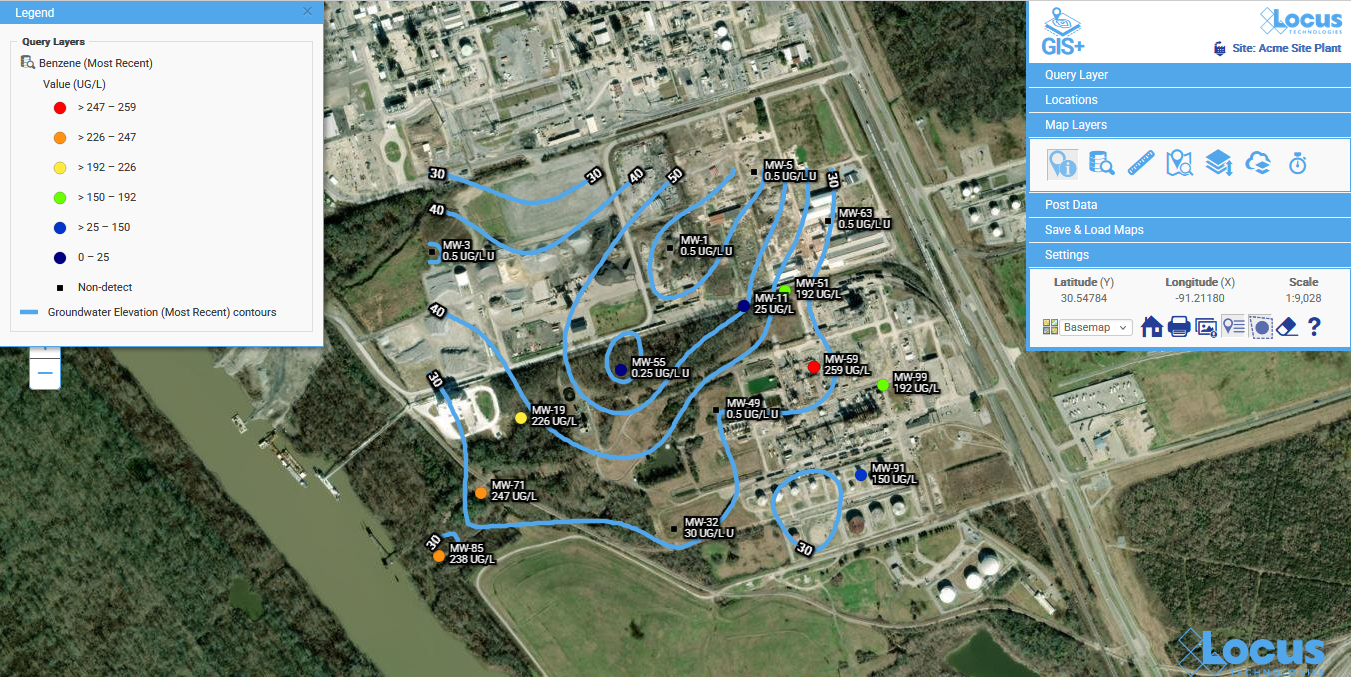
2. Predictive contamination modeling: Sensor data or IoT devices can be used with GIS and machine learning to anticipate plume movement, rather than react to it. Traditional contamination monitoring is fundamentally reactive. You install a monitoring well network, wait for the next sampling event, receive lab results weeks later, and then assess whether conditions are changing. By the time the data arrives, the plume has moved. The compliance posture of most remediation programs is essentially: find out what happened last quarter and respond accordingly.The emerging model closes that loop. Real-time IoT sensors integrated with GIS-based machine learning can identify patterns in groundwater behavior, flag anomalous readings as they occur, and model future plume migration under different precipitation and pumping scenarios. The question shifts from “what did the data show last month?” to “where will this plume be in six months if conditions stay the same, and what should we do now to change that?”
The Dutch farm parallel is direct. The farmer did not wait for yellowing crops before adjusting irrigation. Predictive models built from soil sensor data told him what to expect before the plant showed symptoms, and the system responded accordingly. Applied to subsurface contamination, this same anticipatory approach has the potential to shorten site closure timelines, reduce total sampling costs, and give regulators a more confident basis for approving site decisions. The technology to do this exists today. The organizations applying it to contamination management are still relatively few.
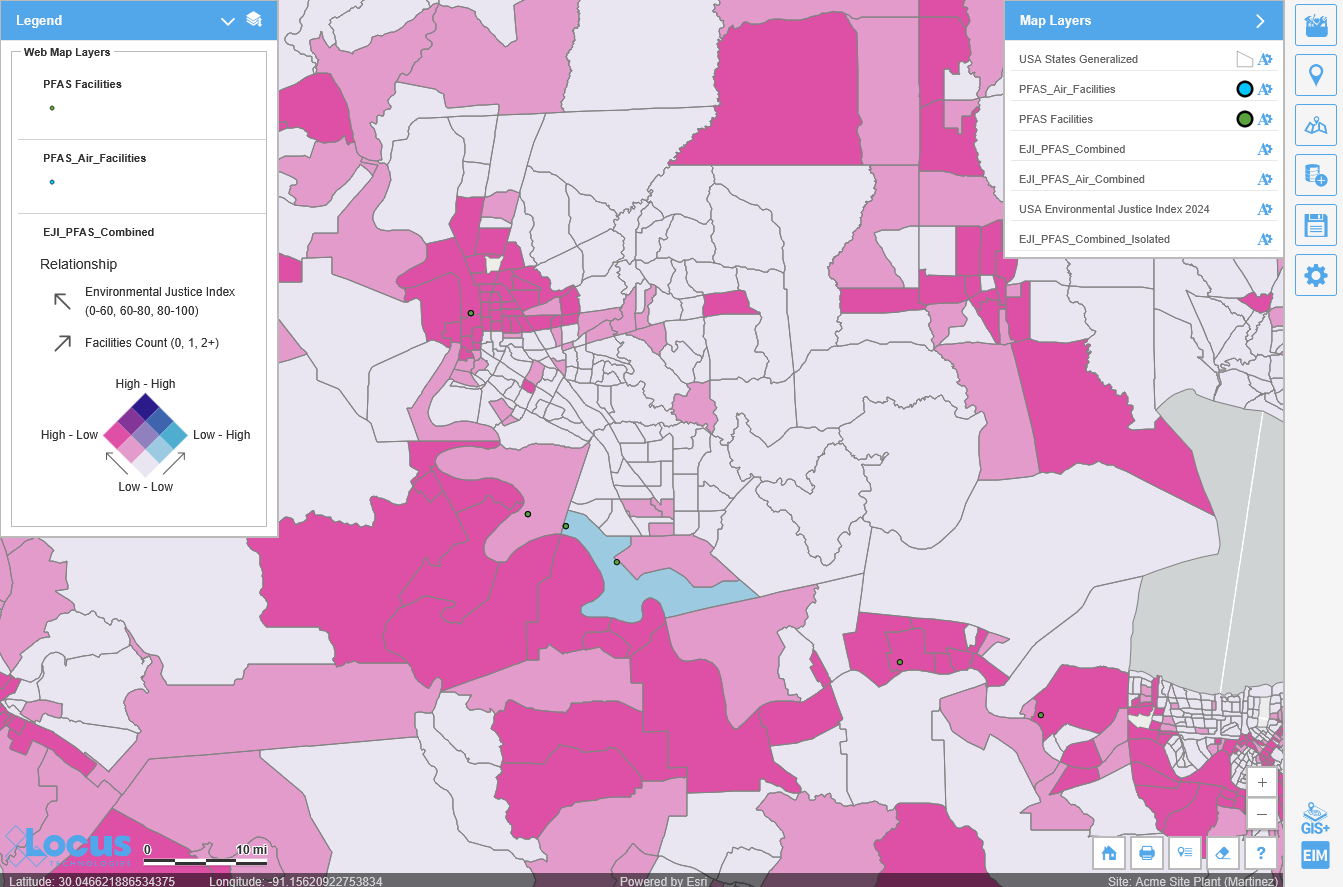
3. Environmental justice mapping: Operational data can be layered against land-use stressors to understand the cumulative burden on communities, not just facility-level compliance. A facility that meets every permit limit may still be contributing to a disproportionate environmental burden on the community around it, because that community already lives with elevated air pollution, legacy soil contamination, limited green space, and health disparities that predate your operations. Single-facility compliance reporting cannot see this, but GIS can.By overlaying operational emissions and discharge data against spatial layers showing demographics, existing air and water quality conditions, proximity to other industrial sources, and health outcome data, organizations can build a composite picture of cumulative community risk that no facility-level compliance report could produce. The EPA’s EJScreen tool was an early version of this thinking, but the frontier goes considerably further, incorporating real-time data streams, higher-resolution spatial datasets, and the ability to model scenarios rather than simply map current conditions.
For regulated industries with multi-site portfolios, this capability has both a risk management dimension and a strategic one. On the risk side, it identifies where regulatory scrutiny is likely to intensify before enforcement action arrives. On the strategic side, it provides the spatial evidence base for companies that want to demonstrate genuine community commitment rather than minimum compliance. Saying you care about the communities near your facilities is a statement. Showing the GIS analysis that drove your remediation investments is a different kind of proof.
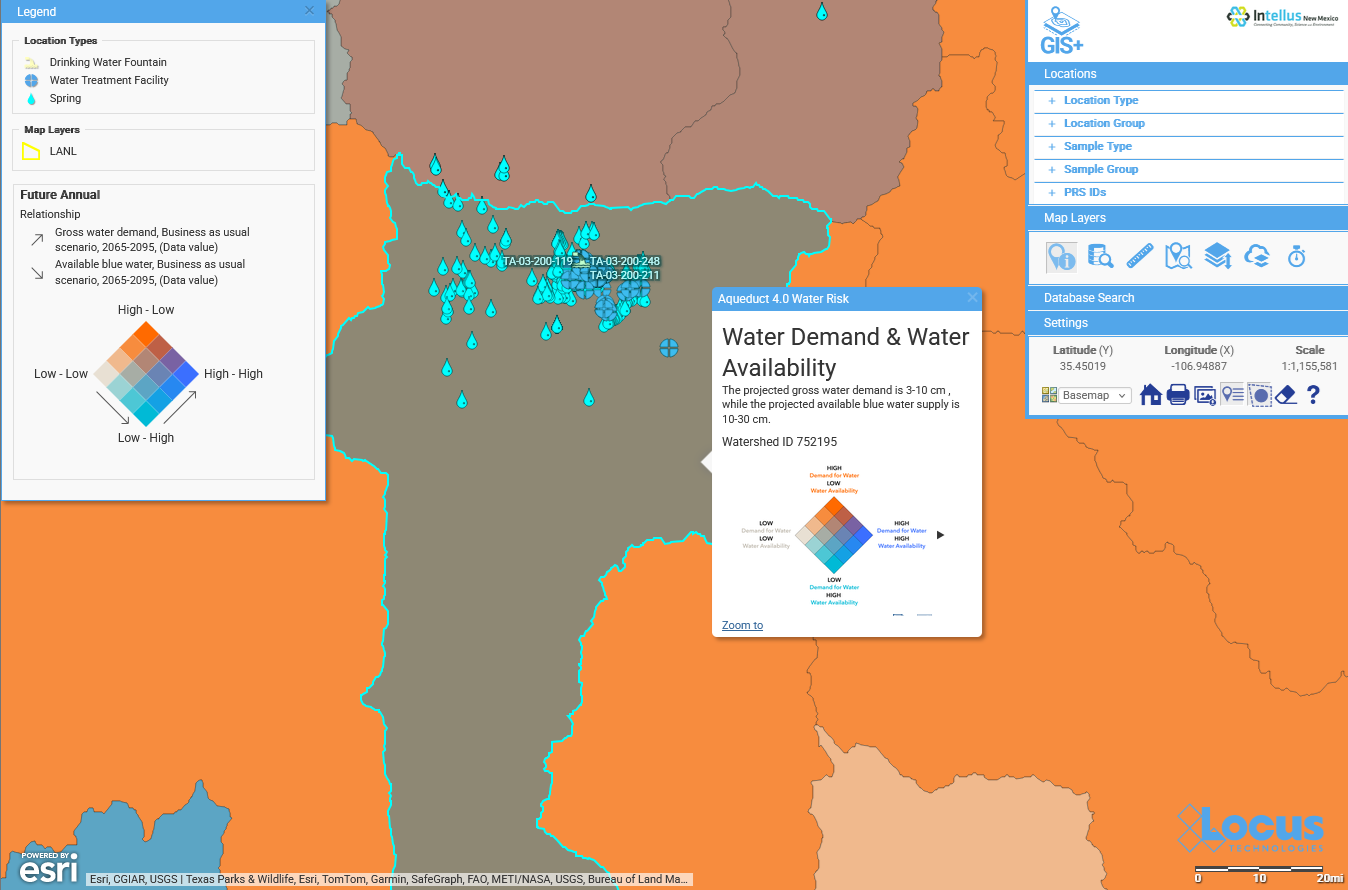
4. Supply chain environmental footprints: Supplier networks can be mapped and overlayed on deforestation, water stress, and biodiversity risk data to determine environmental impacts. Most companies’ most significant environmental exposures are not inside the fence. They are upstream, in the supply chain, in regions experiencing deforestation, water depletion, or biodiversity loss that never appears on an internal compliance dashboard. A manufacturer with excellent on-site environmental controls may be sourcing raw materials from a watershed under severe stress or a landscape experiencing rapid forest cover loss. Without spatial analysis, that risk is invisible.GIS makes it visible. By geocoding supplier locations and overlaying them against spatial datasets for forest cover change, water stress indices, protected area boundaries, and biodiversity sensitivity, procurement and sustainability teams can build an asset-level map of supply chain environmental risk. This is no longer a theoretical capability. Satellite-based forest monitoring, global water risk atlases, and biodiversity mapping tools all exist at the resolution needed to do this analysis meaningfully.
The regulatory driver is accelerating. The EU Deforestation Regulation, CSRD Scope 3 requirements, and TNFD supply chain disclosure expectations are all creating real pressure on companies to understand and document the geographic environmental profile of their entire supply network. The Dutch farmer knew exactly what was happening at every location in his field because he had the spatial data to see it. Supply chain “footprinting” applies the same principle at a global scale, giving procurement decisions the same location-specific intelligence that farmer applied to seed density.
5. Unified GIS across all environmental domains: GIS can be embedded as the native connective tissue across air, water, waste, and sustainability data, enabling cross-domain correlation. Today, many organizations manage their air data in one system, their water quality data in another, their waste records in a third, and their GIS in yet another platform. The result is that spatial context is something you add after the fact, a visualization layer applied to data that was collected and managed without geography in mind. This is the environmental data equivalent of the fragmented Dutch farm that the Clarkson’s Farm episode contrasted with the integrated operation: it was individually functional, but collectively incoherent.The shift that is now becoming possible, and that Locus Technologies is building towards with Locus GIS+, is GIS as the native connective tissue running through the entire environmental data platform. It isn’t a map that you open separately to look at your data; GIS+ is the spatial layer through which all your data finds its context. A monitoring location is not just a row in a table; it is a point on a map with a relationship to the watershed it sits in, the permit boundary it operates under, and the community that is downwind or downstream. When that spatial relationship is native to the data model, the analysis that was previously impossible becomes routine.
The cross-domain questions that can be answered with this model are the ones that matter most. For example, is groundwater quality deteriorating in the same spatial zone where air deposition has been elevated? Do waste disposal patterns in one part of a facility correlate with surface water quality trends in the drainage that is immediately adjacent? These are not extraneous research questions. They are exactly the questions regulators, litigants, and insurers are asking. Organizations that can answer them from a unified spatial data environment, rather than assembling the answer manually from disconnected systems, will have a structural advantage that compounds over time.
Closing the Loop
What the Dutch farm demonstrated, and what these five use cases reflect, is that the value is in the integration, not in any single technology. A sensor without a GIS layer is just data. A GIS layer without a feedback loop is just a map. When the pieces connect into a working intelligence loop, the results are fundamentally different. That is as true for environmental data management as it was for that potato field in the Netherlands.
Locus GIS+ integrates directly with Locus applications across all environmental data types so you can easily visualize and review your operations. Locus GIS+ works with or without an existing ArcGIS license.
Locus is the only self-funded water, air, soil, biological, energy, and waste EHS software company that is still owned and managed by its founder. The brightest minds in environmental science, embodied carbon, CO2 emissions, refrigerants, and PFAS hang their hats at Locus, and they’ve helped us to become a market leader in EHS software. Every client-facing employee at Locus has an advanced degree in science or professional EHS experience, and they incubate new ideas every day – such as how machine learning, AI, blockchain, and the Internet of Things will up the ante for EHS software, ESG, and sustainability.