
By Neno Duplan, Founder and CEO, Locus Technologies
Reading Time: 8 minutes
TL;DR: Environmental monitoring programs generally grow rather than shrink. New contaminants get added to analytical methods. New monitoring locations get designated. Permit conditions get renegotiated, and sampling frequencies get set. But a systematic review of whether every sample being collected rarely occurs despite serving a purpose. Long-Term Monitoring Optimization (LTMO) is the methodology for asking that question, and modern environmental data platforms have reached a point where the analysis is no longer the bottleneck. The bottleneck is organizational and analytical: most programs are sitting on enough data to support a defensible case for reduced sampling frequency but have not yet examined that data in a way that would reveal it.
How Monitoring Programs Actually Grow
Environmental monitoring schedules are typically set at the start of a remediation program, when uncertainty is highest. The logic is sound: early in a remediation, you need frequent data collections to understand the extent of contamination, the behavior of the plume, and whether the selected remedy is working. High sampling frequency at high uncertainty is the right call.
The problem is that programs rarely revisit those early decisions systematically as conditions change. Quarterly sampling established in year one tends to remain quarterly in year fifteen — not because quarterly sampling is still necessary, but because nobody has made the explicit case for changing it.
Over time, sampling programs often become larger and more expensive without anyone stepping back to determine whether every sample continues to provide meaningful information.
New regulatory requirements are added. Additional monitoring locations are identified. Constituents are added to analytical methods. Permit conditions change. Each decision is made in isolation, in response to a specific regulatory moment or site event. The cumulative result is a monitoring program that no single person or decision ever actually designed.
The Data Has Been There for Years
Locus Technologies pioneered the Long-Term Monitoring Optimization (LTMO) methodology in 2009. The core insight was straightforward: as monitoring programs generate years or decades of analytical results, concentration trends become visible. For many locations and constituents, those trends show stable or declining concentrations. That stability is not merely evidence that the remedy is working; it is also evidence that the existing sampling frequency may be producing diminishing scientific and regulatory value.
When five years of quarterly data demonstrate a statistically stable or consistently non-detect trend for a particular constituent, the case for reducing monitoring to semiannual or annual sampling is scientifically defensible. Regulators understand this argument, and many welcome it, because reducing low-value monitoring at stable sites allows agency attention, laboratory capacity, and remediation budgets to be redirected toward sites where conditions are changing and risks remain unresolved.
There is also an environmental obligation to consider. Monitoring is not impact-free. Every unnecessary sample may require personnel to drive a pickup truck to the site, operate field equipment, package the sample, transport it by courier or air freight, process it at an analytical laboratory, transmit the results through cloud infrastructure, and retain the data for years or even decades in energy-consuming data centers. Collectively, these activities generate Scope 1, Scope 2, and Scope 3 greenhouse gas emissions. At some point, the marginal environmental benefit of collecting another repetitive, non-informative sample falls below the environmental damage caused by collecting, transporting, analyzing, transmitting, and storing it.
Regulators should therefore ask not only whether additional sampling is technically permissible, but whether it is environmentally justified. Somewhere, two curves intersect: one represents the declining benefit of increasingly frequent sampling at a stable site; the other represents the accumulating environmental burden of that monitoring. Beyond that point, continued sampling no longer protects the environment—it imposes avoidable emissions in the name of environmental protection. A scientifically supported reduction in monitoring frequency yields a more responsible, evidence-based, and environmentally consistent form of oversight.
Why Organizations Have Not Acted on Their Own Data
Why do most organizations still run monitoring programs that look essentially the same as they did a decade ago?
Scale. Large portfolios may include hundreds of monitored sites, thousands of sampling locations, and tens of millions of analytical results. No consultant reviewing spreadsheets or standard database reports has the bandwidth to evaluate every location against LTMO criteria across an entire portfolio. Historical reviews happened site by site, when someone had time, when a permit was up for renewal, or when a client specifically asked for a cost reduction analysis.
Data accessibility. Trend analysis requires clean, complete, consistently attributed historical data. At many organizations, years of monitoring data are spread across legacy systems, multiple laboratory data formats, different project databases, or partially archived records. The data exists but assembling it into a form that supports rigorous statistical trend analysis has historically required significant consultant effort before any actual analysis could begin.
The cost of the analysis itself. Ironically, the consultant hours required to conduct a thorough LTMO analysis at a large, multi-site portfolio could offset a significant portion of the first year’s savings. That math discouraged systematic LTMO to work in favor of targeted, site-specific reviews.
Regulatory caution. Proposing a reduction in monitoring frequency requires a defensible technical case and documentation that regulators can review. Producing that documentation in a format regulators will accept has historically added to the effort required, and organizations have sometimes concluded that the regulatory work was not worth pursuing at lower-stakes sites.
Optimizing the Sampling Program
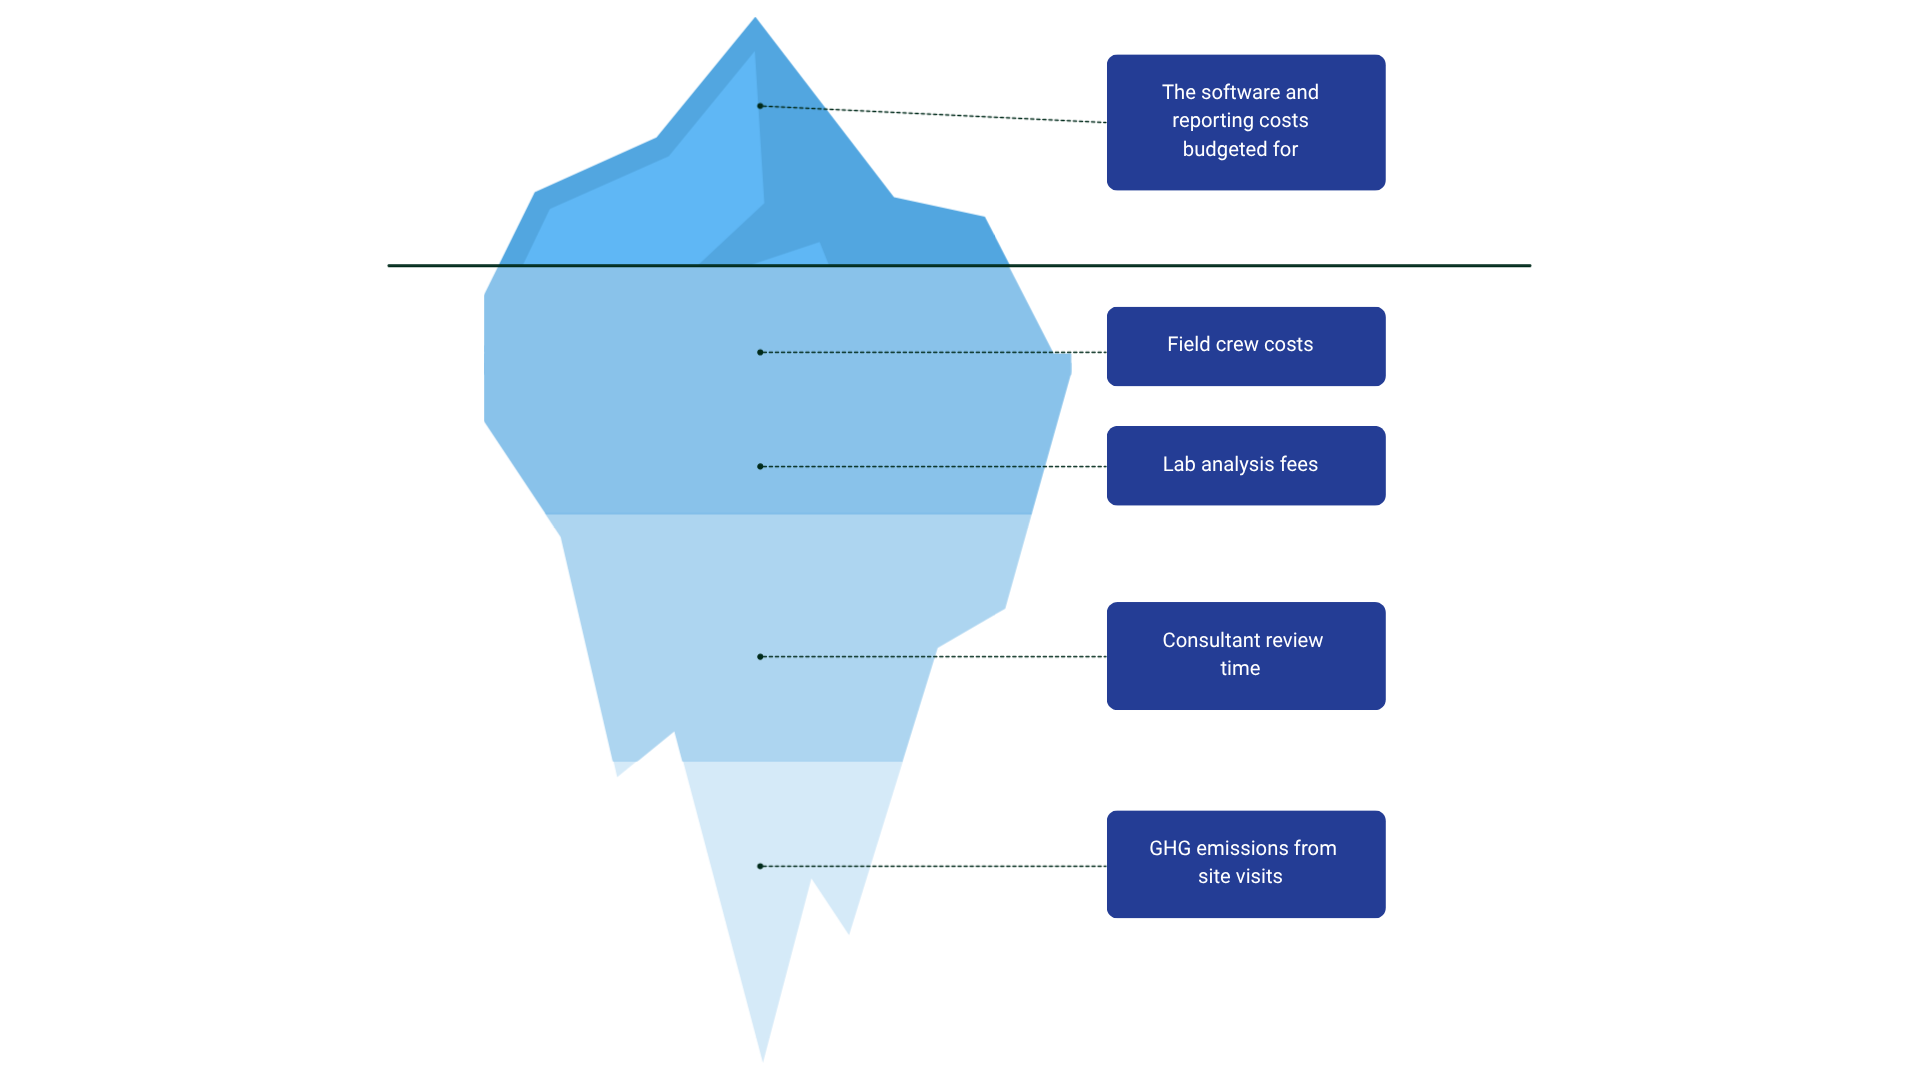
For most organizations, the largest cost in an environmental monitoring program is not software. It is field sampling, laboratory analysis, consultant support, and the operational burden of collecting data. This begs the question: are the right samples being collected?
Many monitoring programs have evolved over decades. New regulatory requirements are added. Additional monitoring locations are defined. Constituents are added to analytical methods, and testing instruments improve over time to detect even smaller concentration levels. Permit conditions change. Over time, sampling programs often become larger and more expensive without anyone stepping back to determine whether every sample continues to provide meaningful information.
This is where environmental intelligence becomes more valuable than environmental data management alone.
Locus EIM allows organizations to analyze the effectiveness of their monitoring programs by examining historical trends, spatial relationships, detection frequencies, regulatory drivers, and risk profiles across thousands or even millions of analytical results. Instead of simply storing data, the platform helps organizations determine where monitoring effort is producing value and where it may produce redundancy.
For example, if a monitoring well has produced consistently non-detect results for a specific PFAS compound across hundreds of sampling events, it is reasonable to question whether the existing sampling frequency still provides meaningful value. Likewise, if two nearby monitoring locations continue to produce statistically equivalent results year after year, the program may be optimized without increasing environmental or regulatory risk. This logic does not apply in the same way to active wastewater discharge points, where new contaminants may be introduced continuously and therefore require ongoing monitoring. However, at closed or stable sites where no new contaminant sources are being added, monitoring frequency should be reviewed periodically and adjusted based on long-term analytical trends, site conditions, and demonstrated risk.
These are not decisions that can be confidently made based on intuition or spreadsheet reviews. These decisions require the analysis of long-term historical records, spatial relationships, laboratory quality indicators, regulatory requirements, and site-specific risk factors. That sounds overwhelming, but it doesn’t have to be.
Design a smarter monitoring program. The challenge becomes even greater at large and complex sites. At facilities such as Los Alamos National Laboratory and other major federal, industrial, and utility monitoring programs, organizations may manage thousands of sampling locations, hundreds of analytes, multiple laboratories, and decades of historical data. There’s a real opportunity to manage this information more efficiently and to use the information to design a smarter monitoring program.
Locus combines analytical data management, GIS, statistical analysis, advanced optimization theories, and AI-assisted evaluation to help organizations identify sampling locations that may be oversampled, under-sampled, redundant, or emerging as higher-risk areas. The goal is not to reduce sampling indiscriminately – we are talking about maximizing the value of every sample collected.
In an era of increasing regulatory scrutiny and constrained budgets, the most successful monitoring programs will be those that can demonstrate both scientific defensibility and operational efficiency. Every sample should have a purpose. Every monitoring location should contribute knowledge. Every analytical dollar spent should improve understanding of environmental conditions and regulatory risk. The future of environmental monitoring is about collecting the right data, not just more data.
The Value of a Complete Data Record
One implication of the LTMO methodology is often underappreciated: historical data does not depreciate.
In most business contexts, older data becomes less useful as circumstances change. In environmental monitoring, the opposite is often true. A longer, more complete data record makes a stronger scientific case. A site with twenty years of consistent non-detect quarterly results is a more defensible candidate for reduced sampling frequency than a site with five years of results, even if both show the same statistical trend.
This has a direct implication for how organizations manage their data infrastructure. Archiving or retiring historical monitoring records to reduce database size or system costs can inadvertently eliminate the analytical foundation that would support a future reduction in sampling frequency. The data that looks like historical overhead today may be the asset that enables a defensible regulatory conversation tomorrow.
The longer and more complete the monitoring record, the more sites qualify for frequency reduction analysis, and the stronger the scientific case becomes for each one. Organizations that have invested in maintaining accessible, well-attributed historical records in a centralized environmental information management platform are positioned to extract value from their data in ways that organizations with fragmented, offline, or archived records are not. Data should not be removed from the active analytical environment simply because it is old. Historical results often provide the context needed to identify long-term trends, confirm stability, distinguish anomalies from true change, and support defensible regulatory decisions. Archiving data outside the usable analytical dataset may reduce storage costs, but it also diminishes the quality of future analysis—especially when AI and advanced statistical models are applied. AI is only as powerful as the completeness, continuity, and accessibility of the data available to it.
From Site-by-Site to Portfolio-Wide Analysis
Perhaps the most significant shift in how LTMO is being practiced today is the move from site-by-site review to portfolio-wide screening.
Historically, LTMO analysis was conducted on a site-specific basis, driven by a permit renewal, a budget review, or a client request. Consultants would examine the data for a specific location, conduct the statistical analysis, and prepare documentation for that site. The results were valuable, but the approach meant that opportunities at other sites in the portfolio went unexamined until someone specifically looked.
Modern environmental information management platforms like Locus EIM change this by making it possible to evaluate every site in a portfolio against LTMO screening criteria in a single analysis run. Instead of identifying candidates one at a time, organizations can surface the full population of qualifying locations simultaneously. The sites where the data most strongly support a frequency reduction case can be prioritized. The sites where trends are still evolving can be flagged for continued monitoring. The result is a prioritized list that supports a systematic, portfolio-level strategy rather than a series of one-off decisions.
The regulatory conversation also benefits from this shift. An organization that can demonstrate a systematic, data-driven process for evaluating its entire monitoring portfolio presents a more credible case to regulators than one that appears to be proposing reductions on a site-by-site basis of convenience.
Beyond Cost Reduction: The Sustainability Dimension
Every avoided field sampling event reduces more than direct costs.
Field crews traveling to monitoring locations consume fuel and generate greenhouse gas emissions. For large portfolios with hundreds of monitored sites, the cumulative environmental footprint of routine sampling activities is not trivial. LTMO analysis that results in reduced sampling frequency at qualifying sites produces a quantifiable sustainability benefit alongside the direct cost savings.
I’m not suggesting organizations reduce sampling frequency for the sake of their sustainability metrics. The scientific and regulatory case must stand on its own. But organizations that have already made the data-driven case for frequency reduction are in a position to document the sustainability co-benefit and report it as part of their environmental, social, and governance commitments. Fewer truck miles, lower fuel consumption, and reduced greenhouse gas emissions from avoided field trips represent a measurable contribution that many organizations have not yet quantified.
As monitoring and reporting cost savings accumulate, the same data infrastructure that enabled the LTMO analysis also positions organizations to extend environmental intelligence to adjacent functions: waste management, chemical inventory, air quality compliance, and sustainability reporting — all on the unified data foundation already in place.
Where We Go from Here
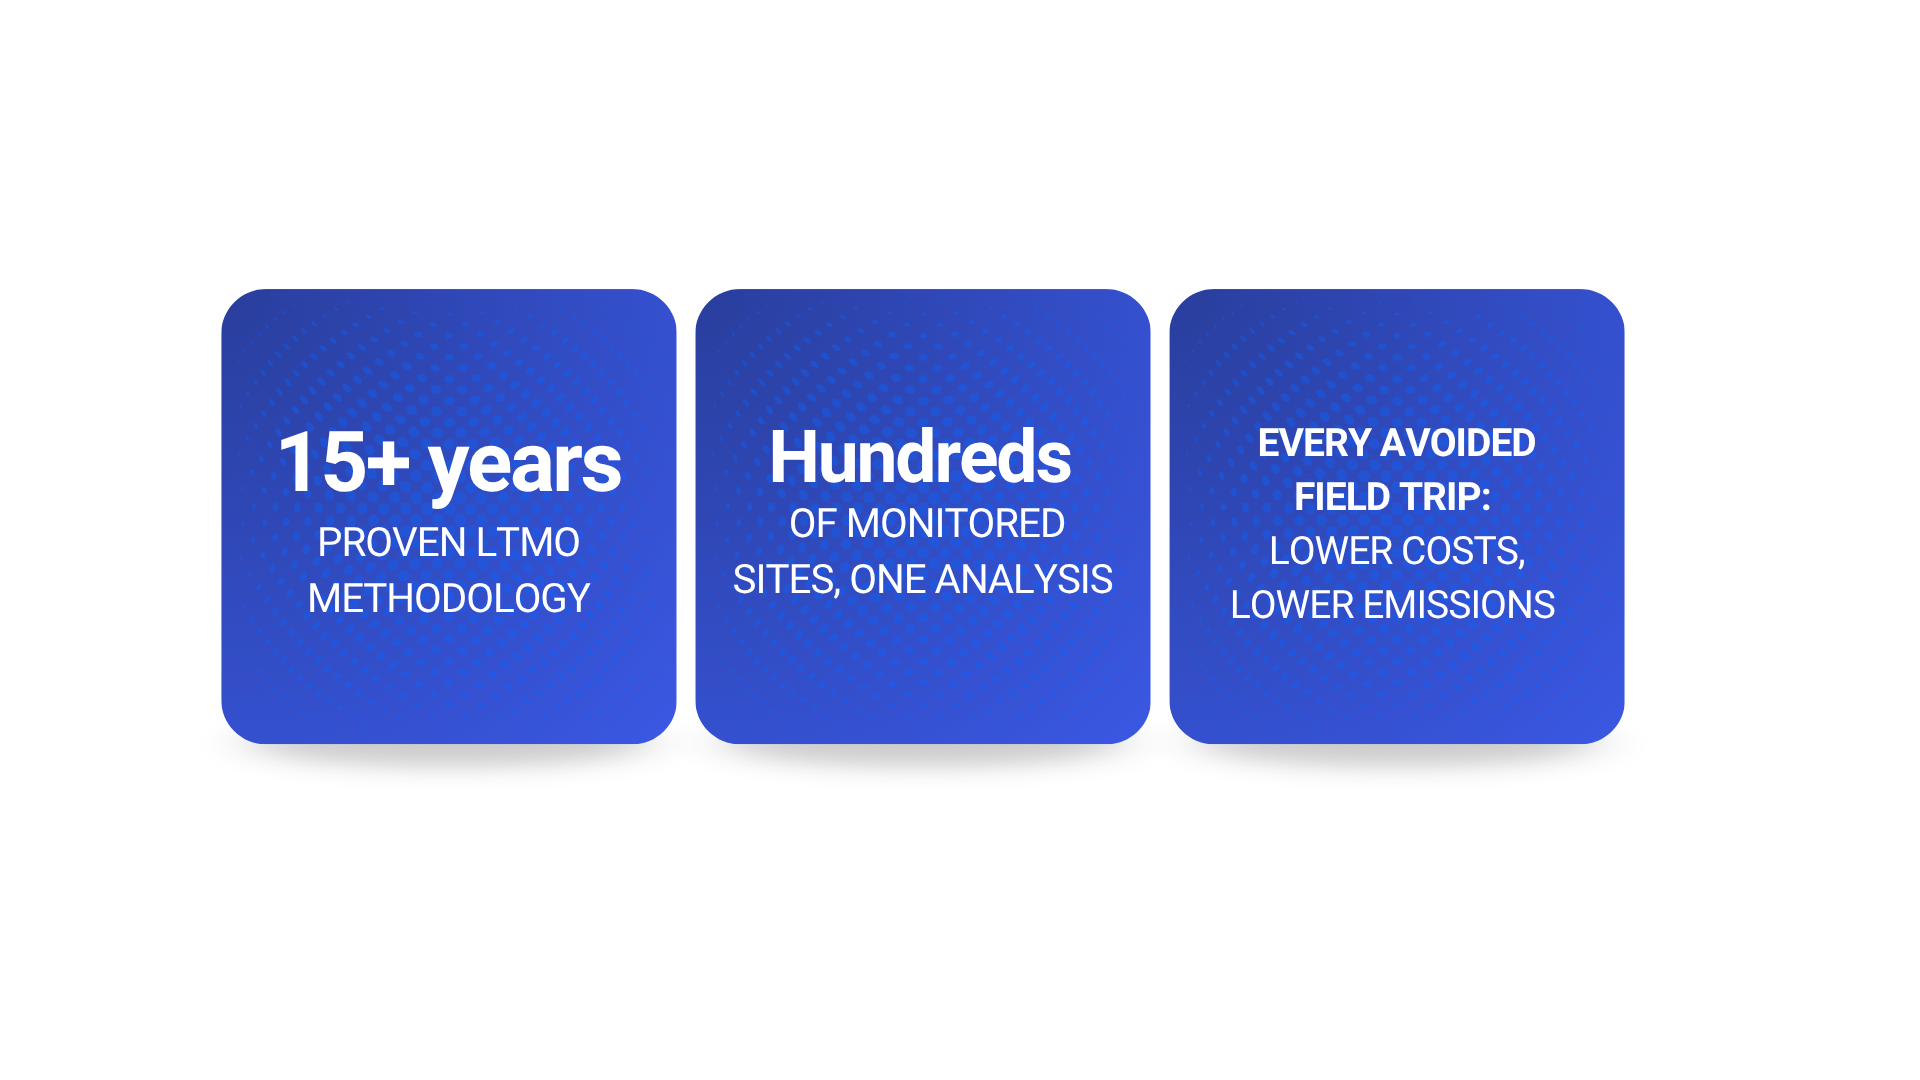
The methodology for long-term monitoring optimization has been proven over fifteen-plus years. The regulatory framework for negotiating monitoring reductions is well established. The data to support those reductions exists in most mature monitoring programs.
What is changing now is the capacity to apply that methodology at scale. Platforms that centralize environmental monitoring data, maintain long-term records in accessible formats, and enable statistical trend analysis across entire portfolios are making it possible to ask the LTMO question systematically rather than selectively.
The organizations that will capture the most value from this shift are those that have already invested in maintaining complete, well-attributed monitoring records in a centralized platform. For them, the analysis is increasingly within reach.
For organizations still managing monitoring data in fragmented systems or partially archived formats, the first step is ensuring that the data foundation is in place to support LTMO.
The future of environmental monitoring is about collecting the right data and knowing which data you no longer need to collect.
A remediated site should not remain indefinitely like a cancer patient living from CT scan to CT scan, never allowed to move beyond constant surveillance despite years of stable results. Intensive monthly or quarterly monitoring is appropriate when conditions are uncertain, risks are changing, or treatment performance remains unproven. But once long-term data demonstrate sustained stability, declining concentrations, or consistent non-detects, the objective should be to graduate the site from frequent testing to periodic confirmation—much like a patient moving from continuous diagnostic imaging to an occasional five-year checkup. Monitoring should reflect demonstrated risk, not continue forever simply because it has always been done that way.
Frequently Asked Questions
What is Long-Term Monitoring Optimization (LTMO), and how long has it been in practice? LTMO is a methodology for evaluating whether the sampling frequency at established monitoring locations is still scientifically justified given the accumulated data record. Locus pioneered the approach in 2009. At its core, LTMO applies statistical trend analysis to historical monitoring data to identify locations where concentrations are stable or declining, and where a regulatory case for reduced sampling frequency can be made. The methodology has been used by Locus customers for over fifteen years to negotiate monitoring reductions with regulators at sites ranging from industrial facilities to major federal programs.
What makes a monitoring location a good candidate for sampling frequency reduction? A strong candidate typically shows several characteristics: a long, consistent data record with stable or declining concentration trends; non-detect or near-background results for key constituents over multiple sampling events; no evidence of emerging contamination or changing site conditions; and regulatory requirements that allow for frequency modification based on demonstrated performance. Spatial relationships matter as well. Locations that are statistically redundant with nearby monitoring points — producing similar results year after year — may be candidates for consolidation rather than simple frequency reduction.
How does the data quality of historical records affect LTMO analysis? Significantly. Statistical trend analysis is only as credible as the data it rests on. Gaps in the historical record, inconsistent laboratory methods, poorly attributed detection limits, or missing quality indicators weaken the defensibility of any frequency reduction proposal. This is one reason why maintaining a complete, well-attributed monitoring record in a centralized environmental information management platform has direct regulatory value — not just operational value. The strength of the regulatory case is a direct function of the depth and quality of the underlying data record.
Does regulators’ acceptance of LTMO vary by jurisdiction or regulatory program? Yes, and this is an important practical consideration. Some regulatory programs have well-established frameworks for evaluating and approving monitoring frequency reductions; others require more groundwork. The strength of the technical case and the quality of the supporting documentation matter across all jurisdictions, but the path to regulatory approval varies. Organizations with experience presenting LTMO analyses to regulators can provide guidance on the specific documentation standards, statistical methods, and communication approaches that have worked in particular regulatory contexts.
How should organizations think about the relationship between LTMO and their overall EIM data strategy? LTMO is both an operational cost management tool and a reason to invest in maintaining high-quality historical data. An organization that treats older monitoring records as archivable overhead may be discarding the analytical foundation that would have supported a significant reduction in future sampling costs. Every year of additional data in an accessible, centralized platform strengthens the LTMO case at qualifying locations. This means the return on investment from a well-maintained EIM system compounds over time — the historical record that drives LTMO savings today also makes it easier to extend environmental intelligence to new sites, new constituents, and new regulatory conversations in the future.
Neno Duplan is the Founder and CEO of Locus Technologies, which he has led since the company’s founding in 1997. Locus develops cloud-based environmental information management and EHS compliance software for industrial, utility, government, and remediation clients worldwide. Locus pioneered the Long-Term Monitoring Optimization methodology for EIM customers in 2009.
Locus is the only self-funded water, air, soil, biological, energy, and waste EHS software company that is still owned and managed by its founder. The brightest minds in environmental science, embodied carbon, CO2 emissions, refrigerants, and PFAS hang their hats at Locus, and they’ve helped us to become a market leader in EHS software. Every client-facing employee at Locus has an advanced degree in science or professional EHS experience, and they incubate new ideas every day – such as how machine learning, AI, blockchain, and the Internet of Things will up the ante for EHS software, ESG, and sustainability.