Locus Technologies Receives 17th Consecutive EBJ Award for Information Technology in ESG
Environmental Business Journal (EBJ) recognized Locus for ESG software growth and innovation.
MOUNTAIN VIEW, Calif., 2 March 2023 — Locus Technologies, the leading EHS Compliance and ESG software provider, received their 17th consecutive award from Environmental Business Journal (EBJ) for growth and innovation in the field of Information Technology in the environmental software with particular focus on EHS, compliance, sustainability, and ESG.
Locus continues to expand its ESG SaaS solution, including built-in business intelligence tools for interactive, actionable insights into unified EHS compliance and ESG data, forecasting tools predicting future ESG reporting, APIs for utility data sources, and interfaces with third-party systems that house ESG data. Locus’s ESG solutions focus on “enter once, report to many.” enabling companies the efficiency of reporting to multiple organizations and numerous standards from a single dataset. Essential built-in reporting includes state or federal regulations and ESG based on standards, including CDP, GRI, SASB, TCFD, and many others.
“Locus’s pioneering work in integrated ESG reporting and EHS compliance software is paying off. As one of the early SaaS leaders in net-zero digital solutions for ESG reporting, Locus continues to provide value to companies that want to be credible with their carbon reporting and sustainability software.” said Grant Ferrier, president of Environmental Business International Inc. (EBI), publisher of Environmental Business Journal.
“With energy transition, climate resilience, and new federal programs driving business, as well as traditional environmental market drivers in infrastructure, air quality, remediation, water and wastewater it is understandable that companies that offer integrates SaaS platform like Locus has advantage.” added Ferrier.
“As Locus continues to expand our EHS and ESG software we would like to thank EBJ for recognizing Locus again for a 17th consecutive year and for noting the new functionality and growing customer base we achieved in 2022. Locus will continue this trajectory into 2023 with new tools designed to simplify EHS and ESG management in our award-winning Locus software, which offers a single system of record and truth for our customers. Locus SaaS platform enables our customers to manage their carbon transactions and inventory with the same rigor, confidence, and transparency as their financial ones.” said Neno Duplan, the Founder and CEO of Locus Technologies.
San Jose Water Expands Locus Technologies SaaS to include GIS+
Locus GIS+ will streamline SJW’s water quality and environmental management from watershed to consumer taps.
MOUNTAIN VIEW, Calif., 14 February 2023 — Locus Technologies, the leading EHS Compliance, and ESG software provider, today announced that San Jose Water (SJW), an investor-owned public utility providing water service to a population of approximately one million people in the Santa Clara Valley, has expanded Locus’ environmental information management software to use Locus GIS+ for advanced GIS analysis.
SJW has been using Locus SaaS and mobile app since 2014 to manage its field data collection, water quality compliance, and regulatory reporting. SJW also uses Locus to track sewer discharges and well blow-offs.
“Our responsibility is to ensure our customers receive the highest quality drinking water from their taps. We monitor the quality and cleanliness of our water in terms of state and federal regulatory requirements. In 2021, our highly experienced staff collected more than 1,000 regulatory and non-regulatory samples from our distribution system and treatment plant, generating over 23,000 data points. To manage this data effectively, we used Locus’ cloud-based software. GIS mapping capabilities are essential for our environmental data analysis. Locus GIS+ will allow quick data visualization and is a quantum leap forward with advanced analysis tools that use Esri’s Smart Mapping technology,” said Suzanne DeLorenzo, the Director of Water Quality at San Jose Water.
“Locus’s mission is to help organizations, such as San Jose Water, to achieve their business goals by providing them the software tools to manage key data associated with water quality and compliance reporting,” said Neno Duplan, CEO of Locus. “With GIS+, SJW will have all the tools they need to perform a wide range of geospatial data analysis across their distribution system. Our water quality management cloud-based software, coupled with GIS+ and Locus Mobile for field data collection, provides our customers with a highly scalable and feature-rich application that gives water utilities strong analytical power and advanced GIS capabilities.”
Locus GIS+ is powered by Esri’s ArcGIS platform and offers various advanced features— including enhanced cartography, comprehensive spatial data analysis, and the ability to use the customer’s map data through integration with ArcGIS Online and Portal for ArcGIS.
ABOUT SAN JOSE WATER
Founded in 1866, San Jose Water is an investor-owned public utility and is one of the largest and most technically sophisticated urban water systems in the United States. Serving over one million people in the greater San Jose metropolitan area, San Jose Water also provides services to other utilities, including operations and maintenance, billing, and backflow testing. San Jose Water is owned by SJW Group, a publicly-traded company listed on the New York Stock Exchange under the symbol SJW. SJW Group also owns Connecticut Water Company in Connecticut; Maine Water Company in Maine; and SJWTX, Inc. (dba Canyon Lake Water Service Company) in Texas. To learn more about San Jose Water, visit www.sjwater.com.
Locus Innovations in 2022
2022 has given us a wealth of new features and growth! Both of our platforms have undergone improvements to enhance our client’s user experience. Let’s look at all the new features for 2022.
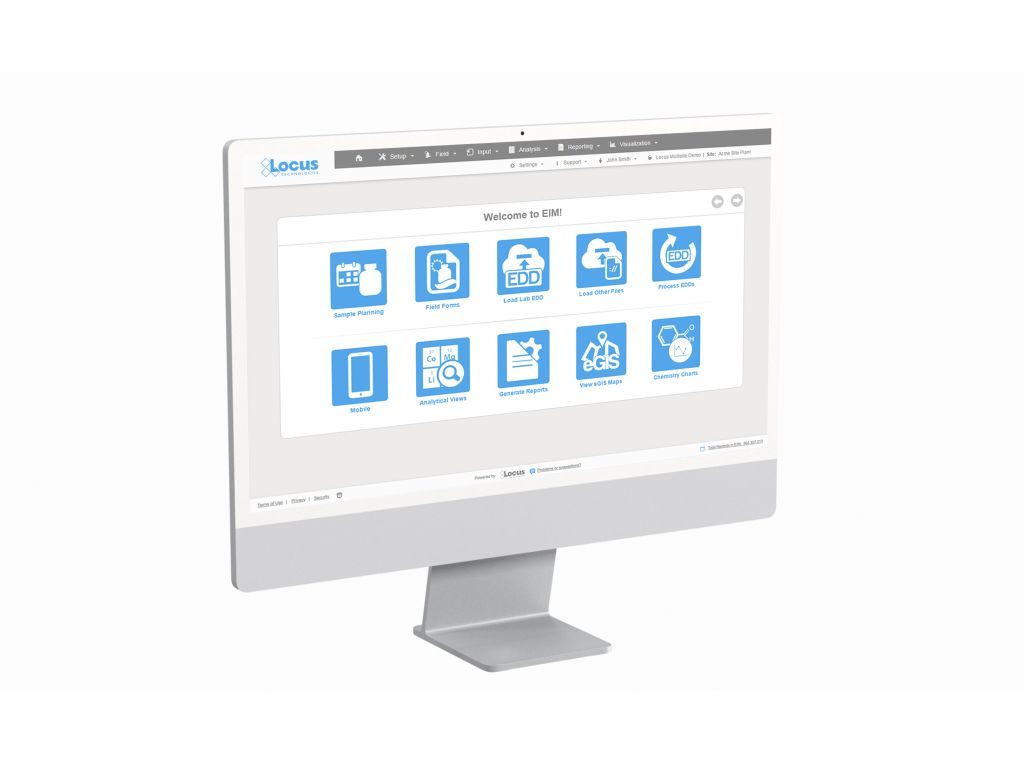
Environmental Information Management (EIM)
1. New Site Metrics dashboard allows immediate visibility into your data with clickable mapping. This is especially powerful for customers with multiple sites where they want to keep track of site activity and usage.
2. Finding data can sometimes be overwhelming especially when you have hundreds, if not thousands, of locations and numerous analytical parameters to review. Locus added advanced database search tools to support multiple search terms and ‘exact match’ searches, making it easy to find exactly what you want with a couple of key words and a click. Never has finding the right results from large complex datasets been so easy.
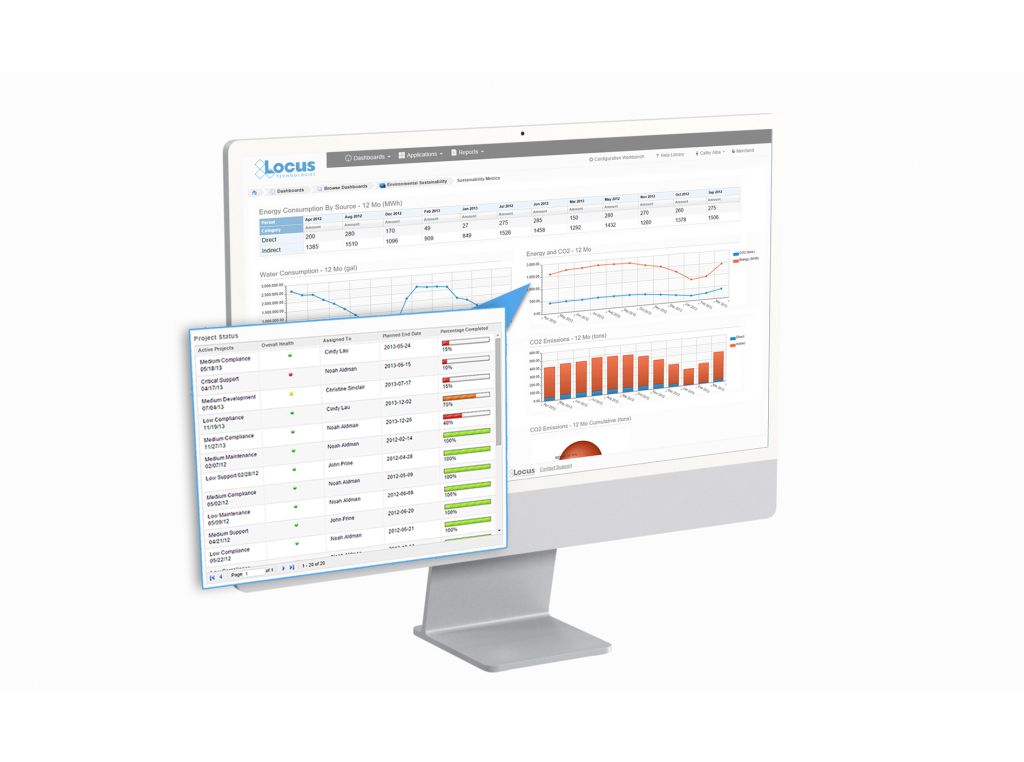
3. Locus has enhanced its API functionality to enable easier integration with external BI tools, including Tableau, PowerBI, and other apps. Now, customers that rely on external business analytical tools will have quick and easy access to data to combine with other internal data sources.
4. Locus document management has been taken to the next level by allowing customers to link documents from any external library directly into their sites, monitoring locations, samples, and more. This means with a simple click, users can go to lab reports, regulatory reports, and any other current or historical document associated with the site. If you are using SharePoint, for example, to manage documents – they can be accessed directly from Locus software. Document access and security will be preserved by existing document library access controls.
5. 2022 was the year of “help”. In addition to the advanced search, Locus added a new Help Browser to provide access to comprehensive documentation for every feature of the software. It is similar to the familiar “site map”, only the links take you to help content. With this new feature, users can view help in a single location vs having to access the information on each individual screen. For new users, or infrequent users, this will be their new favorite feature.
EHS & ESG Solutions
1. Locus’ Survey/Questionnaire tool enables you to securely & easily obtain data globally without the burdens of training or maintaining user lists. The survey system effortlessly supports data entry from external organizations (such as suppliers) or even occasional users internal to your organization, with a simple link click.
2. Locus released a new pivot table tool that enables you to perform full data analysis on any query in the system. Data may be grouped and organized by any value. Output options include bar charts, heatmaps, tables, area charts, scatter charts, and tree maps. In support of the output options, Locus has improved the ability for users to create dashboards more easily.
3. Complex inspection and audit forms require branching, sophisticated, scoring, and automated responses. Locus added new question types to its inspection/ audit module, including conditional questions based on responses to one or more previous questions. Locus augmented the scoring calculation mechanism and automated creation and tracking of corrective action.
4. In today’s world, users need access to environmental data on the go. Locus augmented its mobile offerings to include configurable layouts for mobile users, with compact forms specially designed for smartphone and tablet access.
5. Today’s managers want immediate access to the data they need. Locus’ new Landing Page feature makes it simple to configure the dashboards, bookmarks, and record lists. This enables the user to review just the areas they need to see and navigate efficiently to complete the work.
Artificial Intelligence & Blockchain Applied to Water & Energy
There are two promising technologies that are about to change how we aggregate and manage EHS+S data: artificial intelligence (AI) and blockchain. When it comes to technology, history has consistently shown that the cost will always decrease, and its impact will increase over time. We still lack access to enough global information to allow AI to make a significant dent in global greenhouse gas (GHG) emissions by merely providing better tools for emissions management. For example, the vast majority of energy consumption is wasted on water treatment and movement. AI can help optimize both. Along the way, water quality management becomes an add-on app.
AI is a collective term for technologies that can sense their environment, think, learn, and act in response to what they’re detecting and their objectives. Possible applications include (1) Automation of routine tasks like sampling and analyses of water samples, (2) Segregation of waste disposal streams based on the waste containers content, (3) Augmentation of human decision-making, and (4) Automation of water treatment systems. AI systems can greatly aid the process of discovery – processing and analyzing vast amounts of data for the purposes of spotting and acting on patterns, skills that are difficult for humans to match. AI can be harnessed in a wide range of EHS compliance activities and situations to contribute to managing environmental impacts and climate change. Some examples of applications include permit interpretation and response to regulatory agencies, precision sampling, predicting natural attenuation of chemicals in water or air, managing sustainable supply chains, automating environmental monitoring and enforcement, and enhanced sampling and analysis based on real-time weather forecasts. Applying AI in water resource prediction, management, and monitoring can help to ameliorate the global water crisis by reducing or eliminating waste, as well as lowering costs and lessening environmental impacts. A similar analogy holds for air emissions management.
The onset of blockchain technology will have an even bigger impact. It will first liberate data and, second, it will decentralize monitoring while simultaneously centralizing emissions management. It may sound contradictory, but we need to decentralize in order to centralize management and aggregate relevant data across corporations and governmental organizations without jeopardizing anyone’s privacy. That is the power of blockchain technology. Blockchain technology will eliminate the need for costly synchronization among stakeholders: corporations, regulators, consultants, labs, and the public. What we need is secure and easy access to any data with infinite scalability. It is inevitable that blockchain technology will become more accessible with reduced infrastructure over the next few decades. My use of reduced architecture here refers to a replacement of massive centralized databases controlled by one of the big four internet companies using the hub-and-spoke model concept with a device-to-device communication with no intermediaries.
This post was originally published in Environmental Business Journal in June of 2020.
Locus Technologies Receives 16th Consecutive EBJ Award for Information Technology in ESG
Environmental Business Journal (EBJ) recognized Locus for ESG software growth and innovation.
MOUNTAIN VIEW, Calif., 24 February 2022 — Locus Technologies, the leading EHS Compliance and ESG software provider, was awarded a 16th consecutive award from Environmental Business Journal (EBJ) for growth and innovation in the field of Information Technology in the environmental software with particular focus on ESG.
EBJ is a business research publication providing strategic business intelligence to the environmental industry. Locus received the 2021 EBJ Award for Information Technology by growing and innovating its unified EHS compliance and ESG software platform.
In 2021 Locus took a leading market position in the fast-growing space of ESG software. Locus’s ESG SaaS covers carbon data aggregation via a powerful visual calculation engine, investor-grade emissions calculations audit capabilities, reporting to multiple standards from a single data set, integration APIs, dashboards, and carbon reduction goal setting and tracking. This separates Locus from competitors as customers demand integrated net-zero ESG software that supports investor-grade data in disclosure rules such as the EU’s corporate sustainability reporting directive, mandatory TCFD reporting, and anticipated SEC action on climate disclosures.
In 2021 Locus continued to expand its ESG SaaS to include built-in business intelligence tools allowing for interactive, actionable insights into EHS and ESG data, forecasting tools to predict future ESG reporting, APIs linking to utility meters, and interfaces with other Locus and third-party systems that house ESG data. Locus’s ESG application is focused on “enter once, report many times.” The gold standard for multinational enterprises with many locations worldwide is to have a system configured to report to multiple organizations and many standards from a single dataset. Essential built-in reporting in the Locus ESG app includes state or federal regulations, internal CSR, and ESG based on whatever standard their organization adheres to, such as CDP, GRI, SASB, TCDF, or more recent World Economic Forum (WEF) attempt to standardize many voluntary standards.
Locus also expanded its ESG consulting expertise by becoming the first and only software provider to offer accreditation services under new Oregon DEQ guidelines requiring third-party verification for GHG and CFP programs.
Besides strong growth in ESG space, Locus also continues to lead the software for water quality management market with the addition of new SaaS customers in 2021, such as the City of Hillsboro, Oregon for water quality management and Westinghouse Electric Company for control of environmental and radionuclides data, cementing Locus’s market leader position in the space of nuclear facilities.
“Locus’s investment in integrated carbon management software and EHS compliance is paying off. As one of the early SaaS leaders in net-zero digital solutions for ESG reporting, Locus continues to provide value to companies that want to be credible with their carbon reporting and sustainability software.,” said Grant Ferrier, president of Environmental Business International Inc. (EBI), publisher of Environmental Business Journal.
“We would like to thank EBJ for recognizing Locus for a 16th consecutive year and for taking note of our industry-leading ESG software. We aim to continue expanding our software offerings to customers in 2022,” said Wes Hawthorne, President of Locus Technologies.
5 Major Signs That You Need to Replace Your Water Data Management Solution
If your current water data management solution doesn’t meet these requirements, then it’s time to consider a switch.
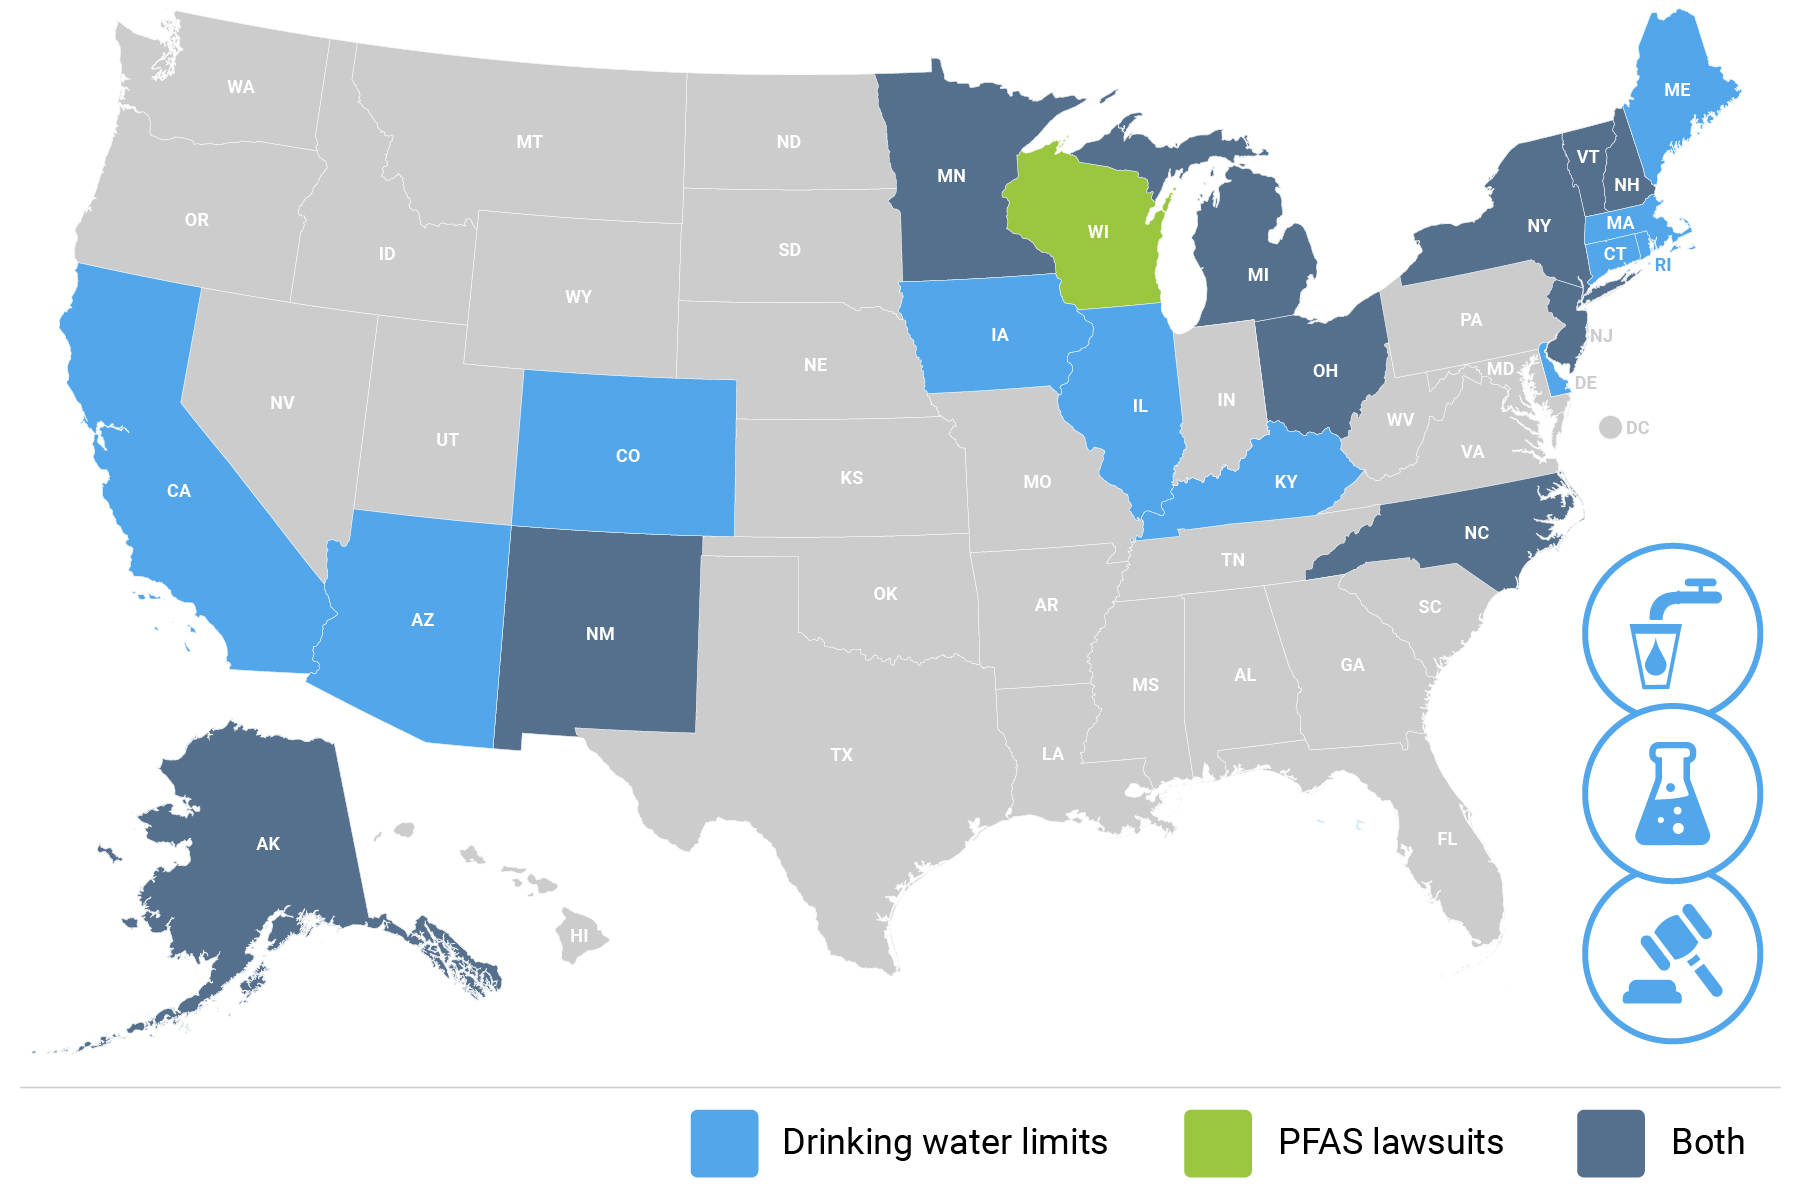
PFAS Drinking Water Regulations by State
Are stricter PFAS standards coming your way?
PFAS chemicals were first invented in the 1930s and have since been used in several applications from non-stick coatings to waterproof fabrics to firefighting foams. In recent years, PFAS studies and research funding have increased remarkably, but as of right now the EPA has yet to implement regulations on the chemicals. Many states have leapfrogged the EPA by implementing regulations on PFAS use, safe PFAS levels in drinking water, and by suing manufacturers of PFAS chemicals. This creates a complex set of regulatory requirements, depending on where you operate.
Updated August 30, 2021
Locus offers software solutions for PFAS management and tracking. Our EHS software features tools to manage multiple evolving regulatory standards, as well as sample planning, analysis, validation, and regulatory reporting—with mobile and GIS mapping functionality. Simplify tracking and management of PFAS chemicals while improving data quality and quality assurance. With future PFAS regulations being an inevitability, the time is right to adopt a software that can track and manage these and other chemicals.
Environmental Reports Tailored to Your Needs
Companies across a wide array of industries utilize Locus Environmental Information Management (EIM) software. Some examples include petroleum companies with over 6,000 sites, fracking companies with 3,000 plus sites, leading chemical corporations, engineering firms, private and public water utilities, DOE facilities, Native American tribes, aerospace companies, representatives of the electronics industry, and more. There is not a single report that these companies share in common, and as such, our approach to reporting recognizes our customers’ diversity.
Instead of focusing on canned reports, we provide users with the tools to build their own custom reports—enabling them to design exactly what they need, either independently or along with our stellar support team. To make the transition to Locus EIM as easy as possible, we ask our customers about their top reporting priorities. Then, we build reports to match their specifications during the implementation process to be up and running from day one. Not only does this facilitate the transition to our system, but it also gives our customers examples of how to build their custom reports.
Grid Reports
Before we delve into EIM’s formatted reports module, keep in mind that many of our customers’ reporting needs are met by EIM’s grids. For example, here is a sample grid populated with analytical results that match some previously chosen selection criteria:
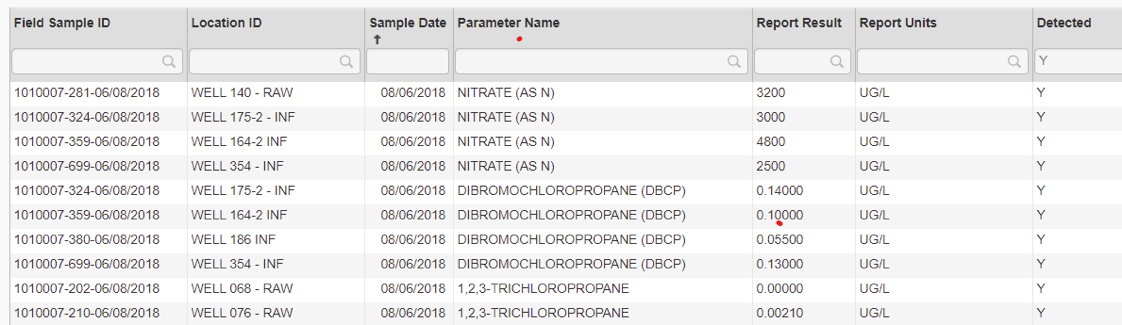
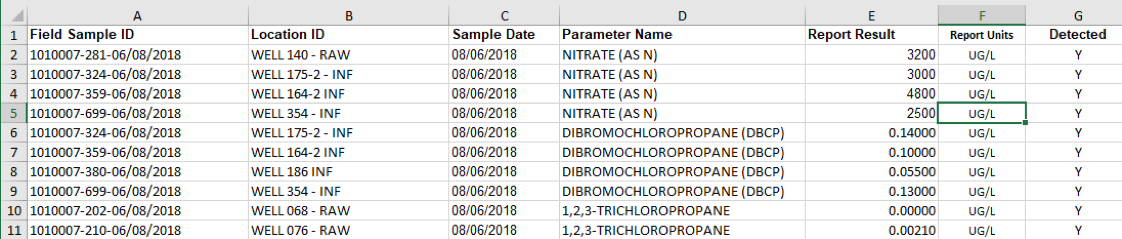
One-click and this becomes an Excel spreadsheet (or any of a range of file formats) to which you can add a title, edit the column headers as needed, and if required, engage in further formatting.
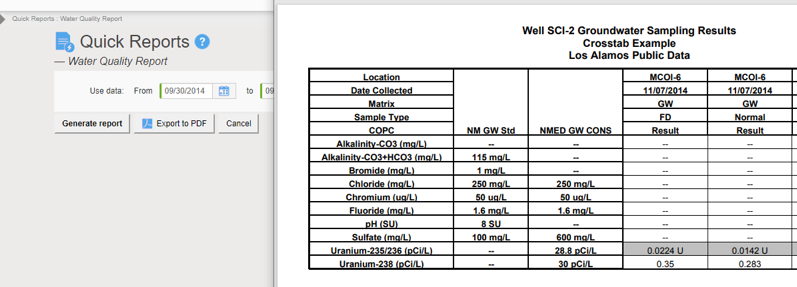
Formatted Reports
Let’s now move on to EIM’s formatted reports module. Templates provide EIM with instructions concerning report layouts, content, and formatting. They do not address which records stored in EIM are to appear in the report. Template creation requires more in-depth knowledge of EIM and needs to be done only once for any given report format. Running a report is a more straightforward task. The same report can be re-run any number of times using different selection criteria. For example, it is not uncommon for a customer to print a monthly, quarterly, or even annual report using the same template. All that changes from one reporting period to the next is the selected sampling or measurement date range. Upon saving your entries, the report is ready to be used by others, unless designated as private.
To run a formatted report in EIM, all you need to know is what filters should be chosen to display only the relevant set of data. Aside from date ranges, what are examples of selection criteria available to you when executing a formatted report? For example, you can select individual locations or named location groups; individual or named groups of parameters; one or more sample types, sample purposes, samples, sampling programs, sampling events, or sample delivery groups; a range of sample depths; only filtered or unfiltered samples; only leached or not leached analyses; one or more EDDs; and one or more work order numbers to name a few.
Expert SQL Query Reports
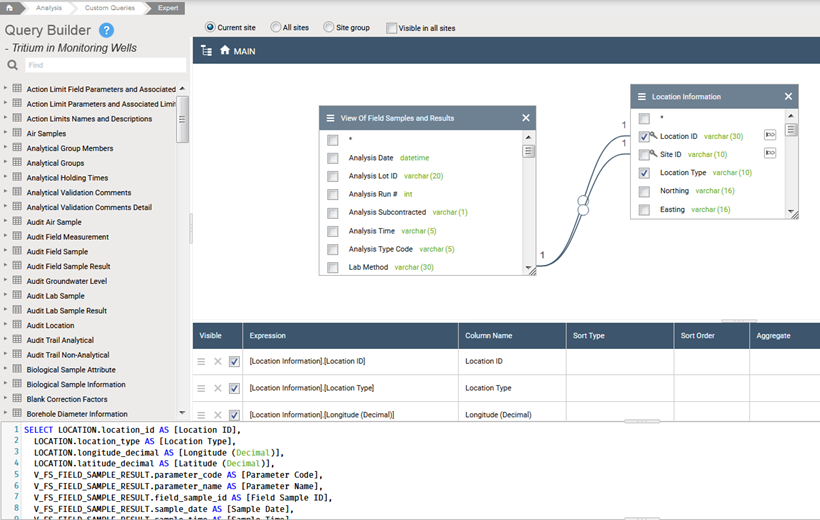
The expert query tool allows the user to retrieve records from many EIM data tables with a flexible interface, where join and column definitions are customized. The expert query output can be scheduled as an attachment to an email or run as needed, private or public, or saved on the dashboard for ultimate access by all user levels.
The EIM Expert Query Tool (EQT) lets users create their database queries using a drag-and-drop table interface. Users can also directly write T-SQL language requests to pull data from EIM. This powerful tool empowers the super users to take full advantage of the data managed in EIM and creates “custom reports” without the need for a developer.
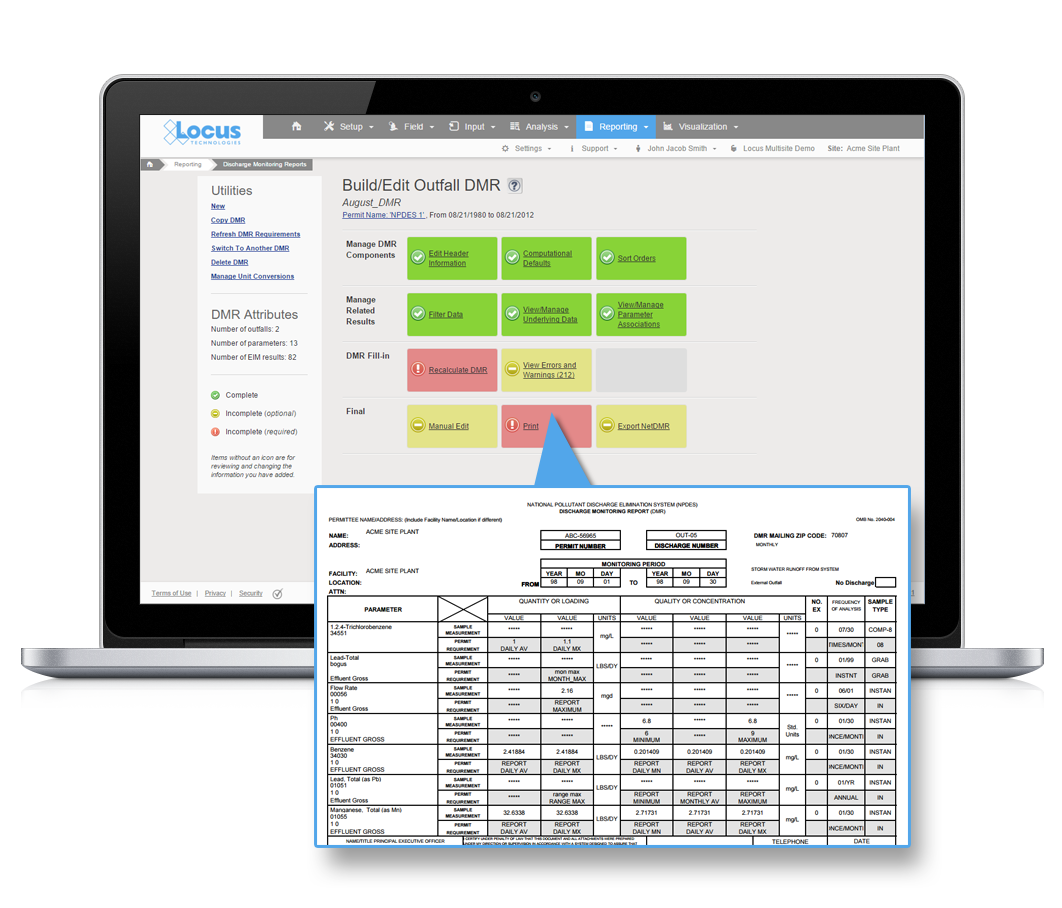
Additional Reports
Additional reports include DMR reports (formatted and NetDMR); Self-monitoring; Regulatory formatted exports (various EPA regions); Consumer Confidence Reports; Data Validation (in association with the Data Validation Module); Coliform reports (Water configuration); custom DMR reports and custom MSGP reports; and a wide range of metric reports for usage statistics, records, sites, and management reports including holding table metrics, SDG turnaround times, reporting tool metrics, and LocusDocs metrics.
Water Quality in the Cloud with Neno Duplan
Locus Technologies founder and CEO Neno Duplan provides a wealth of experience on water quality in the cloud. Neno began cloud-based data work before any of us knew what the cloud even was. He does a great job explaining the steps needed to undertake and the significant benefits of a cloud-based digital transformation, and much more!