5 tools to get more EHS tasks done with less staff

EHS software can be a boon or a bane of your life at work. Here are the 5 time- saving tools Locus’s EIM provides that can be the difference between the former versus the latter.


1. Mobile

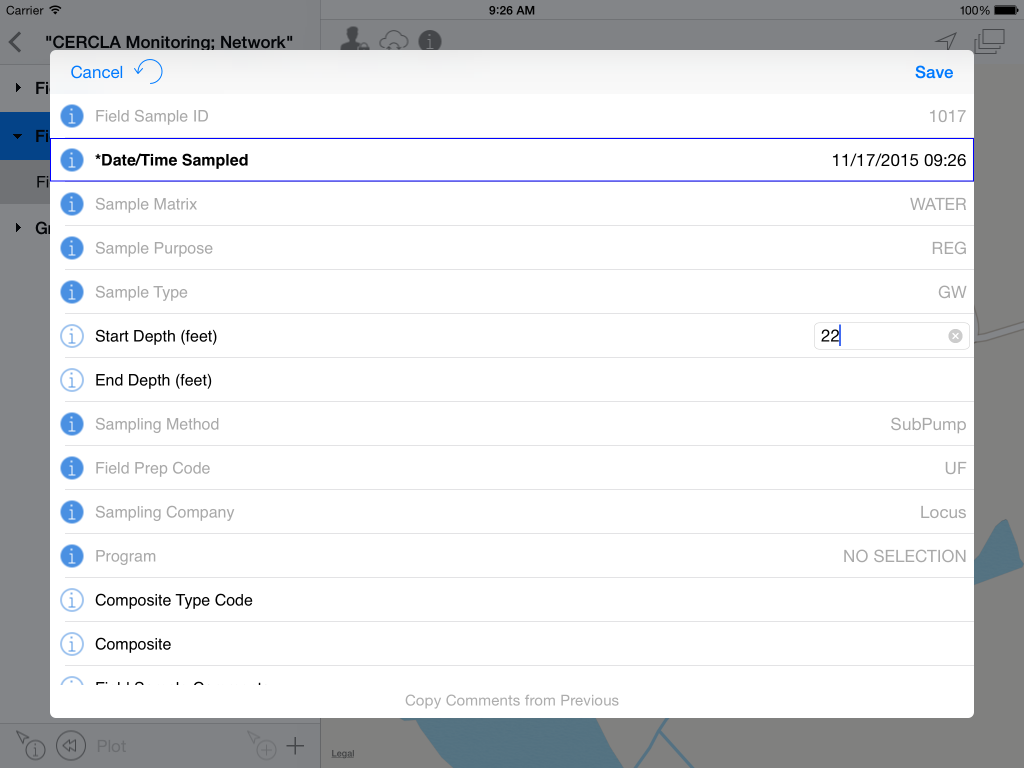
Do you enter field data onto a paper form, and then have to manually type it into a spreadsheet or database when you get back to the office?  Or have you ever been in the field and entered data into your remote mobile device and have lost the data due to the lack of internet signal? Locus’ Mobile application allows you to sync with your server to create data collection profiles on a mobile device, whether it’s your phone or a tablet. This application will allow you to click through and enter data on the device and store the data, even when you are offline. As a result, data only need to be entered once on your device, and then they are seamlessly loaded into your  cloud-hosted solution.

Using Mobile you have data entry directly on the mobile device, with immediate data availability on the cloud when you reach an internet signal. Other advantages include location metadata and mapping integration, bar-code/or code scanning, voice recognition and form customization. If you would like to know more, check out the Top 10 cool features in Locus Mobile.
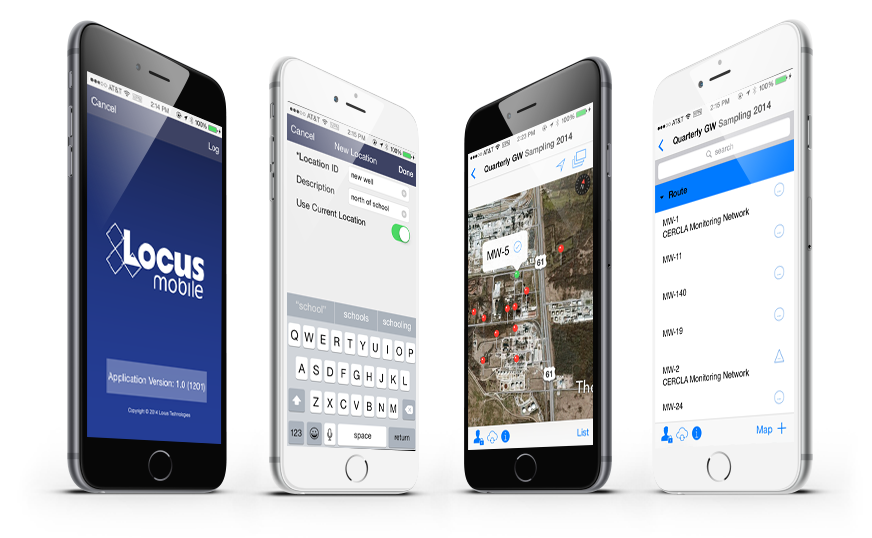
Locus mobile environmental field data collection app for iOS

2. EDD Loader

With EIM’s electronic data deliverables (EDD) loader, you can upload and validate several thousand records within a minute. Laboratories are not required to use the same reporting format, yet the results will still end up at the same place in the database where sample data came from. Locus EIM also has a special lab interface so that your labs (with your permission) can upload their own EDDs. You no longer need to spend time receiving and processing EDD files from your lab. The labs simply log in directly, upload your reports, and they are immediately available to you.

EIM provides you access to popular features such as a planning module, forms for entering field data, a utility to upload EDDs, built-in mapping tools, and an extensive reporting and plotting module. It also has a calendar module for viewing information on sampling events and uploaded EDDs, automated exceedance notifications, and sophisticated statistical evaluation tools designed specifically for environmental data.
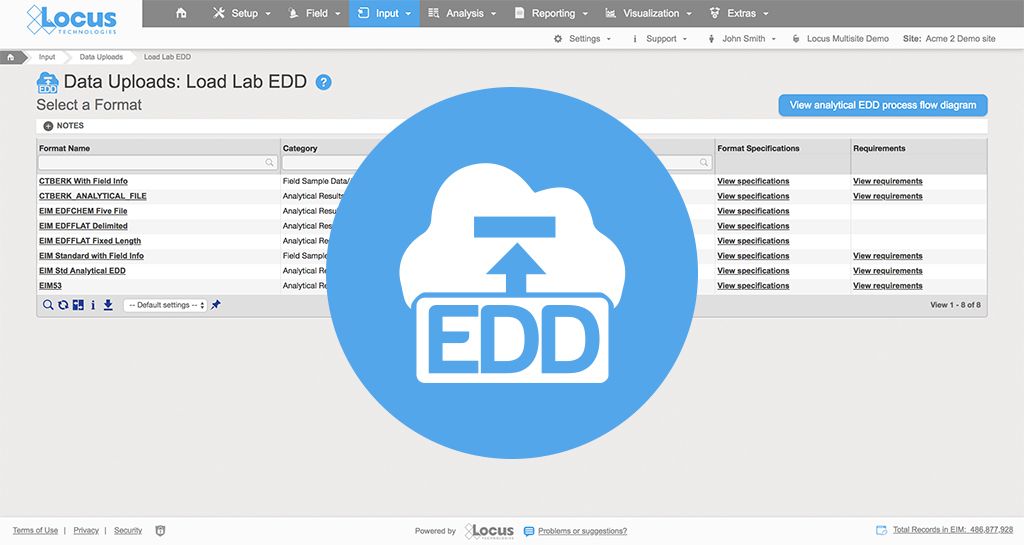
Locus EIM - EDD Loader


3. Sample planning

Setting up and implementing a complex sampling plan can be a time-consuming effort. Depending on the purpose and extent of the sampling plan, you may have dozens of analyses to complete at varying frequencies and locations.  You may also have multiple compliance programs with overlapping requirements.  EIM’s sample planning can save you valuable time and effort by assembling your requirements into a concise calendar, preprinting all of your chain of custody records and bottle labels, and tracking the collection of samples from the field to the lab.  As an added bonus, the automation of this process ensures you’ll never miss another required sample.
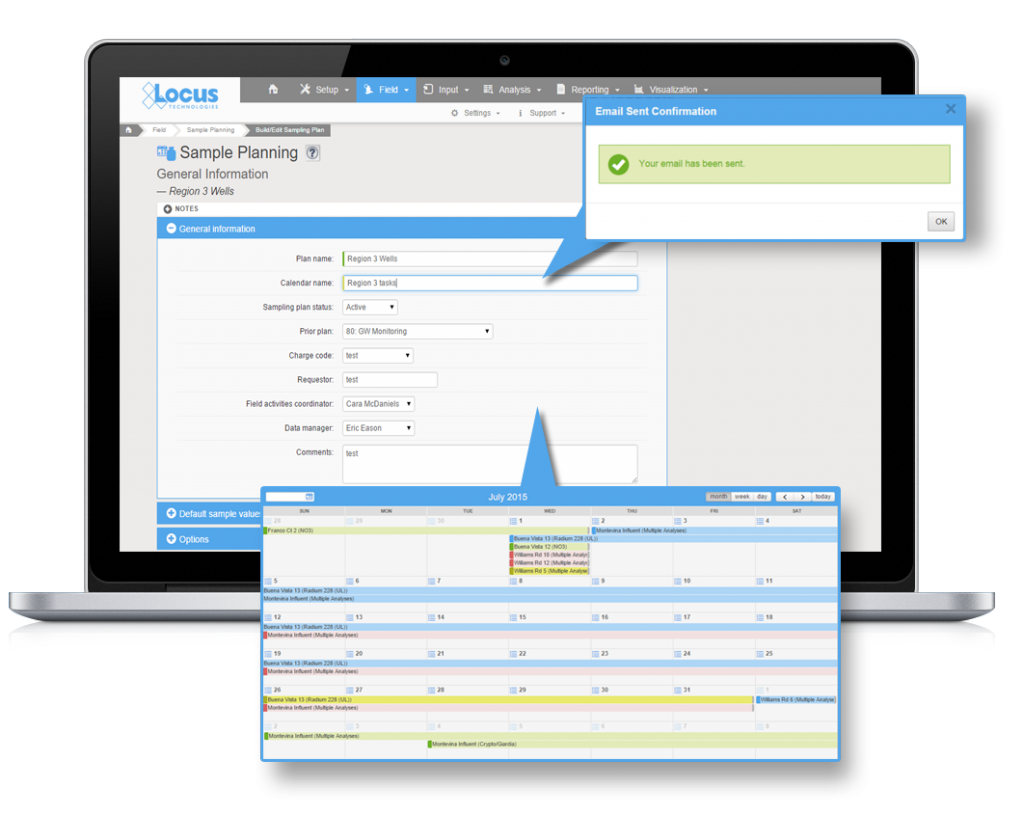
EIM screenshot of sample planning edit form with email notification and calendars popouts


4. Discharge Monitoring Reports

Locus’ EIM DMR tool solves the problem of time-consuming, labor-intensive, and expensive manual report generation by automating the data assembly, calculations, and formatting of Discharge Monitoring Reports.  Depending on the type of discharge and the regulatory jurisdiction, you may be required to report information such as analytical chemistry of pollutants, flow velocity, total maximum daily load, and other parameters. For companies that report from 100 to 1,000 facilities, producing a DMR also becomes a major expense.

Thanks to Locus’ DMR reporting tool, companies can generate DMRs within minutes with validated data in approved formats, with all of the calculations completed according to regulatory requirements. Companies can set up EIM for its permitted facilities and realize immediate cost and time savings during each reporting period.
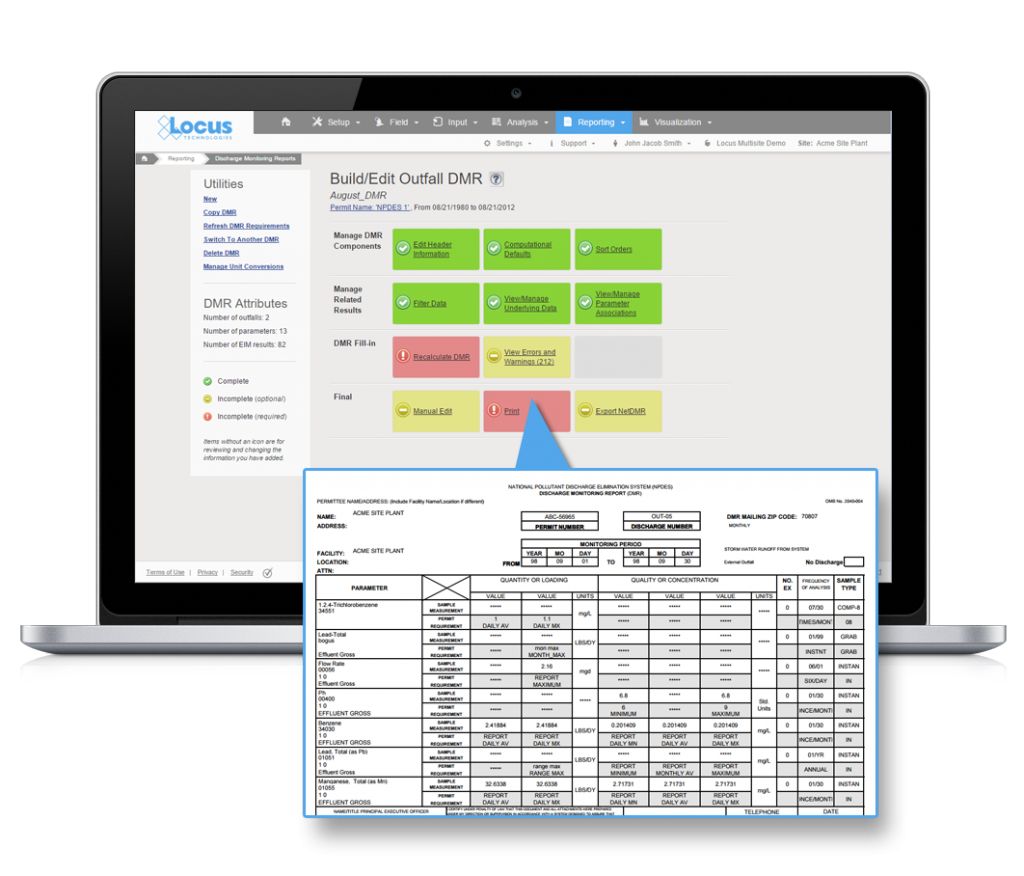
DMR builder and report in EIM


5. Formatted Data Tables

For most environmental database systems, getting the right data out is just the first step in assembling your reports.  Comprehensive systems rarely store data in a format that is ready to submit to a regulatory agency or other party.  Typically, you have a labor-intensive process of restructuring, labelling, footnoting, formatting, and paginating the data into tables that can be readily interpreted. EIM’s formatted reporting tools allow you to set up any number of table formats with specific grouping, sorting, footnotes, headers, and other data processing steps.  Then you just select your data range, pick your format, and the table is ready to download or print directly from your web browser.  And if you make a mistake, the report can be instantly regenerated without any effort.
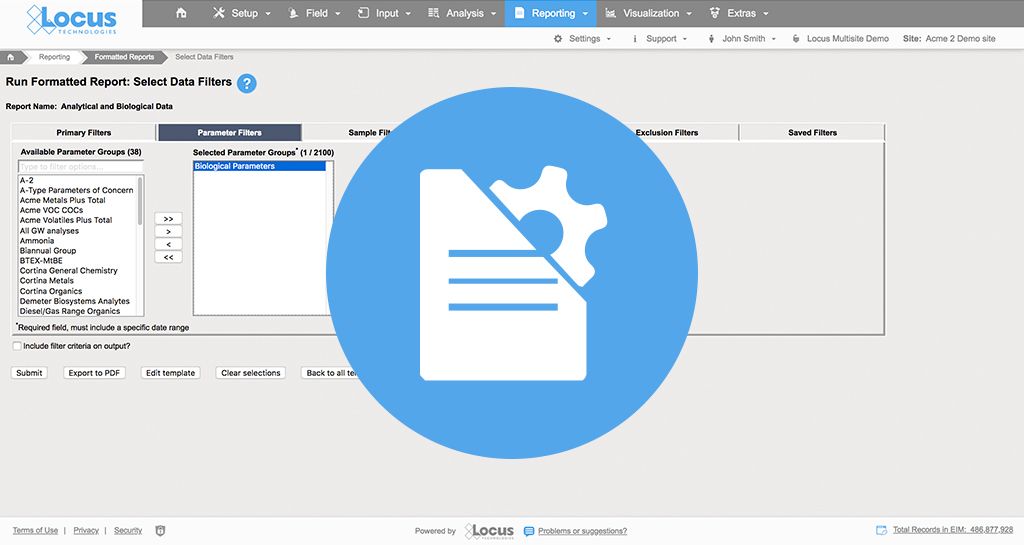
Locus EIM - Formatted Reports


Getting the most out of EHS mobile apps

Mobile tools for EHS have been around for some time now. By now, most users are familiar with the benefits such as instant data collection and access to reference information for better, more reliable EHS programs. However, as any tech-savvy individual knows, new software tools are consistently becoming more powerful and more accessible, and that is certainly true for mobile applications.  That “ground-breaking” EHS mobile app that you purchased five years ago may now be looking a little dated if your software provider has not actively updated it.  Here are some of the beyond-the-basic features that you probably really want, but perhaps never knew existed for your EHS mobile app.


Location metadata and mapping integration

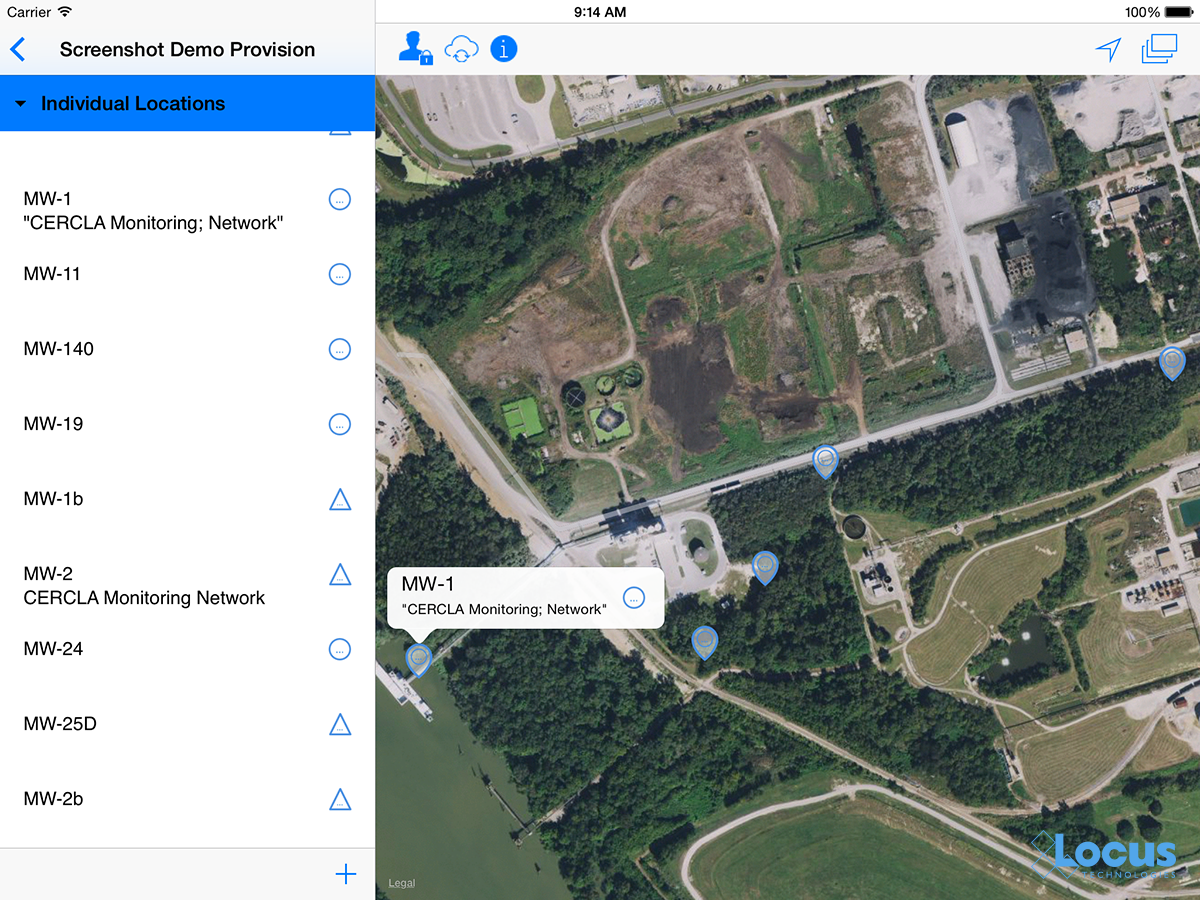
Your coordinates are actively being recorded every time your phone moves. Why not record that data as part of an incident report or sample collection?  Or use that information to locate the position of a monitoring well or other asset?  Much of EHS information is associated to a specific location, so automatically storing your location can help ensure that you know where your data are originating.

You may be thinking that phone/tablet GPS is not very accurate, and you would be correct…..for now.  According to GPS.gov, phone accuracy is typically accurate to within a 4.9 m (16 ft.) radius under open sky.  While this may be accurate enough for some situations, it will not be sufficient for others.  However, according to the IEEE, a respected technical engineering association, 2018 and beyond will bring new more accurate chips to phones that will improve GPS accuracy to about 30 centimeters, which should be much more useful for field locations especially when identifying the scene of a spill or accident.

Screen capture of Locus Mobile app using GIS for field data collection

So start thinking about what can be improved with your business process by getting more accurate location information, and start looking at upgrading mobile devices in the next year or two.


Barcode and QR code scanning

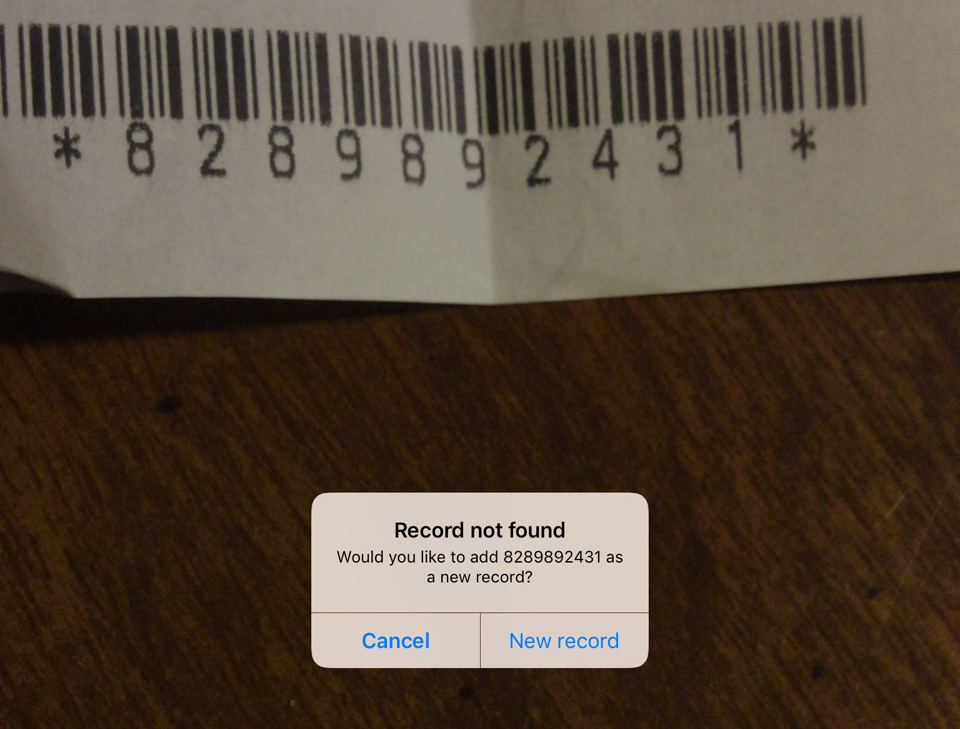
You are probably already using your phone to compare prices at your local store.  It is amazingly easy to simply scan a product’s barcode and instantly see the best available price locally or online.  Since virtually every phone/tablet now has a built-in camera, you can use that to scan barcodes or QR codes to associate data entry with a tagged location or asset. This can save you from possible mismatch errors that can occur when simply selecting from a list or typing in data.

Locus Mobile - barcoding

For users with thousands of locations/assets, it’s also a huge time saver when you can skip the long list of locations and just point and click. Moreover, for anyone tracking assets or even chemical inventory, barcodes are essential.  In fact, many facilities have been using barcodes for years, but now they don’t need a specialized device. Barcodes or QR codes can be incorporated into mobile apps in new and unexpected ways to streamline business process and do more in the field with less physical overhead.

Therefore, the next time you are doing an audit, you can easily examine an instrument and immediately determine its calibration and maintenance status along with reporting any audit findings.


Real-time entry validation

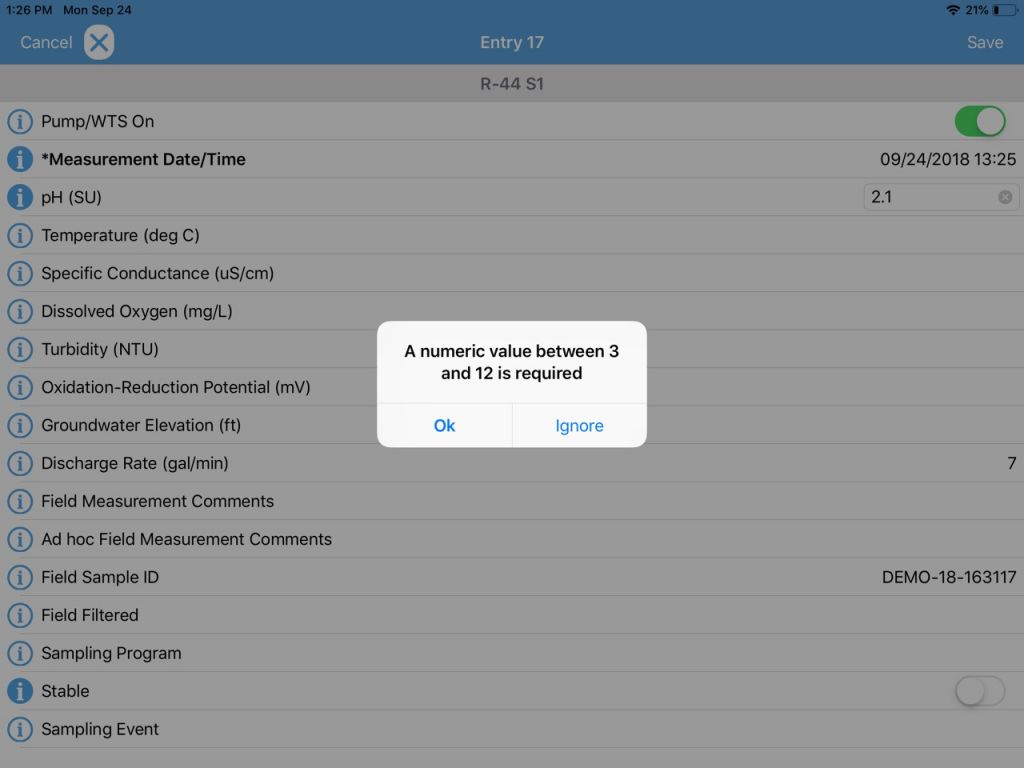
It is not enough to just enter your EHS event information into a mobile device.  You also want to make sure you are entering correct information.  Modern EHS mobile tools can check your entry as you enter it, to match whatever criteria are established for that data.  So you make sure that you’re entering a pH reading of 7.2, rather than 72.  You can also use configurable pick lists to limit data entry to your specific desired entries and not have to deal with misspellings or 16 different ways to say “cloudy”.  Make sure that pick lists are configurable and can be shared with each of your company’s devices.

Locus Mobile - range limits


Use your voice

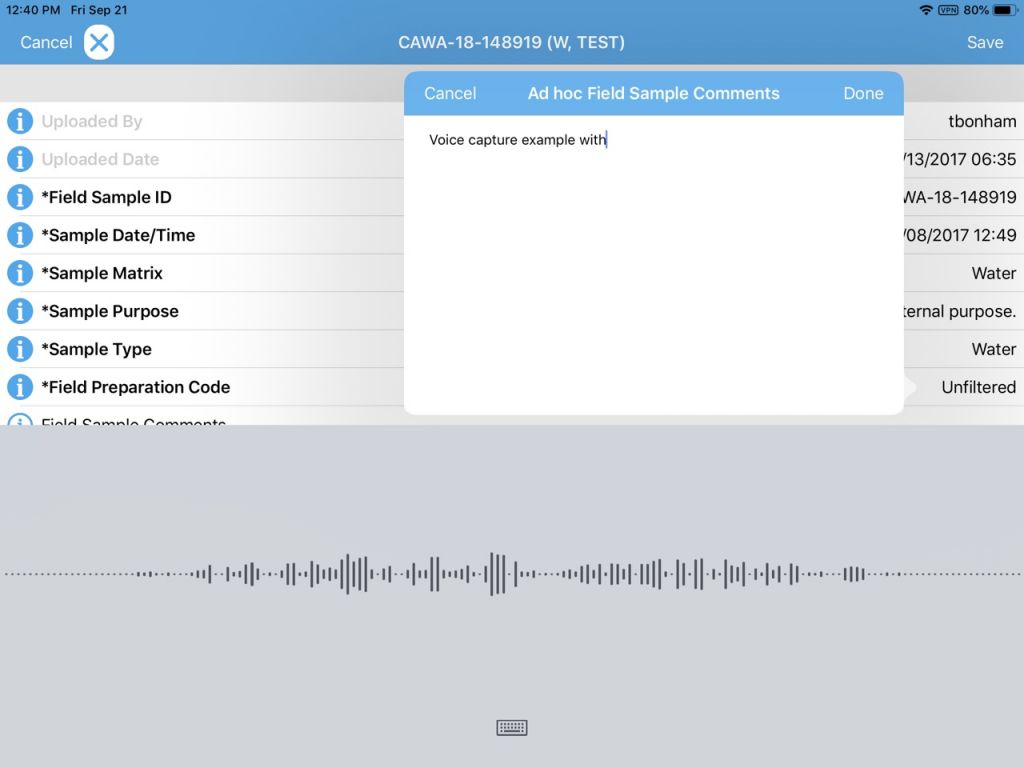
We are starting to use voice recognition technology in our mobile devices to quickly send out text messages.  Why not use it for recording audit comments or field issues?  Voice recognition is getting better and better every year, and can get your comments onto a data collection form much faster than typing and can be especially useful for conditions where gloves are required and typing or stylus input is not practical.  Using the phone’s native abilities, take advantage of voice feature to streamline note taking knowing you can always fix up any issues back in the office.

Locus Mobile - voice recognition


Unique and custom forms

For many EHS programs, you may have your own data collection needs that are specific to your facility or industry.  Mobile EHS apps now allow you to tailor your input forms to add new data fields, remove unwanted fields, change some of the logic like making certain fields required, and make certain fields tied into established pick lists.  Even better, you can match the mobile form exactly to the original paper form, making the transition to mobile simple and intuitive for staff.

Locus Mobile - Custom Form

Along with form customization options, modern mobile apps let you have many different forms in one app, so the folks tracking waste shipments have their form, while to folks performing facility audits have their forms, which may be specific to the facility of the audit itself.  One app with many forms greatly streamlines the training aspect of deploying mobile and gives EHS managers great flexibility to easily update forms when regulations change.


[sc_button link=”https://www.locustec.com/applications/mobile-field-data-collection/” text=”Learn more about Locus Mobile” link_target=”_self” background_color=”52a6ea” centered=”1″ separator_style=”double”]

Taking your environmental data to the next level with advanced integrated GIS features

In our last GIS blog, we covered some tips for choosing an integrated GIS/environmental data management system.  Now let’s look at some more advanced features that may be appealing to a wide range of data managers and facility owners.


1) Look for ways to integrate GIS base maps from other sources—so you can easily add piping diagrams, facility building layouts, or watersheds and drainage.

A map is much more meaningful with your facility information.  Google maps are great, but they won’t show your current building layout and your pipe and sewer diagrams.  So look for the capability to display maps created by other internal departments, like facilities or operations, so you can gain more insights from your data and have information readily available to share with other parts of the company who may disturb the area with digging or construction activity.

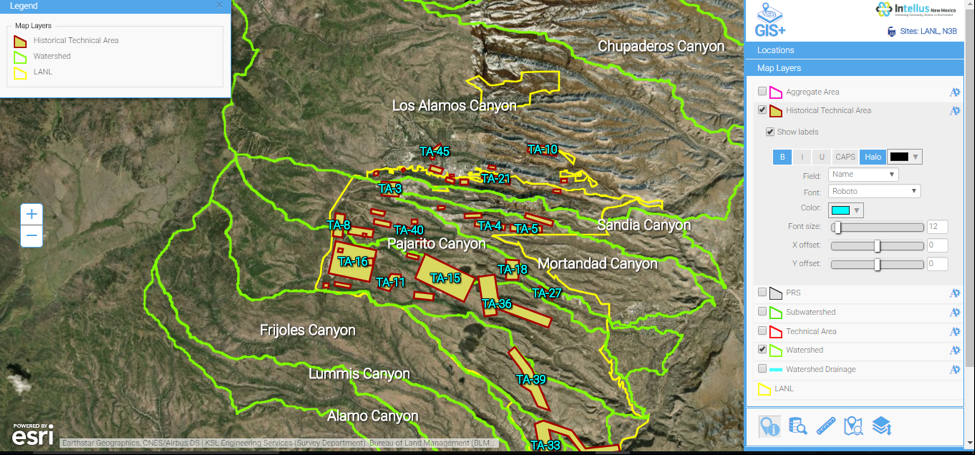
GIS+ - Intellus - historical buildings and watersheds

In this example from the Intellus website, environmental data can be visualized in relation to historical buildings and watersheds, both elements created by internal mapping departments. Internal base maps can also replace default maps from Esri or Google.


2) Load in other data from the Esri cloud to leverage a wide range of available data for your facility and use it with your GIS+ layers.

With the right GIS solution, it’s easy to bring in data from any public source, including government agencies, such as EPA. Combining your map with the world of online data can bring fresh insights to your environmental compliance challenges.

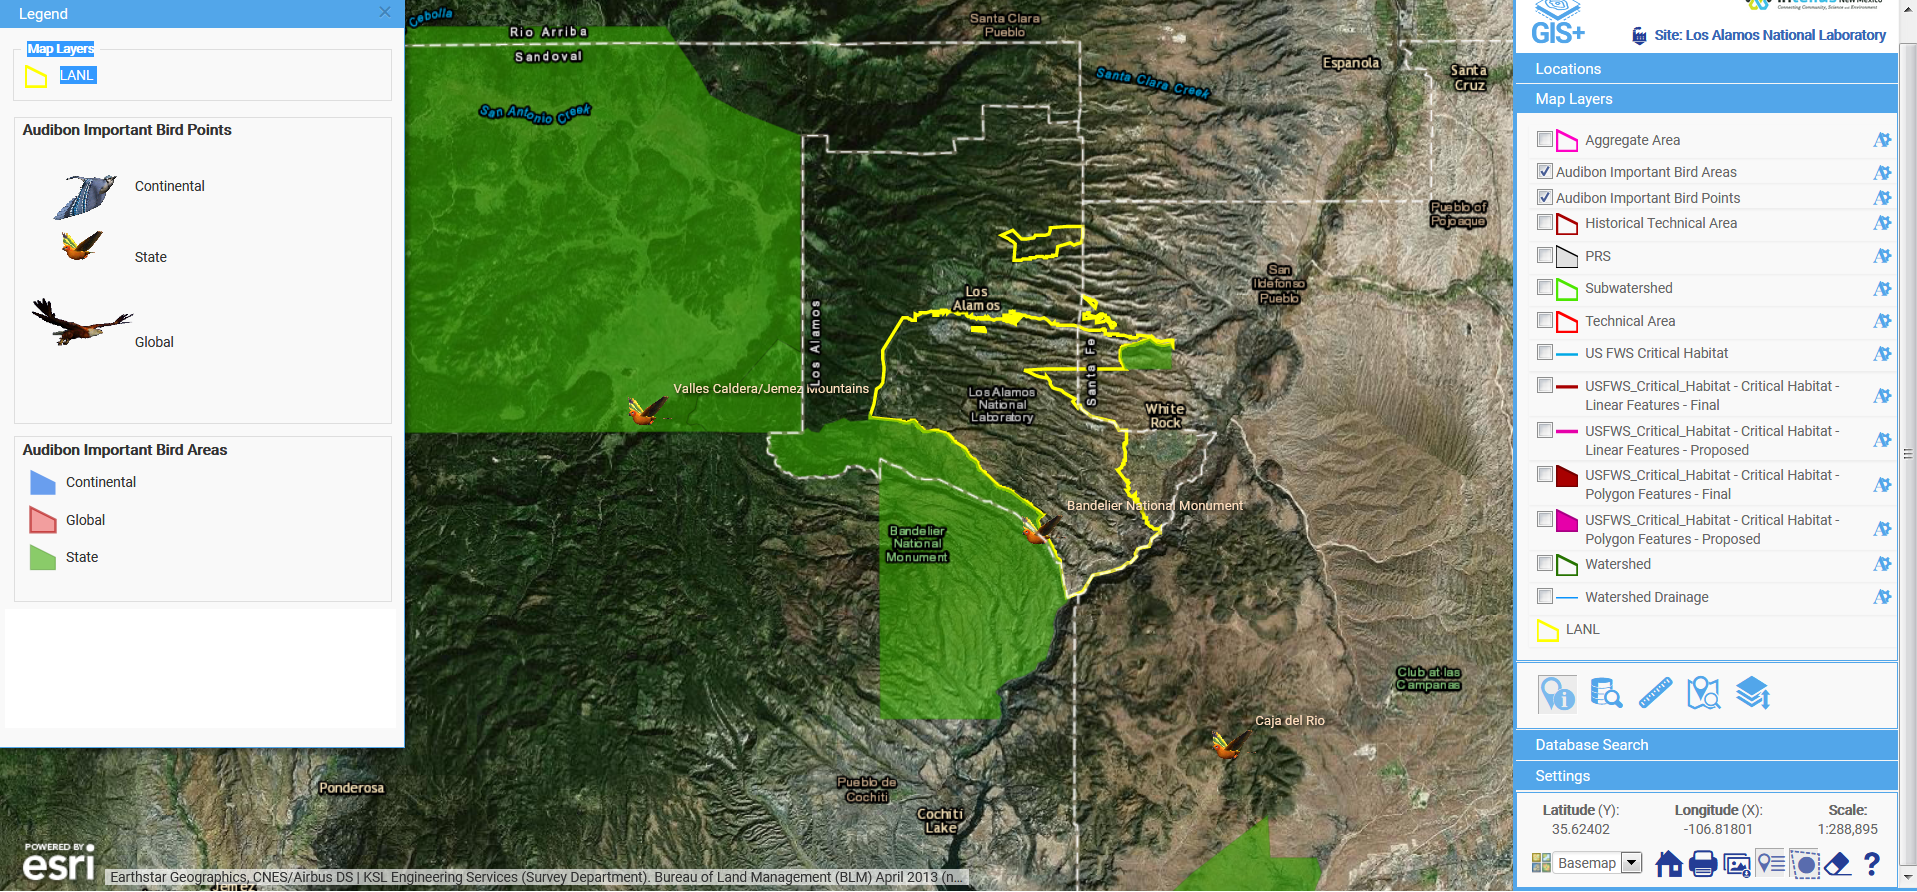
GIS+ - Intellus - audubon layers

In this example, GIS is used to merge Audubon bird points with Los Alamos National Laboratory (using the Intellus website).


3) Add reference information, such as photos and reports, to locations, and access them from the map.

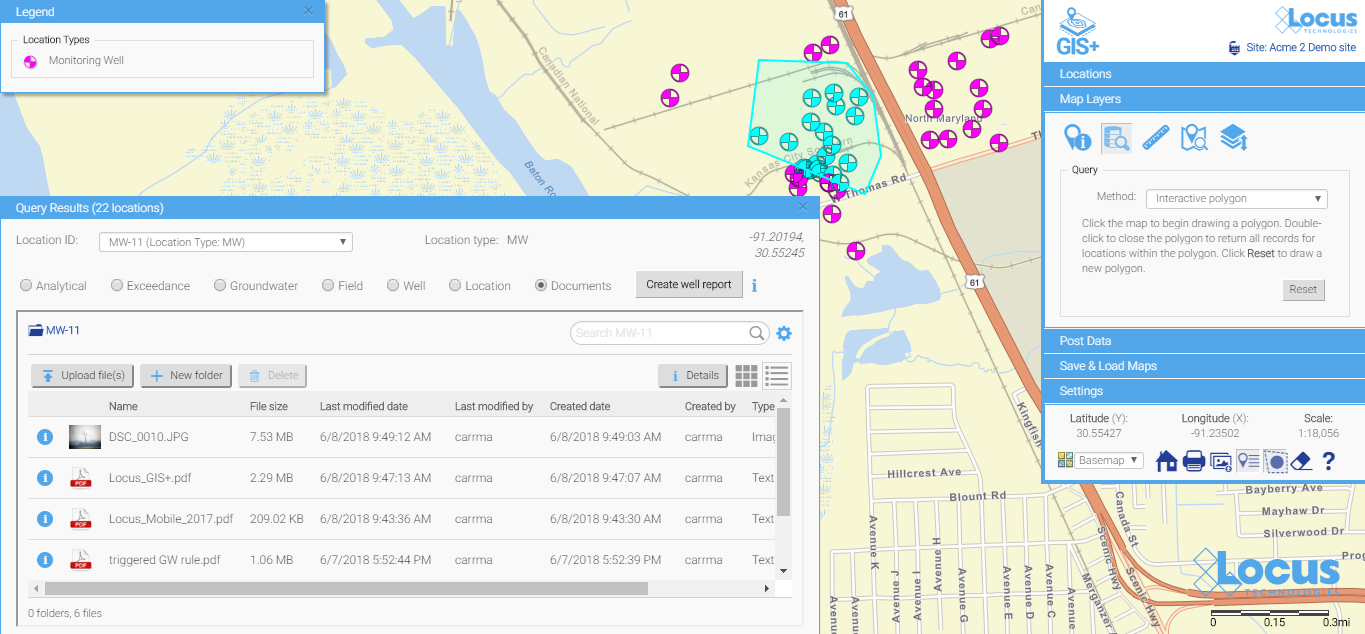
Using a freeform polygon search (another must-have in a GIS tool), users can highlight an area and—with a single click—see all the data, field photos, and reports associated with that area. This is especially useful for active facilities where activities are planned in areas with legacy contamination (“know before you dig!”).  This type of functionality makes it simple for less savvy map users to easily get the information they need.

GIS+ - Intellus - freeform polygon tool

In this example, a polygon tool was used to highlight an area, and all data, documents, reports associated with ALL locations within the selected area are available from the map. These functions let facility staff review key environmental information before conducting activities at a facility location.


4) Better understand complex and dense maps with clustered locations.

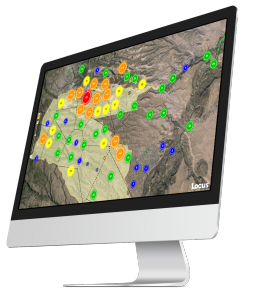
Some facilities or sites have very dense sampling locations that can be a challenge to view on maps due to overlapping data points. Using the concept of clustering, one can more easily view the dense data, with results color-coded to help focus the review.  Clicking on the cluster reveals the details underneath for more close review.

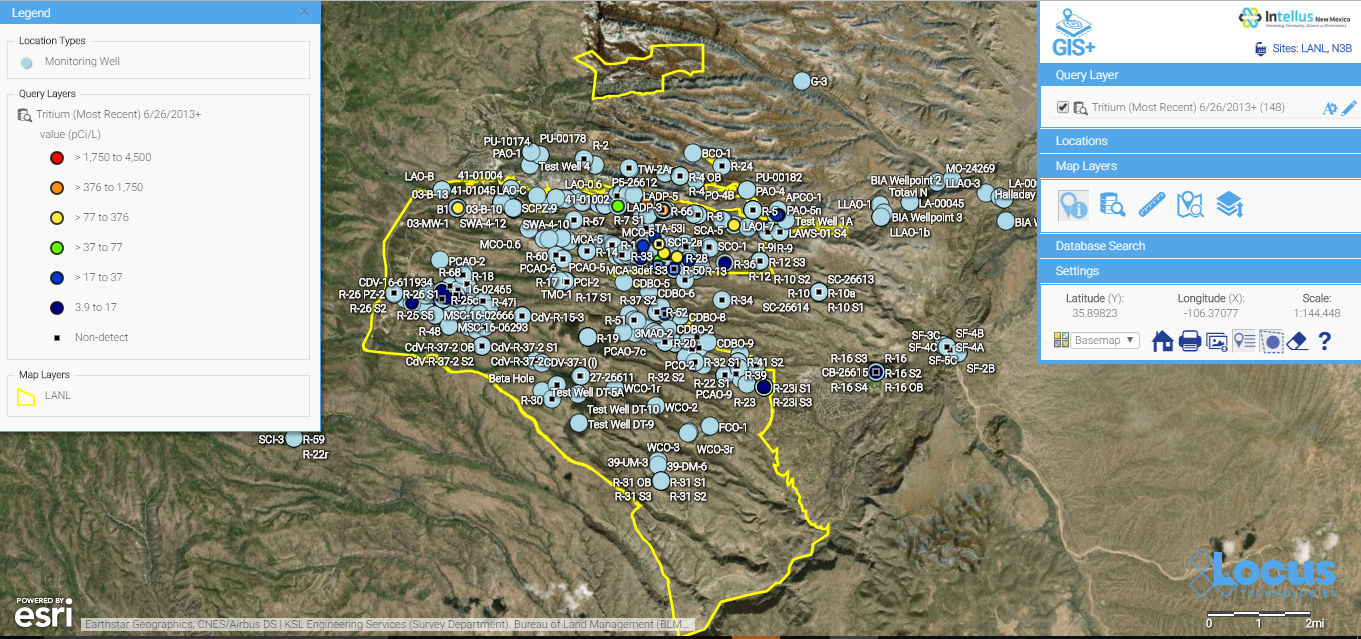
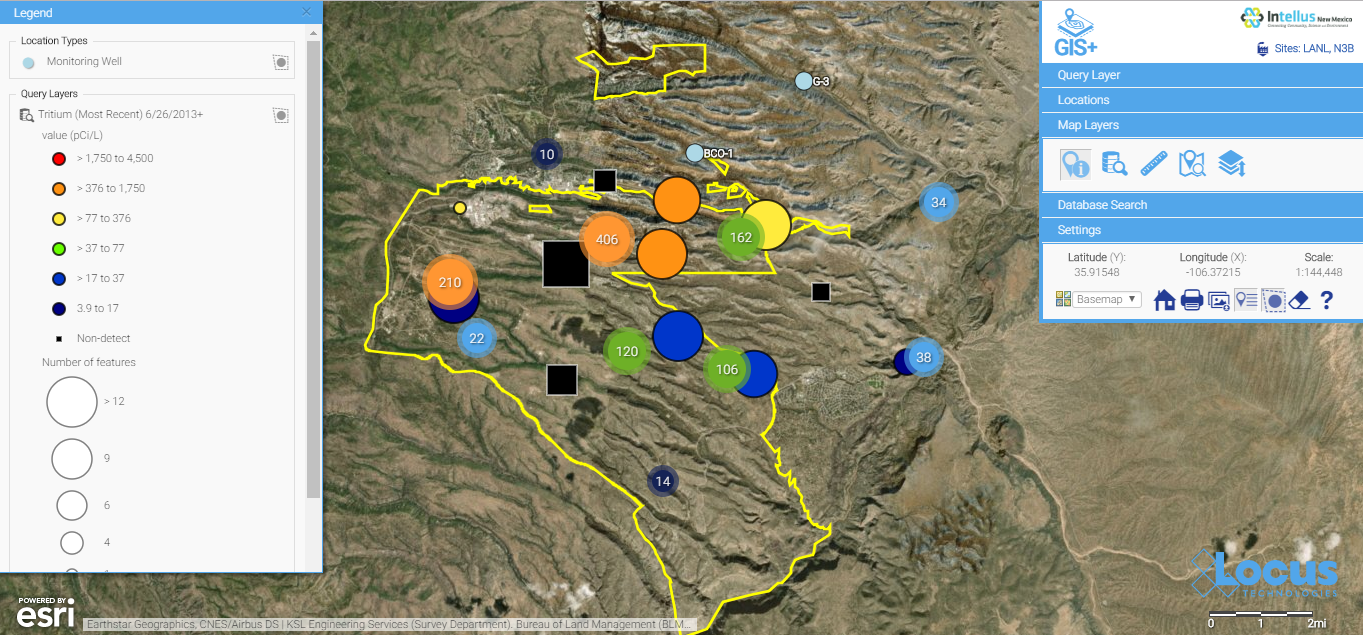
In this example, tritium in monitoring wells at the Los Alamos site in New Mexico is being reviewed on the map. Without clustering, the map is impossible to read or use effectively. With clustering, the orange circles (“clusters”) indicate higher concentrations of the contaminant, and clicking on the cluster reveals the individual data points it contains.

GIS+ - Intellus - pre clustering

Before clustering is applied, we have a very difficult-to-read map.

GIS+ - Intellus - post clustering

After clustering is applied, the map is much more useful—colors focus the user on the higher concentration areas.


5) Watch trends or changes over time with time layers.

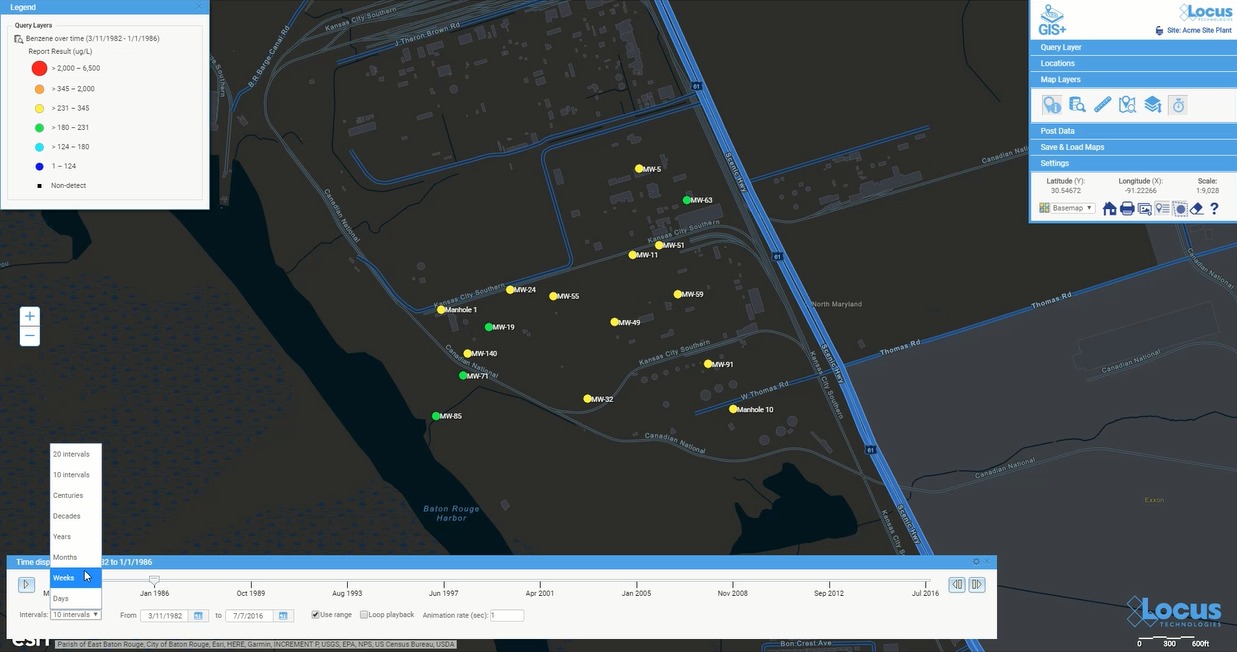
Imagine being able to watch changes in data over time with a simple slider control. An integrated GIS can provide that clarity over all the data in your database, so you can watch the progress of a cleanup, track chemicals in your water distribution system, or watch a groundwater plume move over time.

GIS+ time slider


6) Search for sampling results near a given address or within a given distance from selected map features.

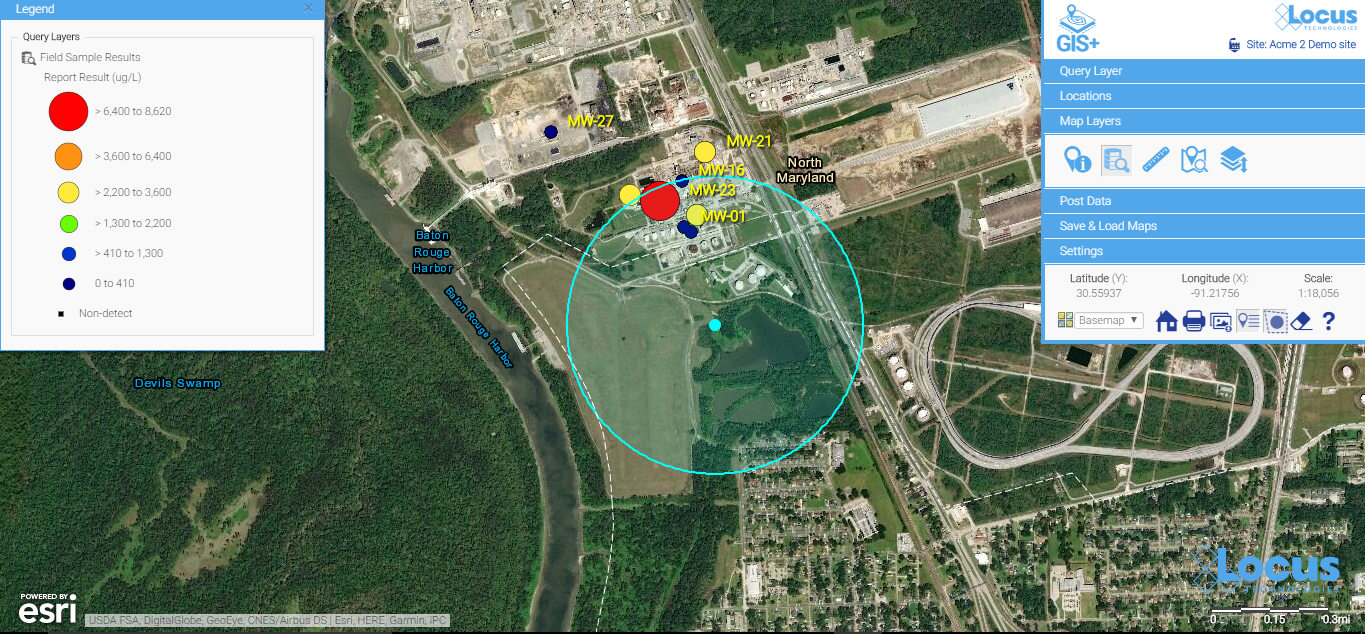
For sites with concerned neighbors, it’s key to know what chemicals or other environmental conditions may be affecting them. With GIS tools, it’s easy to put in an address and see what is within a radius, or to look within a distance from a specific location.  In this example, you can see that there are no sampling locations within a 2000-ft radius from the center point.  You can also type in an address and see what is nearby.

GIS+ radius query

Looking at a 2000-ft radius from a location to see what is nearby.


7) Turn data into insights with data callouts.

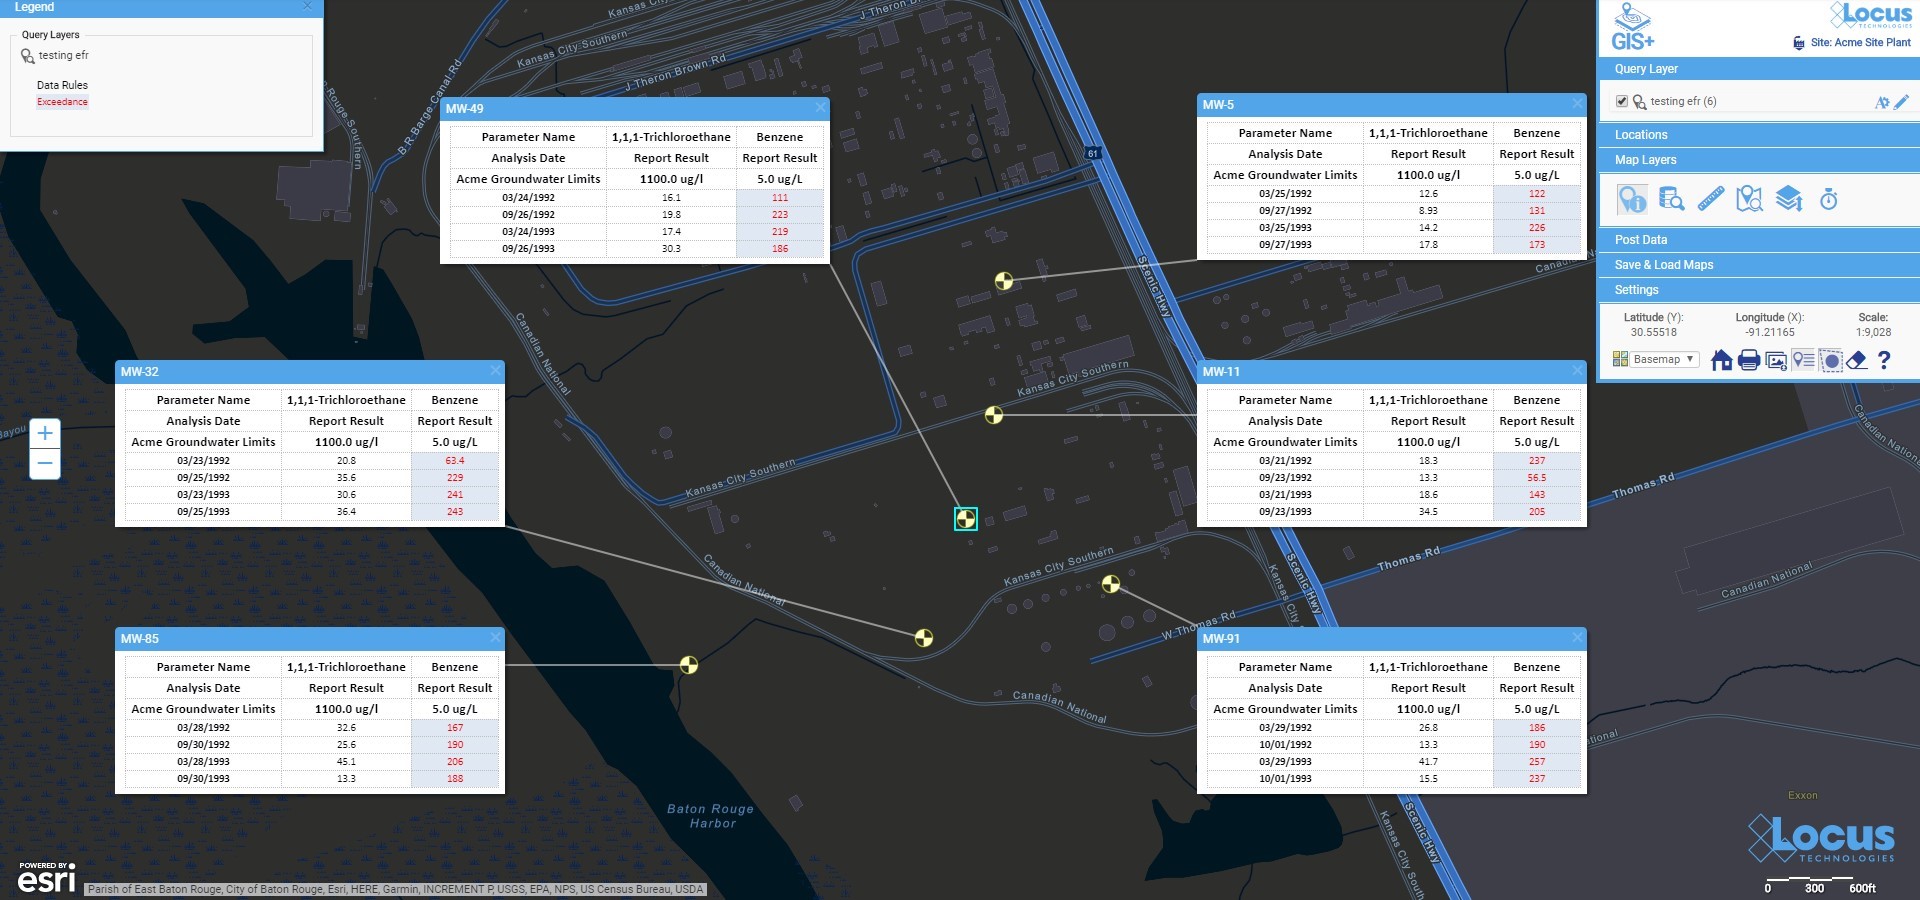
The more information you can provide to users in a format that highlights results in a meaningful way, the more you can help streamline review and analysis for any data review effort. GIS tools that support data callouts (with logic to highlight actionable results) can quickly convert a mass of data into a clear picture of the issues at a facility or site.

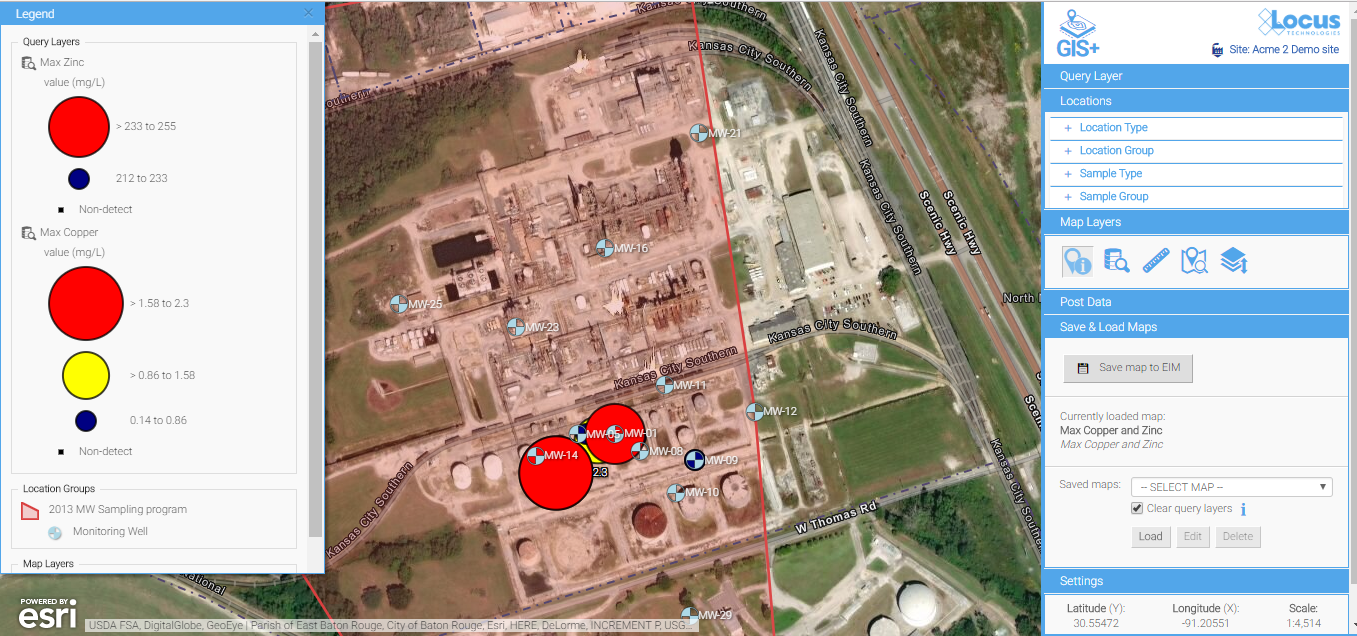
In the map below, data summaries are presented on a facility map to show areas with results above an action limit and associated with other detected parameters. Reviewers can easily see the exceedances (in red) and pinpoint where the issues lie. Although these maps may look complicated to produce, they can be integrated with standard reporting tools that generate maps at the click of a button.

GIS+ data callouts


Intrigued by the possibilities?

When you’re evaluating an integrated GIS solution, make sure to dig deeper than the obvious necessary features to learn about all the advanced functionality that is available or on the product roadmap.  The best solutions will already have some truly powerful capabilities available, with an even longer list of upcoming features.

Your environmental information management will evolve to the next level when you have the flexibility of visualizing your data in so many ways.  Happy mapping!

Screenshot of Locus GIS location clustering functionalitySee your data in new ways with Locus GIS for environmental management.
Locus offers integrated GIS/environmental data management solutions for organizations in many industries.
Find out more >

Get a demo of Locus GIS

Error: Contact form not found.

Tips for choosing a GIS application for your environmental database

You can turbocharge your water data management by including a geographical information system (GIS) in your toolkit! Your data analysis efficiency also gets a huge boost if your data management system includes a GIS system “out of the box” because you won’t have to manually transfer data to your GIS. All your data is seamlessly available in both systems.

Not all GIS packages are created equal, though. Here are some tips to consider when looking at mapping applications for your environmental data:


1) Confirm that integration is built-in and thorough

Mapping is easy when properly integrated with your environmental database. You should not need extra filters or add-on programs to visualize your data. Look for built-in availability of features, such as “click to map”, that take the guesswork and frustration out of mapping for meaningful results.

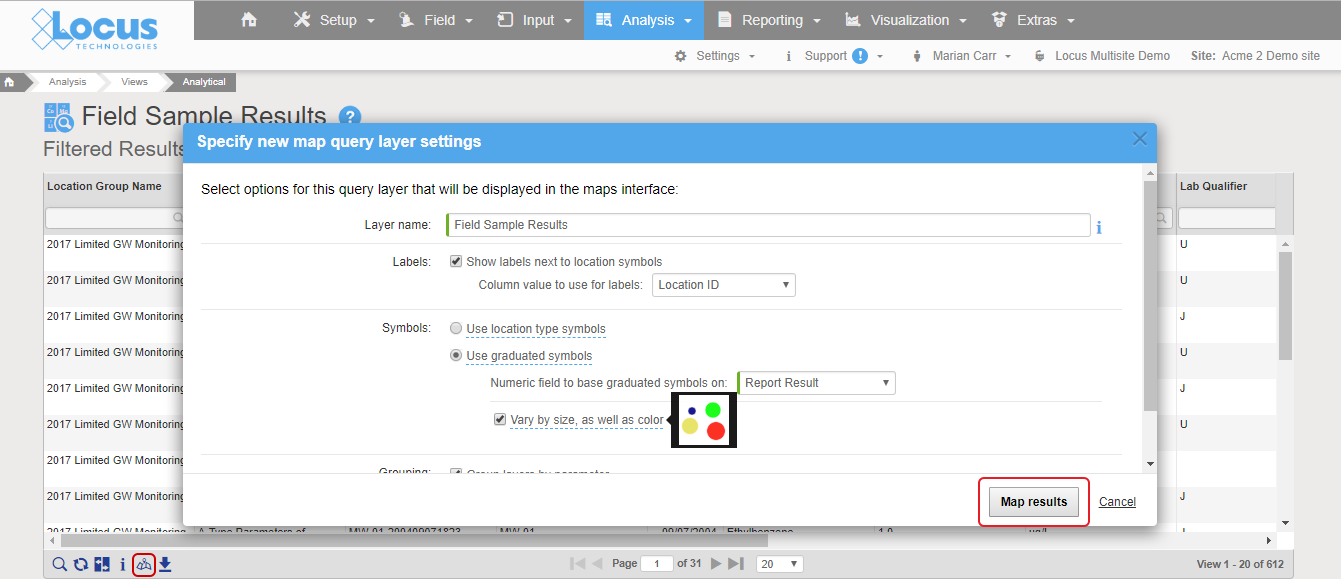
Locus GIS+ Analytical Query

Good integration means mapping is as easy as clicking a “show on map” button. In Locus EIM, you can run a data query and click “Show results on map” icon, change the default settings if desired, and instantly launch a detailed map with a range of query layers to review all chemicals at the locations of interest.

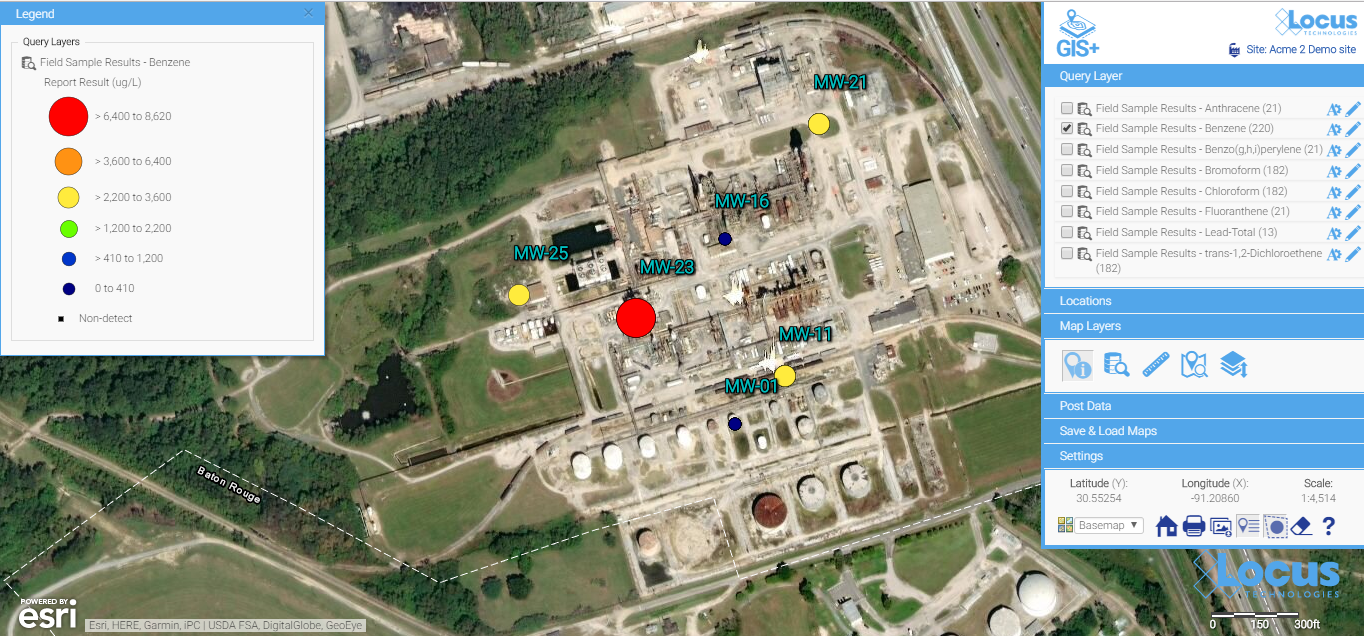
Locus GIS+ Analytical Query Map

All the query results are presented as query layers, so you can review the results in detail. This map was created with the easy “show results on map” functionality, which anyone can use with no training.


2) Check for formatting customization options

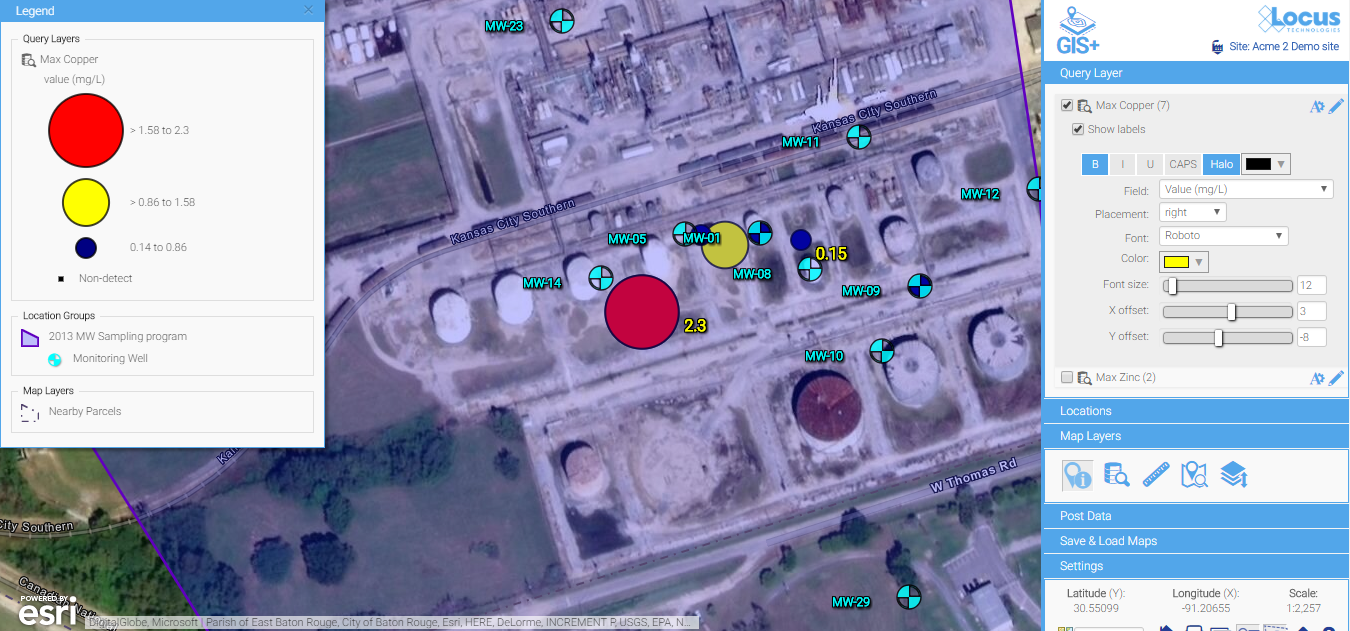
Look for easy editing tools to change the label colors, sizes, fonts, positioning, and symbols. Some map backgrounds make the default label styles hard to read and diminish the utility of the map, or if you’re displaying a large quantity of data, you’ll almost certainly need to tweak some display options to make these labels more readable.

Locus GIS+ label styles

Default label styles are legible on this background, but they are a bit hard to read.

Locus GIS+ label styles

A few simple updates to the font color, font sizes, label offset, and background color make for much easier reading. Changes are made via easy-to-use menus and are instantly updated on the map, so you have total control to make a perfectly labeled map.


3) Look for built-in contouring for quick assessment of the extent of the spatial impact

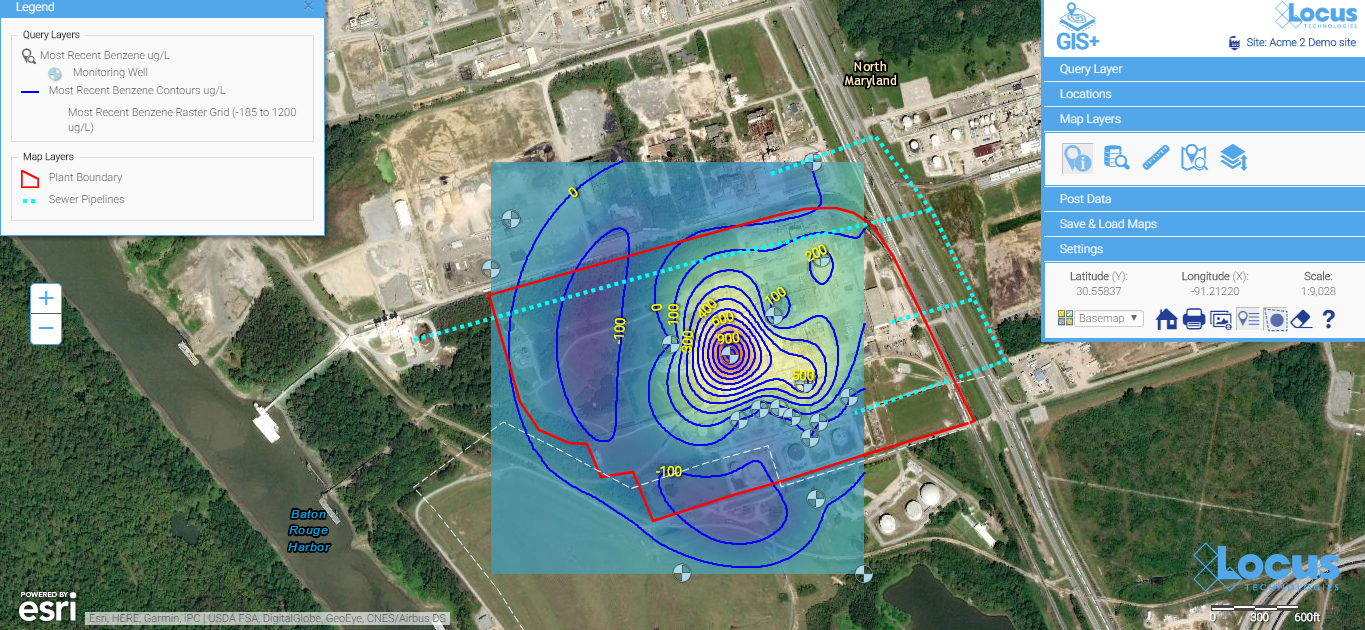
Contours can be a great way to visually interpret the movement of contaminants in groundwater and is a powerful visualization tool. In the example below, you can clearly see the direction the plume is heading and the source of the problem. An integrated GIS with a contouring engine lets you go straight from a data query to a contour map—without export to external contouring or mapping packages. This is great for quick assessments for your project team.

Locus GIS+ contours

Contour maps make it easy to visualize the source and extent of the plumes. They can be easily created with environmental database management systems that include basic contouring functionality.


4) Look for something easy to use that doesn’t require staff with specialized mapping knowledge

Many companies use sophisticated and expensive mapping software for their needs. But the people running those systems are highly trained and often don’t have easy access to your environmental data. For routine data review and analysis, simple is better. Save the expensive, stand-alone GIS for wall-sized maps and complex regulatory reports.

Locus GIS+ saved chlorine map

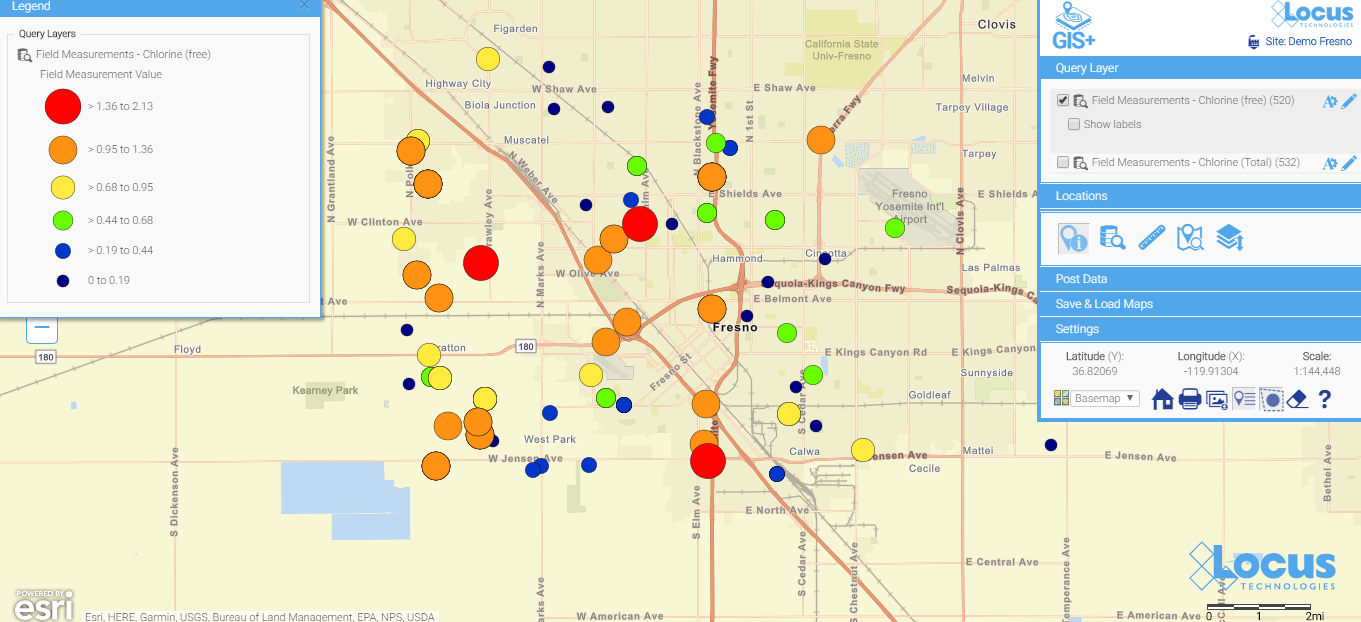
Here is a simple map (which is saved, so anyone can run it) showing today’s chlorine data in a water distribution system. You don’t have to wait for the GIS department to create a map when you use a GIS that’s integrated with your environmental database system. When data are updated daily from field readings, these maps can be incredibly helpful for operational personnel.


Screenshot of Locus GIS location clustering functionalitySee your data in new ways with Locus GIS for environmental management.
Locus offers integrated GIS/environmental data management solutions for organizations in many industries.
Find out more >

Get a demo of Locus GIS

Error: Contact form not found.

Taking the next steps

After viewing some of the many visualization possibilities in this blog, the next step is make some maps happen!

  1. Make sure your environmental data system has integrated mapping options.
  2. Make sure your sampling/evaluation/monitoring locations have a consistent set of coordinates. If you have a mixed bag of coordinate systems, you will need to standardize. Otherwise, your maps will not be meaningful. Here are some options to try, as well as some good resource sites:
  3. Start with a few easy maps—and build from there.

Happy  mapping!

Locus EIM SaaS environmental software selected by Hudbay Minerals

The Locus EIM SaaS with integrated GIS mapping will streamline environmental field and analytical data management and reporting for Hudbay Minerals

MOUNTAIN VIEW, Calif., 19 June 2018 — Locus Technologies (Locus), the industry leader in multi-tenant SaaS EHS and environmental management software, is pleased to announce that Hudbay Minerals, a premier mining company in Canada, will use Locus EIM to improve their environmental data management for field and analytical data reporting. In addition to the standard features of Locus EIM, Hudbay Minerals is opting to use Locus’ GIS+ mapping solution, Locus Mobile for iOS, and the robust LocusDocs document management solution to enhance and streamline their processes.

Locus EIM and the integrated GIS+ solution will help Hudbay Minerals to improve efficiency of sampling and monitoring activities for both field and analytical data. The SaaS solution is enhanced by Locus Mobile for field data collection, which works offline without any internet connection.

“The Hudbay team in Arizona looks forward to working with the Locus team and using the system,” said Andre Lauzon, Vice President, Arizona Business Unit at Hudbay.

“By using the powerful smart mapping technology of Locus GIS+, powered by Esri and integrated with all the functionalities of Locus EIM, Hudbay Minerals can save data queries as map layers to create more impactful visual reports,” said Wes Hawthorne, president of Locus Technologies.

Aquam Corporation selects Locus Technologies software for IoT integration

Aquam Corporation integrates Locus software to Orbis Intelligent Systems platform, ensuring a robust, reliable, and secure data platform

MOUNTAIN VIEW, Calif., 5 June 2018 — Locus Technologies (Locus), a leader in multi-tenant Software-as-a-Service (SaaS) for environmental compliance and sustainability management, will provide its IoT integration capability to Aquam Corporation (“Aquam”), a global provider of risk mitigation technologies for water and energy transmission and distribution assets, to create a robust data platform for its customers via Orbis Intelligent Systems.  The Locus software will be integrated with the Orbis platform to allow interconnectivity across multiple devices, data streams, and geographical locations.

Orbis Intelligent Systems is positioned to be a market leader in infrastructure and water quality data-driven monitoring for commercial, domestic and utility applications.

“We chose Locus software for the reliability and data security that enables our technology platform to operate with robust, data-driven communication for all Aquam customers around the world to utilize. With the integration of rapidly scalable Locus software, we are at the forefront of IoT and well-positioned to offer asset ‘active management’—a core value to our customers and value proposition,” said Danny Krywyj, president for Orbis.

Locus Technologies’ multi-tenant cloud platform can help organizations to manage, organize, and monitor the structured and unstructured data coming from various sources.  This allows customers to create a centralized data repository to analyze the key indicators for environmental data management, sustainability, and environmental compliance.

“Aquam Corporation will reap the benefits of IoT integration for monitoring data  generated by different streaming devices, by centrally connecting these sources in a scalable cloud-based application for better managing compliance. Real-time monitoring of data directly and effectively solves many challenges related to smarter environmental management and sustainability initiatives,” said Wes Hawthorne, president of Locus Technologies.


ABOUT AQUAM CORPORATION

Aquam Corp is a global provider of technology solutions for water and energy distribution infrastructure. We ensure the health, longevity, safety, and reliability of vital resources for water and gas utility, municipal, commercial, residential, and industrial markets. Our award-winning proprietary technologies address water scarcity issues by the diagnosis, cleaning, and remediation of aging infrastructure. Aquam also provides end-to-end service solutions and technologies for the maintenance, life extension, and full rehabilitation of network distribution infrastructure, which include: Nu Flow Technologies, a leader in small-diameter infrastructure rehabilitation technologies; Specialized Pipe Technologies (SPT), a pipe assessment and rehabilitation services provider; Aquam Pipe Diagnostics, a global pipeline assessment specialist.  Aquam services are available in North America, South America, Europe, Africa, Australasia, and the Middle East. For more information visit www.aquamcorp.com or contact aquam@missionC2.com.

Locus Technologies to offer its EHS multi-tenant SaaS Locus Platform on Amazon Web Services

Locus and AWS will simplify and expand how customers capture, analyze and take action on EHS compliance and sustainability activities

MOUNTAIN VIEW, Calif., 24 April 2018 — Locus Technologies (Locus), a leader in multi-tenant Software-as-a-Service (SaaS) environmental compliance and sustainability management, today announced it will offer its award-winning EHS Locus Platform SaaS on Amazon Web Services (AWS). Locus announced it will deliver Locus SaaS services designed to simplify and expand how customers capture, analyze and take action on their data and EHS compliance activities. Additionally, Locus announced that the AWS US West (Oregon) Region will be the first new AWS Region supported in Locus’ planned international infrastructure expansion on AWS. Locus’ customers will be able to use the company’s core service—including Locus Platform and more—delivered on AWS, with general availability expected in May 2018. Locus Environmental Information Management (EIM) will be moved to AWS in early 2019.

Locus also plans to deliver integrations that will connect the Locus Platform with AWS Internet of Things (IoT), Amazon CloudFront, and Amazon Virtual Private Cloud (Amazon VPC). Locus intends to leverage AWS IoT by building a new native integration to help businesses generate value from the billions of events generated by connected devices such as real-time environmental monitoring sensors and environmental treatment systems controls.

AWS IoT is a set of cloud services that let connected devices easily and securely interact with cloud applications like Locus Platform and other devices. Locus IoT Cloud will connect with AWS IoT to combine device data with customer data in Locus Platform, allowing businesses to create meaningful customer experiences based on real-time activity and emissions monitoring across all their connected sensors and devices.

For example, a water utility company that maintains millions of IoT-enabled sensors for water flow, pressure, pH, or other water quality measuring devices across their dispersed facilities can use AWS IoT combined with Locus Platform as a whole solution to ingest and manage the data generated by those sensors and devices, and interpret it in real time. By combining water sensor data from AWS IoT with Locus IoT customer data, the water utility company will be able to automatically create an emergency shutdown if chemical or other exceedances or device faults are detected and will be better prepared to serve their customers.

By combining the powerful, actionable intelligence and rapid responsiveness through Locus Platform with the scalability and fast-query performance of AWS, customers can seamlessly analyze large datasets on arrival in real time. This will allow Locus’ customers to instantly explore information, find insights, and take actions from a greater variety and volume of data—all without investing the significant time and resources required to administer a self-managed on-premises data warehouse.

Locus Platform offers a highly configurable, user-friendly interface to fully meet individual organizations’ environmental management needs.  “Locus Platform, when combined with the power and security of AWS, can improve companies’ data collection, analysis, and most importantly, reporting capabilities, resulting in streamlined EH&S compliance and the mitigation of regulatory risks and fines.”  said Wes Hawthorne, President, Locus Technologies.

WM Symposia 2018 provided an excellent showcase for Locus GIS+ in LANL’s Intellus website

At the annual WM Symposia, representatives from many different DOE sites and contractors gather once a year and discuss cross-cutting technologies and approaches for managing the legacy waste from the DOE complex.  This year, Locus’ customer Los Alamos National Laboratory (LANL) was the featured laboratory.  During their presentation, they discussed Locus GIS+, which powers Intellus, their public-facing environmental monitoring database website.

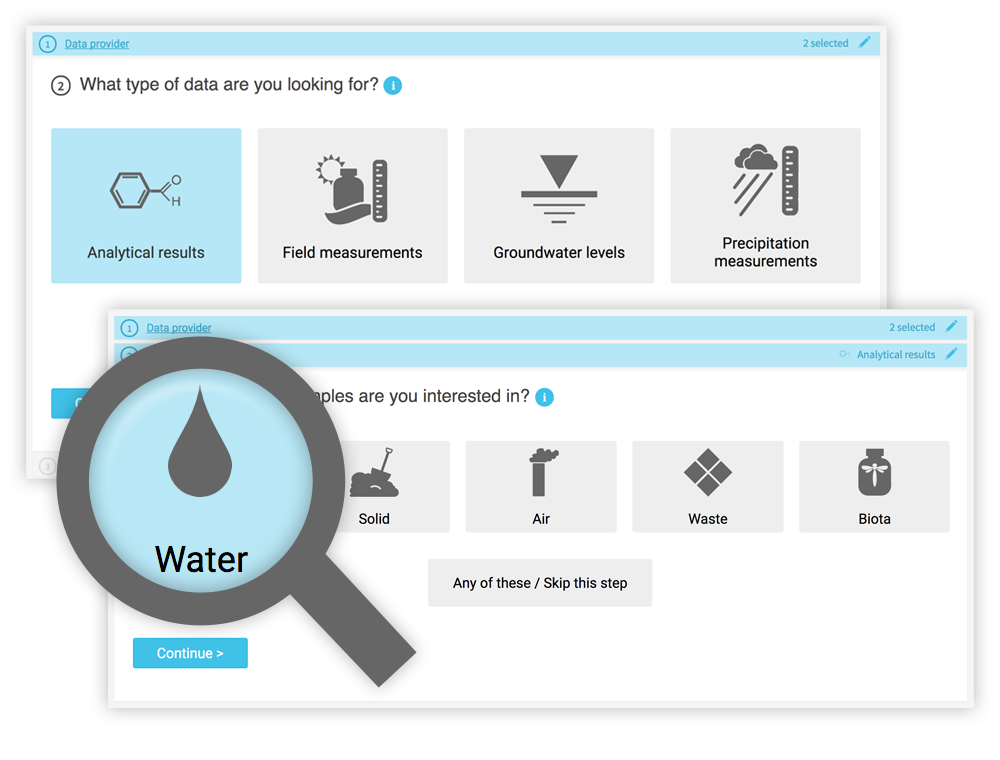
If you haven’t been to LANL’s Intellus website recently, you are in for a surprise!  It was recently updated to better support casual users, and it features some of the best new tools Locus has to offer.  Locus reimagined the basic query engine and created a new “Quick search” to streamline data retrieval for casual users.  The guided “Quick search” simplifies data queries by stepping you through the filter selections for data sources, locations, dates, and parameters, providing context support at each step along the way.

Intellus - quick searchWhile a knowledgeable environmental scientist may be able to easily navigate a highly technical system, that same operation is bound to be far more difficult for a layperson interested in what chemicals are in their water.  Constructing the right query is not as simple as looking for a chemical in water—it really matters what type of water you want to look within.  On the Intellus website (showing the environmental data from the LANL site), there are 16 different types of water (not including “water levels”).  Using the latest web technologies and our domain expertise, Locus created a much easier way to get to the data of interest.
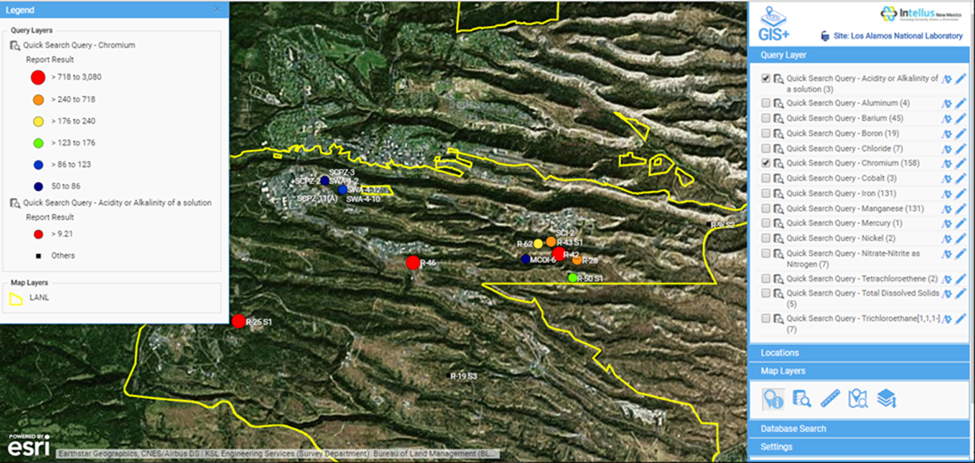
Just querying data is not necessarily the most intuitive activity to gain insights.  Locus integrated our new GIS+ visualization engine to allow users to instantly see all the data they just queried in detailed, context-rich maps.

Intellus GIS+ Map

Intellus GIS+ map showing “Quick search” query results for chromium levels in the LANL area

Instead of a dense data grid, GIS+ gives users an instant visual representation of the issue, enabling them to quickly spot the source of the chemicals and review the data in the context of the environmental locations and site activities.  Most importantly for Intellus users, this type of detailed map requires no GIS expertise and is automatically created based on your query.  This directly supports Intellus’ mission to provide transparency into LANL’s environmental monitoring and sampling activities.

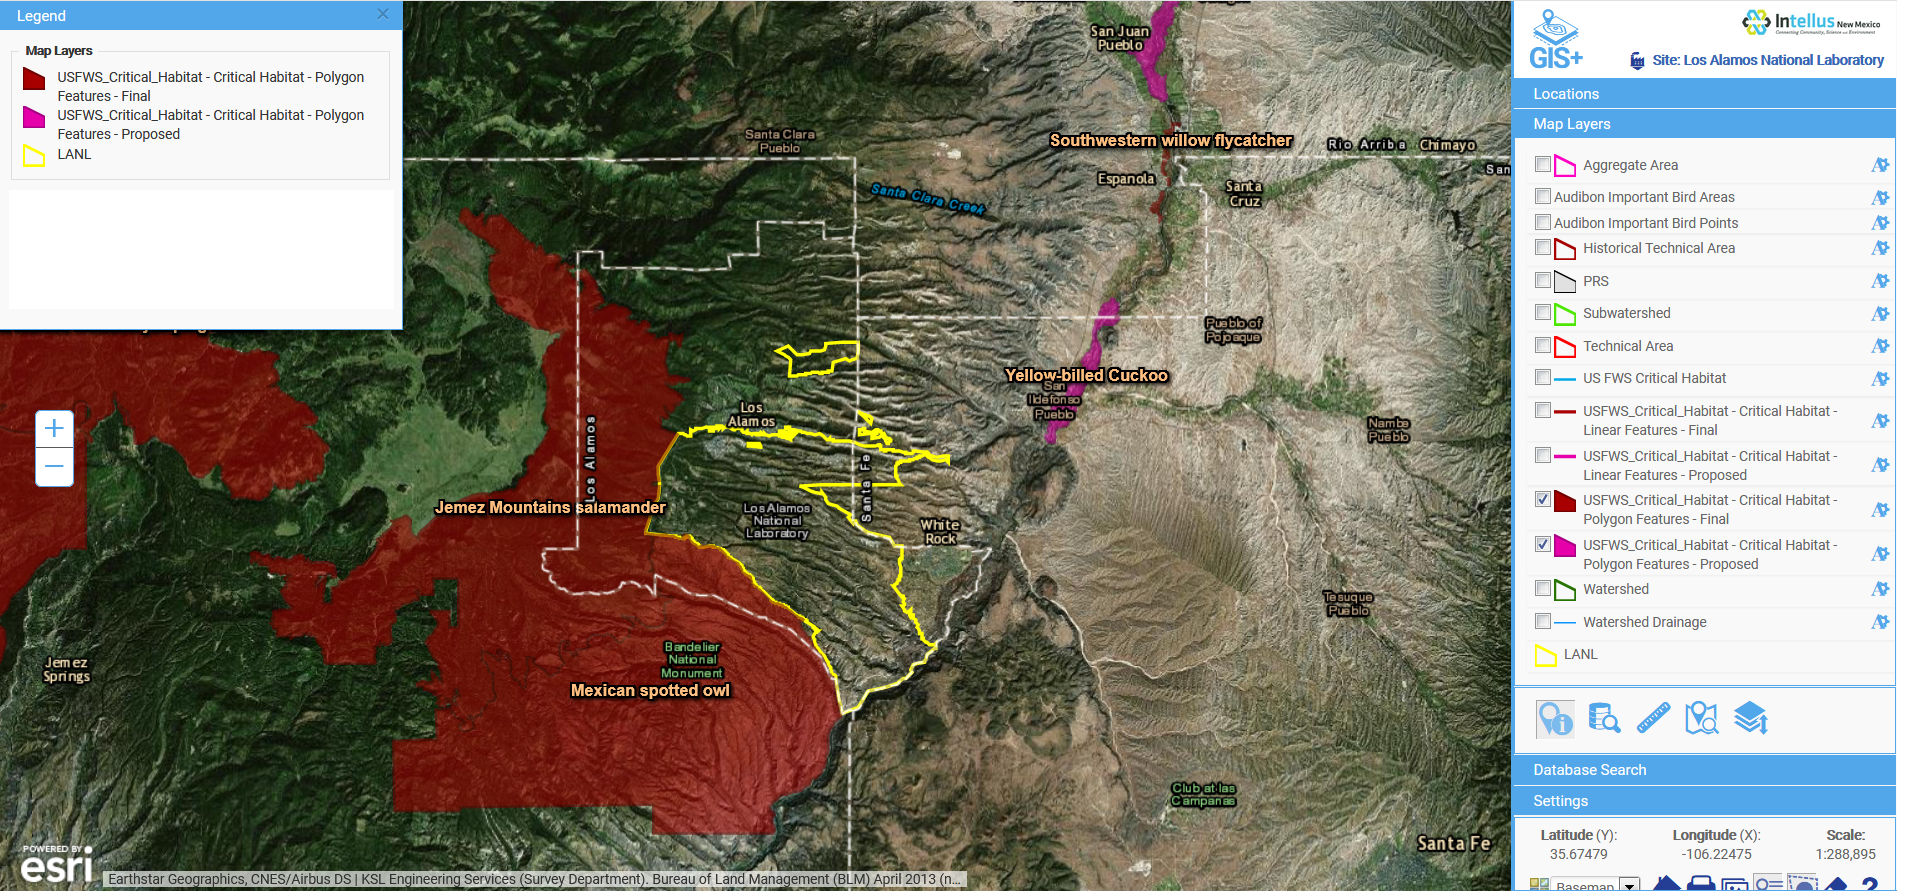
GIS+ also allows users (albeit with a bit more experience in GIS mapping) to integrate maps from a wide range of online sources to provide even more insight to the available data.  In the example below, we overlaid the publicly-available US Fish and Wildlife critical habitat maps with data from the LANL site to show the relationship of the site to critical habitats.  This type of sophisticated analysis is the future of online GIS.  Locus takes full advantage of these opportunities to visualize and integrate data from varying sources with our GIS+ tools, made simple for users and integrated with ArcGIS Online by Esri.

Intellus GIS+ Map

Intellus GIS+ map showing imported layers of US Fish and Wildlife critical habitats in relation to LANL environmental sampling data

WM 2018 - Sean and Nita

Overall, Locus is very proud of our cross-cutting environmental information management tools.  We were one of many WM18 attendees enjoying LANL’s presentation and getting even more ideas from the audience on the next steps for better environmental visualization.

[sc_button link=”https://www.locustec.com/wp-content/uploads/2018/03/WM-18-PPT.pdf” text=”View a copy of the presentation” link_target=”_blank” color=”ffffff” background_color=”52a6ea”]

Webinar: IoT technology for enhanced environmental compliance

IoT is considered one of the fastest growing trends in technology and has a potentially huge impact to automate how we manage water quality, air emissions and other key environmental performance indicators for data monitoring.

In the following webinar, we focused on how various industries can benefit from integration and interoperability of a multi-tenant cloud platform and Internet of Things (IoT) platforms for managing, organizing and monitoring the structured and unstructured data coming from various different sources. Once in the platform, a centralized data repository is created that is suitable for analyzing the key environmental indicators for management, sustainability and environmental compliance.


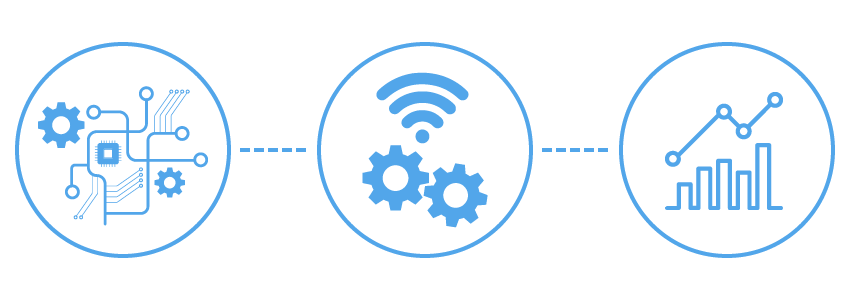
With the deployment of IoT through several automated technologies like sensors, programmable logic controllers (PLCs) and other internet and mobile connected devices and other instruments, a masses of real time data is generated that not only needs to be stored but analyzed and managed at interception along with several other sources of structured and unstructured data from different sources. All this data generated by different streaming devices need to be connected through a central place in a scalable cloud-based application to manage compliance and help in real time monitoring of data to come up with for effective solutions for a smarter environment management and sustainability initiatives.

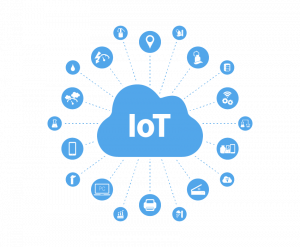
Internet of Things - IoT

IoT technology for environmental monitoring is a booming industry.  The IoT growth for the water industry alone is forecasted to be  $20.10 billion by 2021 that indicates the massive volumes of data will be generated that will need to be to be monitored, managed and analyzed in intelligent, well designed software systems. Excel spreadsheets and ad hoc in-house data systems will not be up to the challenge.

What is the core business problem challenge this webinar will help the audience to solve?

IoT - Internet of ThingsMany companies are concerned that the sheer volume of data will render the information useless, unless all sources of data mentioned above can be turned into actionable information. This challenge can be addressed via the deployment of a highly scalable, end-user configurable, SaaS-based multi-tenant cloud infrastructure, coupled with environmental data management and compliance software applications.  This configuration can connect all the incoming data and create a central data repository that is easily accessible and available for use with responsive data analytics.

A multi-tenant SaaS application can help to process the flow of information in an efficient and effective manner, providing better business and information analysis and interpretation by using various integrated tools. Such applications can help in real time monitoring and provide timely alerts for management and compliance.

Coupled with business analytics, the masses of data can be turned into concise and meaningful information for system users. This approach will solve the problem of managing too much information coming into the organization, and allow it to turn the streaming data into intelligent information to support desired decision-making.

What are the top takeaways attendees can expect to learn?

  • Learn how to create a single centrally accessible system for recording data from various data monitoring sources.
  • Learn how integrating IoT technologies and a multi-tenant SaaS cloud application can allow companies to switch from periodic monitoring on a prescribed schedule to continuous real-time monitoring, without increasing monitoring cost and thereby reducing operational costs.
  • Learn how to reduce compliance cycle time and benefit from smarter management solutions.
  • Leverage the benefits of cloud computing using real-time tools like GIS applications and rich business analytics for reporting and analysis, timely alerts, etc.


[sc_button link=”https://www.locustec.com/applications/automation-sensors-iot/” text=”More on IoT” link_target=”_self” color=”#ffffff” background_color=”#52a6ea” centered=”1″]

EHS&S in the age of blockchain technology

Blockchain is a highly disruptive technology that promises to change the world as we know it, much like the World Wide Web’s impact after its introduction in 1991. As companies look to the blockchain model to perform financial transactions, trade stocks, and create open market spaces, many other industries are looking at utilizing blockchain technology to eliminate the middleman. One sector well-positioned to benefit from blockchain technology is the data-intensive Environment, Health, Safety and Sustainability (EHS&S) space.

In particular, I see three major ways that the EHS industry can utilize blockchain technology to change how they manage information: 1) Blockchain-based IoT monitoring, 2) emissions management, and 3) emissions trading.

My belief is that blockchain technology will help to quantify the impact of man-made emissions on global warming trends and provide tools to manage it. One cannot manage what one cannot measure!

Imagine this: every emissions source in your company, whether to water, air, or soil, is connected wirelessly via a sensor or another device (thing) to a blockchain ledger that stores a description of the source, its location, emission factors, etc. Every time that the source generates emissions (that is, it is on), all necessary parameters are recorded in real time. If air emissions are involved, equivalent tons of carbon are calculated and recorded in a blockchain ledger and made available to reporting and trading entities in real time.

Blockchain ledgers may exist at many levels. Some may record emissions at a given site. Others at higher levels (company, state or province, country, continent, etc.) may roll up information from lower level ledgers.

Suppose that emissions are traded so that they are not yours anymore. In that case, someone else owns them, and you do not need to report them again, but everyone knows that you were the generating source. The same logic can be applied to tier 1, 2, and 3 level emissions. Attached to the emissions ledger are all other necessary information about the asset generating those emissions, financial information, depreciation schedule, time in service, operating time, fuel consumption, operators’ names, an estimate of future emissions—the list goes on.

To learn more how blockchain technology will impact emissions monitoring, management, reporting, and trading click here.