Tips for choosing a GIS application for your environmental database
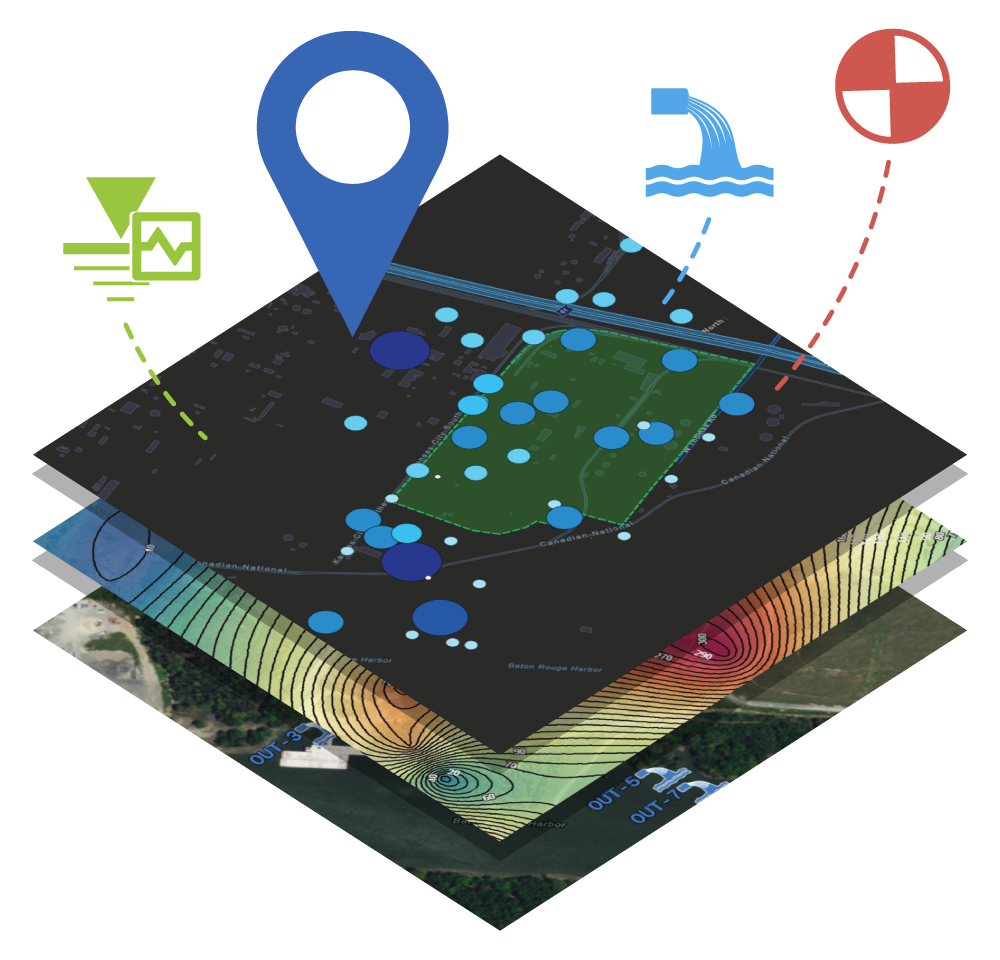
You can turbocharge your water data management by including a geographical information system (GIS) in your toolkit! Your data analysis efficiency also gets a huge boost if your data management system includes a GIS system “out of the box” because you won’t have to manually transfer data to your GIS. All your data is seamlessly available in both systems.
Ready to use GIS software? Jump to the Locus GIS product page>
Keep in mind that not all GIS packages are created equal. Here are some tips to consider when looking at mapping applications for your environmental data:
1) Confirm that integration is built-in and thorough
Mapping is easy when properly integrated with your environmental database. You should not need extra filters or add-on programs to visualize your data. Look for built-in availability of features, such as “click to map”, that take the guesswork and frustration out of mapping for meaningful results.
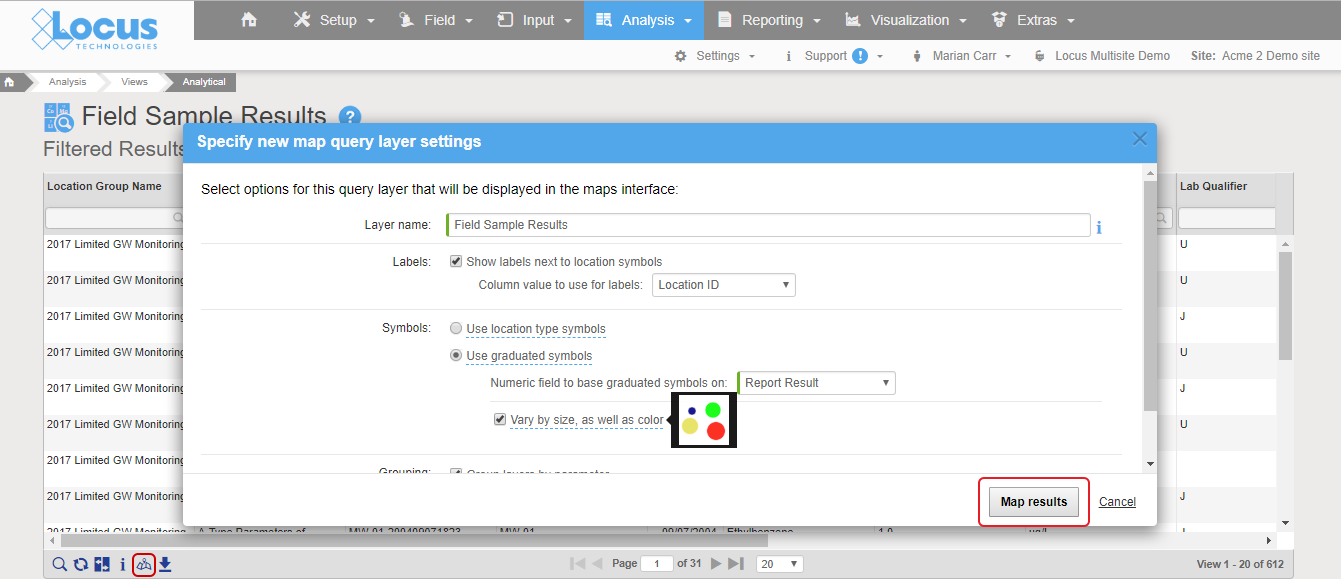
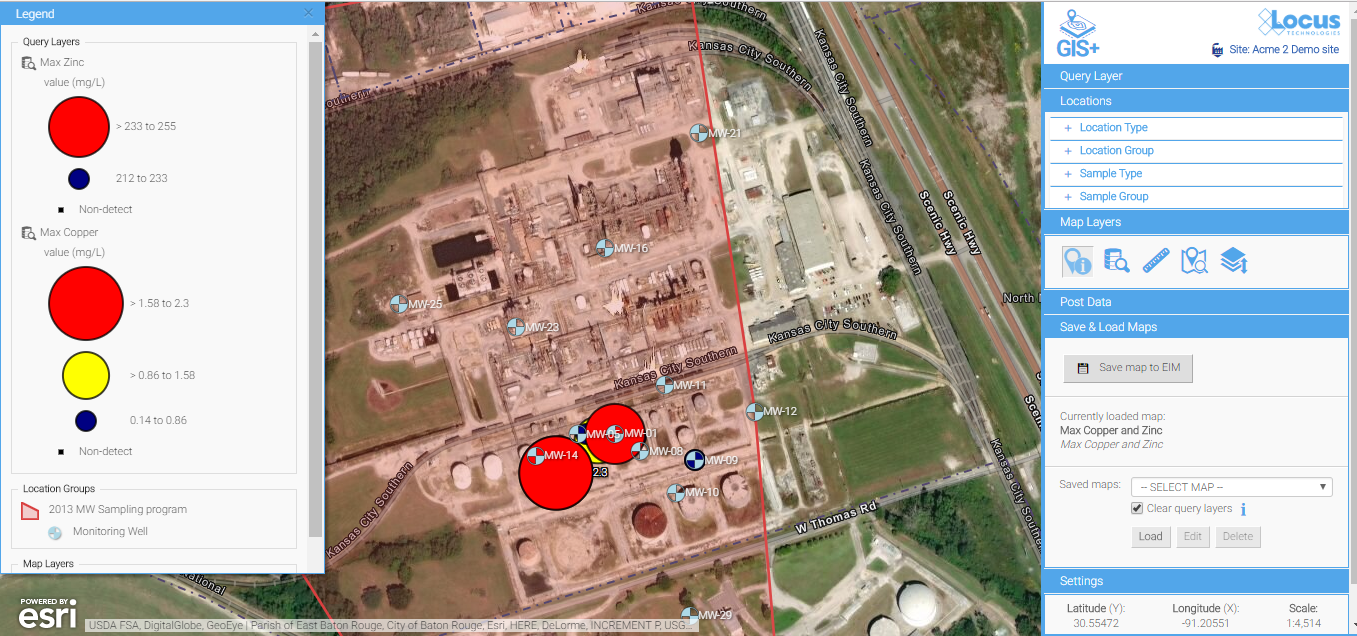
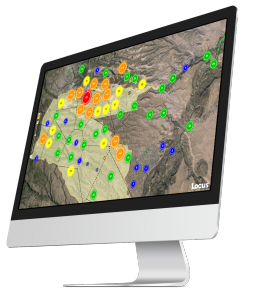
Good integration means mapping is as easy as clicking a “show on map” button. In Locus EIM, you can run a data query and click “Show results on map” icon, change the default settings if desired, and instantly launch a detailed map with a range of query layers to review all chemicals at the locations of interest.
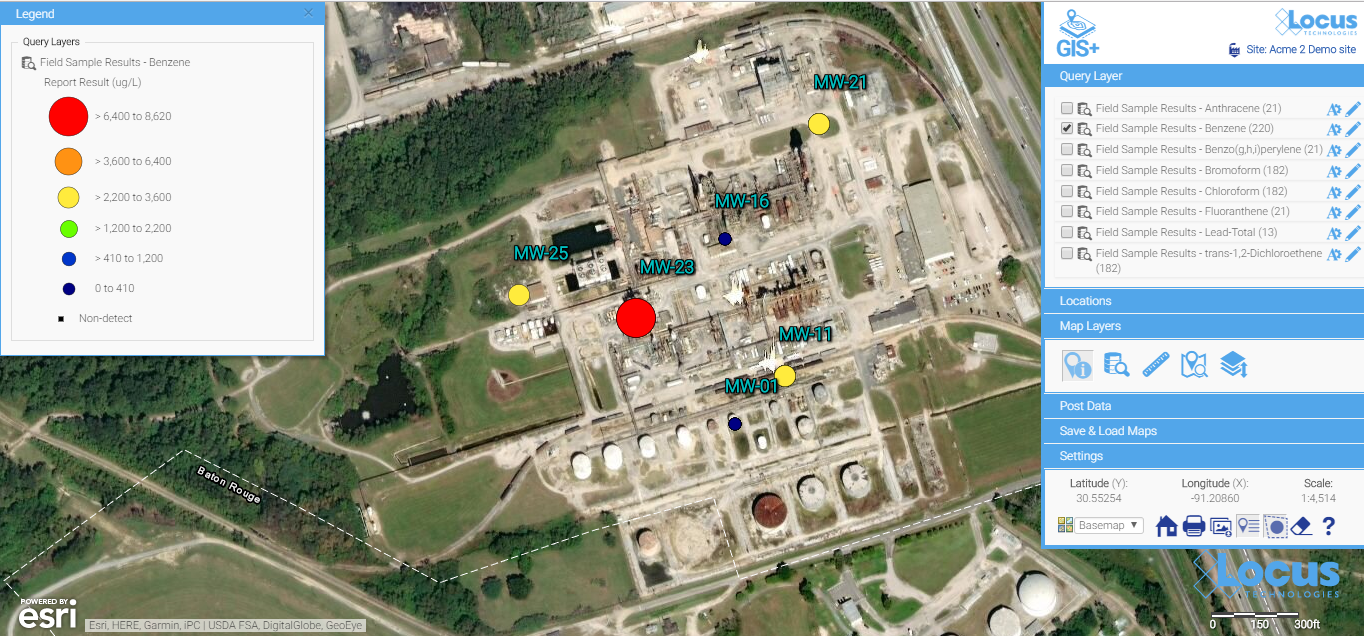
All the query results are presented as query layers, so you can review the results in detail. This map was created with the easy “show results on map” functionality, which anyone can use with no training.
2) Check for formatting customization options
Look for easy editing tools to change the label colors, sizes, fonts, positioning, and symbols. Some map backgrounds make the default label styles hard to read and diminish the utility of the map, or if you’re displaying a large quantity of data, you’ll almost certainly need to tweak some display options to make these labels more readable.
Default label styles are legible on this background, but they are a bit hard to read.
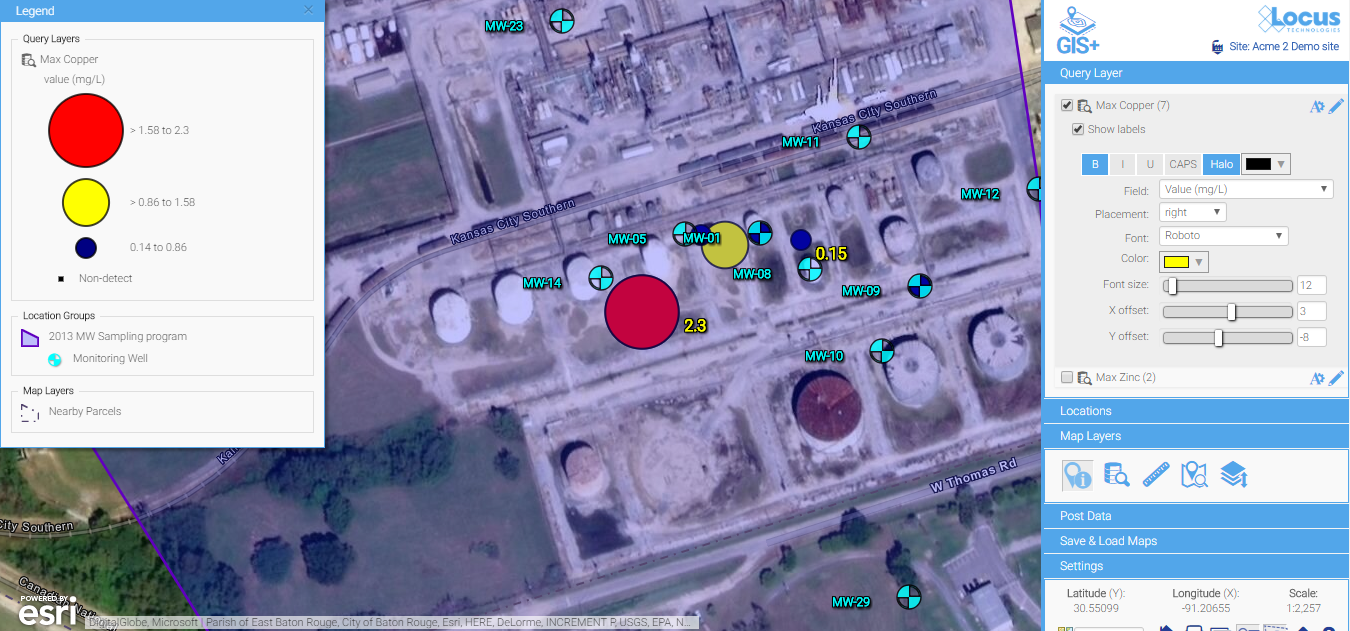
A few simple updates to the font color, font sizes, label offset, and background color make for much easier reading. Changes are made via easy-to-use menus and are instantly updated on the map, so you have total control to make a perfectly labeled map.
3) Look for built-in contouring for quick assessment of the extent of the spatial impact
Contours can be a great way to visually interpret the movement of contaminants in groundwater and is a powerful visualization tool. In the example below, you can clearly see the direction the plume is heading and the source of the problem. An integrated GIS with a contouring engine lets you go straight from a data query to a contour map—without export to external contouring or mapping packages. This is great for quick assessments for your project team.
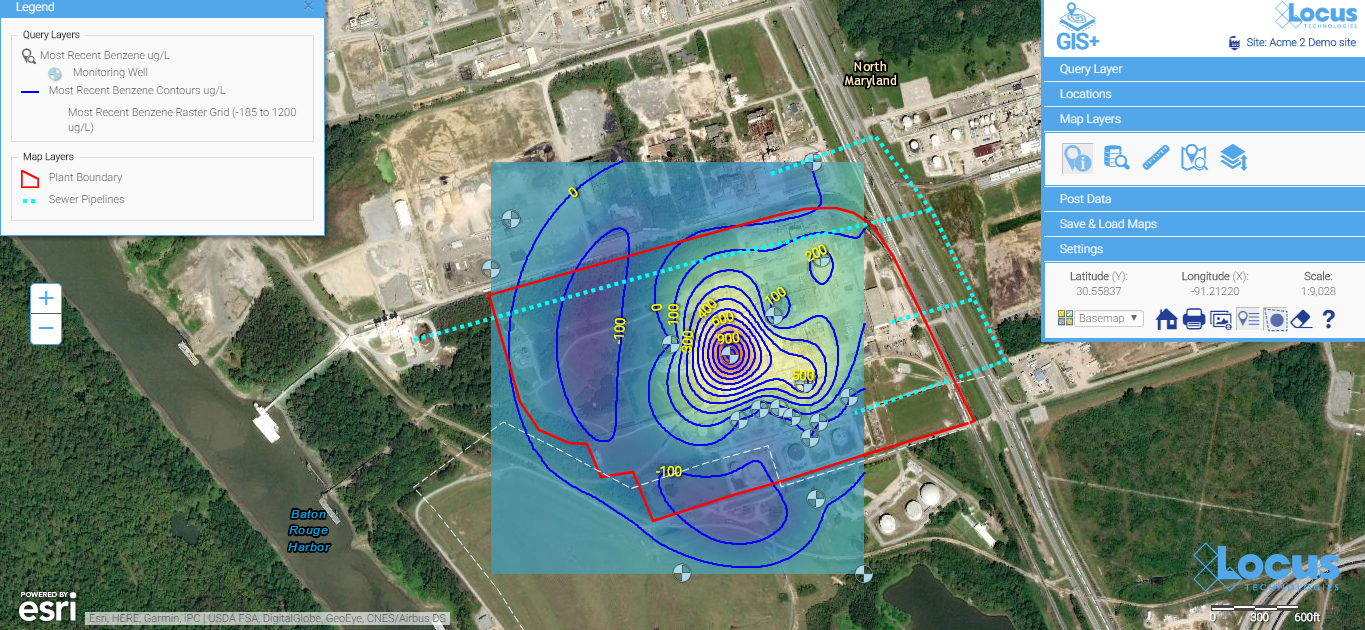
Contour maps make it easy to visualize the source and extent of the plumes. They can be easily created with environmental database management systems that include basic contouring functionality.
4) Look for something easy to use that doesn’t require staff with specialized mapping knowledge
Many companies use sophisticated and expensive mapping software for their needs. But the people running those systems are highly trained and often don’t have easy access to your environmental data. For routine data review and analysis, simple is better. Save the expensive, stand-alone GIS for wall-sized maps and complex regulatory reports.
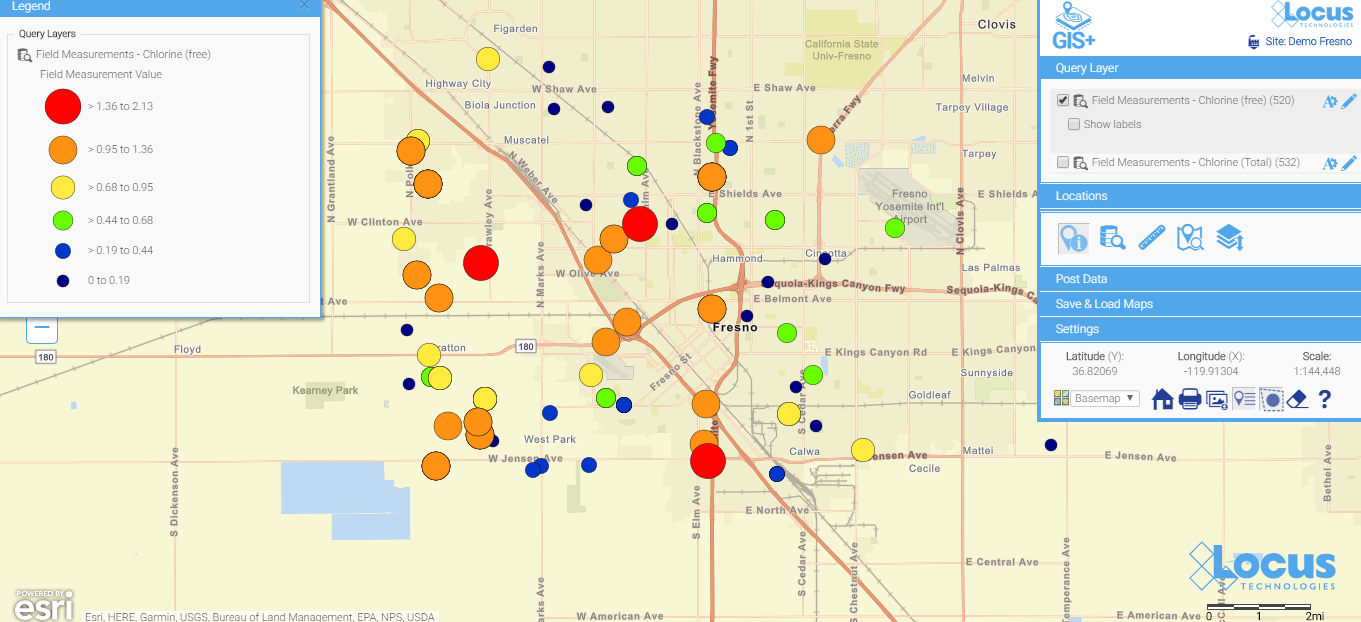
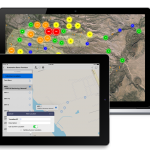
Here is a simple map (which is saved, so anyone can run it) showing today’s chlorine data in a water distribution system. You don’t have to wait for the GIS department to create a map when you use a GIS that’s integrated with your environmental database system. When data are updated daily from field readings, these maps can be incredibly helpful for operational personnel.
 See your data in new ways with Locus GIS for environmental management.
Locus offers integrated GIS/environmental data management solutions for organizations in many industries.
Find out more >
Taking the next steps
After viewing some of the many visualization possibilities in this blog, the next step is make some maps happen!
- Make sure your environmental data system has integrated mapping options.
- Make sure your sampling/evaluation/monitoring locations have a consistent set of coordinates. If you have a mixed bag of coordinate systems, you will need to standardize. Otherwise, your maps will not be meaningful. Here are some options to try, as well as some good resource sites:
- https://epsg.io/ (transformations)
- http://www.earthpoint.us/Convert.aspx (transformations)
- Start with a few easy maps—and build from there.
Happy mapping!