By Neno Duplan, Founder and CEO, Locus Technologies
Reading Time: 9 minutes
TL;DR: Environmental data volume keeps growing because monitoring obligations tend to accumulate. New contaminants, improved analytical methods, lower reporting thresholds, additional sampling locations, changing permits, and long-running remediation programs add data faster than older requirements disappear. In fact, within the Locus EIM customer base, electronic data deliverables have grown 4x in the last 15 years. Organizations should plan for continued growth by strengthening validation, integration, data governance, and analytical capacity. They should also retain the historical record. More complete data gives scientists, regulators, and AI tools the context needed to detect change and improve monitoring decisions.
Why is environmental monitoring data increasing even when regulatory priorities change?
Before founding Locus Technologies, we recognized that environmental data was about to grow at a rate that existing software architectures could not support. In the 1989 Civil Engineering magazine article, “Hazardous Data Explosion,” I predicted the environmental industry was entering an era where monitoring networks, laboratory analyses, regulatory reporting, GIS, and sensor data would increase exponentially. At the time, most organizations still relied on paper files, spreadsheets, and desktop databases, making this prediction seem ambitious. More than three decades later, that prediction has proven remarkably accurate. The explosion of environmental, EHS, ESG, and operational data has far exceeded even early expectations, validating Locus’s decision to build one of the industry’s first cloud-native, multi-tenant platforms specifically designed to manage massive, continuously growing environmental datasets while enabling AI-driven analytics and automation.
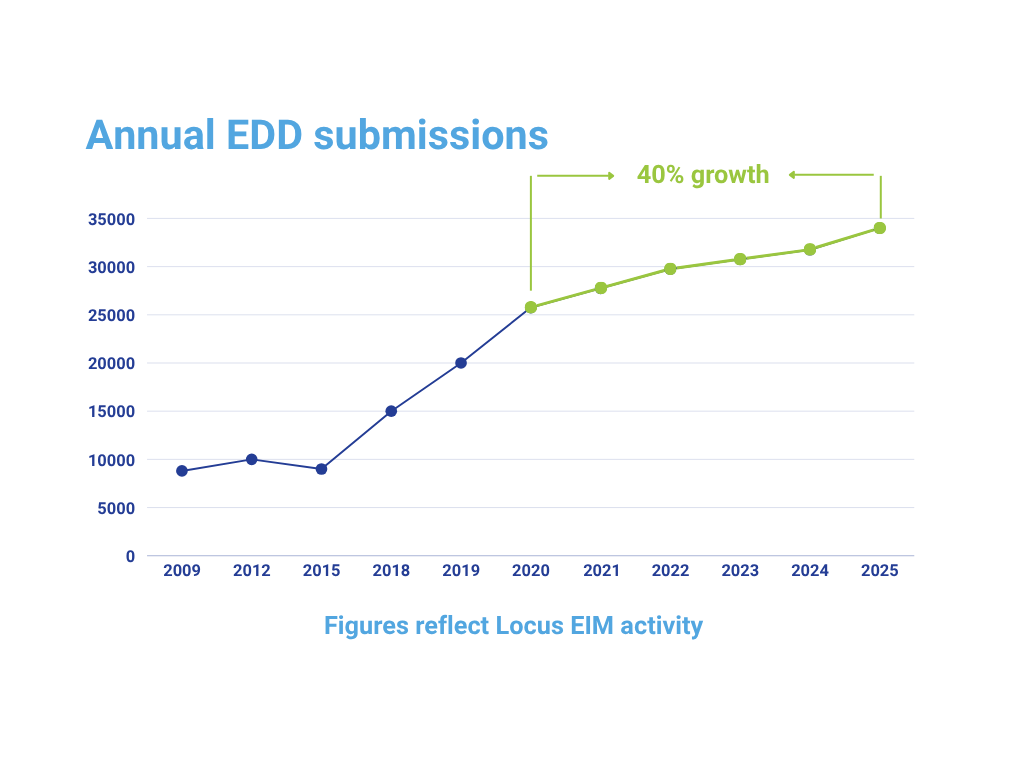
Environmental monitoring data keeps increasing because most obligations persist across political and budget cycles. Permits, consent decrees, state programs, cleanup agreements, laboratory methods, and site-specific monitoring plans continue producing data even as federal and state priorities shift. New requirements usually join an existing program instead of replacing it. Locus EIM usage reflects that accumulation: annual EDD submissions among customers increased four-fold in the past 15 years, with no sustained multiyear decline during the period analyzed.
Environmental programs have a ratchet effect
Environmental programs rarely begin at full complexity. They grow into it.
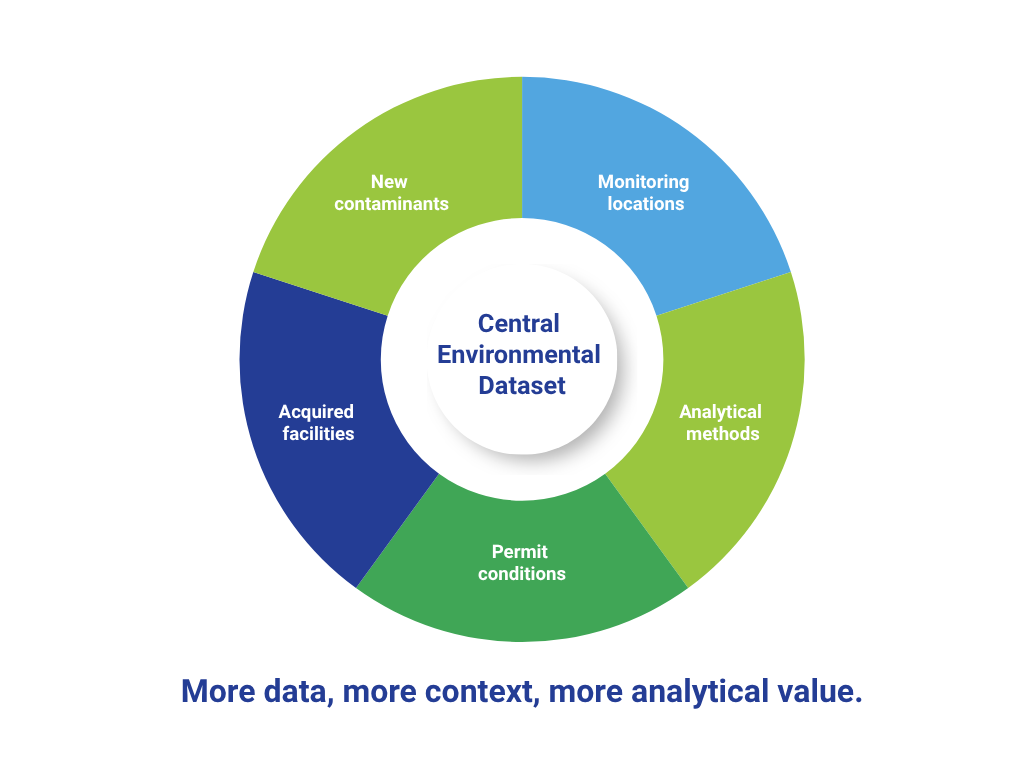
A facility may start with a defined set of sampling points, analytes, reporting frequencies, and permit conditions. Then an investigation finds an additional area of concern. A regulator requests another boring, well, and more analytes to be tested. A laboratory adopts a more sensitive method. A new contaminant enters the conversation. A permit renewal adds a reporting condition. A merger brings more facilities into the portfolio.
Each decision may be reasonable on its own. Together, they create a ratchet effect. The program gains locations, parameters, methods, files, workflows, and reporting logic. Very little disappears automatically.
Locus EIM activity provides a long view of that pattern:
- More than 446,000 EDDs were processed from 2007 through 2025.
- Annual EDD submissions increased 4x in the last 15 years.
- Annual additions did not decline in any year across the measured period.
- EDD volume increased approximately 40% from 2020 through 2025.
- Each successive 50,000-EDD milestone was reached more quickly.
These are product usage statistics, not a census of the environmental industry. Still, the direction is hard to miss. The environmental data workload handled in the platform became larger, more continuous, and faster moving.
What is driving growth in environmental data volume?
Prospective buyers often frame this as a storage question: “How many records can the platform handle?” That matters, but it comes late in the chain. The more useful research question is: “What will cause our environmental dataset to grow over the next five or ten years?”
Several forces commonly work together.
New contaminants expand established programs
PFAS is the obvious recent example. EPA’s PFAS Strategic Roadmap called for broader monitoring, improved analytical methods, additional reporting, and action across drinking water, wastewater, contaminated land, waste, and air. EPA has also continued to publish PFAS data resources and methods across environmental media.
That activity adds analytes, matrices, methods, qualifiers, detection limits, and reporting needs to programs that already manage metals, volatile organic compounds, radionuclides, nutrients, and other regulated constituents.
The 40% increase in Locus EDD volume from 2020 through 2025 is consistent with a period of increasing analytical and regulatory complexity. The Locus dataset cannot isolate PFAS as the cause, but it is one contributor to a much broader expansion.
Better instruments produce more detailed data
Analytical progress creates its own data demands. Lower detection limits can reveal concentrations that older methods could not measure reliably. New methods may cover more compounds or introduce different quality-control requirements. Results must remain connected to the method, laboratory, reporting limit, dilution, qualifier, sample, and location that give the number scientific meaning.
Ten thousand bare concentration values are not a defensible environmental record. Ten thousand results with intact context can support trend analysis, regulatory reporting, risk assessment, and future reanalysis.
Monitoring locations and frequencies accumulate
Sampling networks change as facilities expand, site conditions evolve, and investigations identify new areas of concern. New points are added quickly because uncertainty demands evidence. Old points may remain because removing them requires analysis, documentation, and regulatory agreement.
This is why growing data volume can reflect both necessary monitoring and unexamined inertia. A strong environmental information management system must support both realities. It needs to accept the growing flow while helping scientists determine whether the monitoring design still produces useful information.
State, local, and site-specific obligations continue
Federal policy receives the headlines. Environmental teams work inside a wider web of permits, state requirements, municipal obligations, consent decrees, corrective-action plans, and contractual commitments. Many of these instruments have their own schedules and legal durability.
The absence of a sustained multiyear decline in EDD submissions during the 2017 through 2020 shift in federal environmental priorities illustrates the resilience of operational monitoring. It does not prove which specific programs sustained the volume. It does show why companies should avoid capacity plans based on one election cycle.
Why does EDD growth matter to environmental teams?
Every incoming EDD creates work before it creates insight.
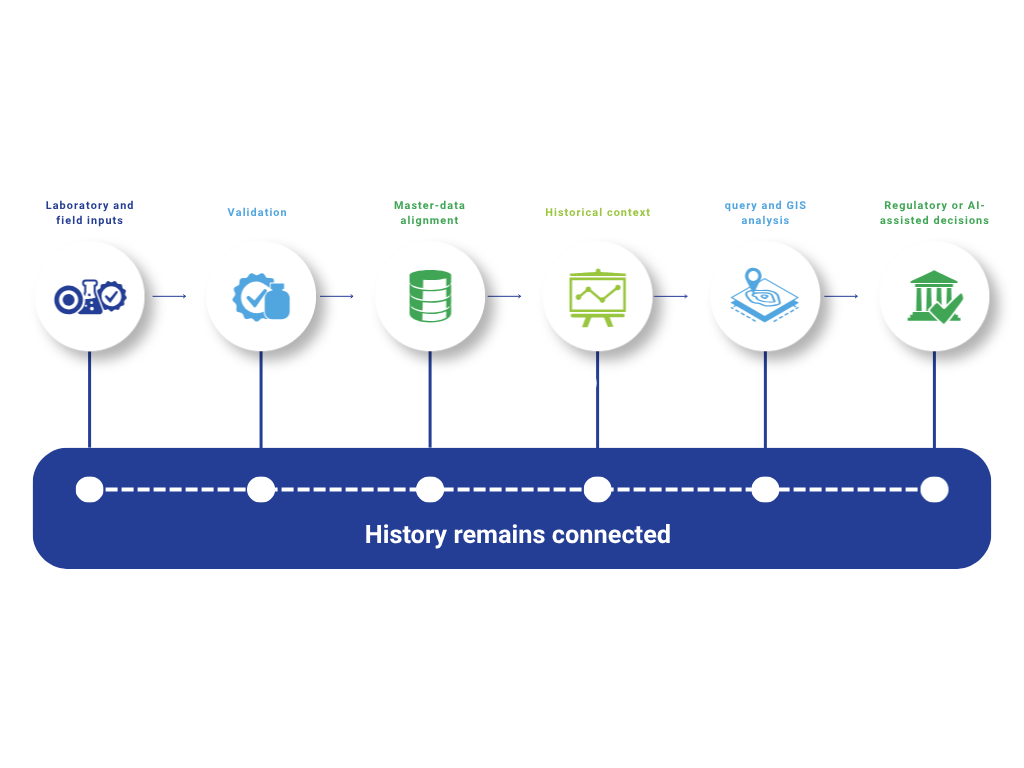
The file must be received, checked against the expected format, mapped to valid identifiers, reviewed for completeness, screened against data-quality rules, associated with the correct project and sampling event, and made available for reporting and analysis. Errors must be routed back to the laboratory or resolved through a controlled review.
As volume rises, manual processes fail in predictable ways:
- Validation queues lengthen.
- Inconsistent location and analyte names multiply.
- Staff spend more time reconciling files and less time interpreting results.
- Reports depend on uncontrolled spreadsheet transformations.
- Historical context becomes harder to retrieve at the moment it is needed.
- Data migrations grow more expensive because inconsistencies compound.
A platform that can store 100 million rows can still leave the organization underwater if it cannot validate, normalize, trace, query, and report those rows efficiently.
Should companies delete older environmental data to control volume?
In general, no. Capacity pressure is a reason to improve the architecture and governance, not to discard the scientific record.
Historical data provides the baseline against which new results become meaningful. It helps teams see whether a concentration is rising, falling, seasonal, anomalous, or unchanged. It supports long-term monitoring optimization, audit response, litigation readiness, remediation decisions, and institutional continuity when experienced employees leave.
AI makes that historical record more valuable, not less. A model asked to identify anomalous results, characterize plume behavior, or screen a portfolio for monitoring optimization needs sufficient time depth to distinguish meaningful trends from short-term variability and noise. A short, fragmented, or selectively archived dataset narrows—and can even distort—the model’s field of view. The longer and more complete the historical record, the more reliable the calibration of fate-and-transport models and the stronger the foundation for AI-driven forecasting, risk assessment, and monitoring decisions.
Organizations should retain as much high-quality environmental data as practical, for as long as practical, while preserving the metadata and lineage that make it usable. Records can be tiered for performance and cost, but older data should remain governed, searchable, and available to the analytical environment.
How should organizations prepare for another decade of growth?
- Forecast complexity as well as record count
Estimate growth in facilities, locations, analytes, methods, laboratories, EDD formats, users, regulatory calculations, and historical depth. These dimensions often affect performance and administration more than row count alone.
- Automate validation at the point of entry
The most efficient error is the one rejected before it enters the system of record. EDD checking should cover required fields, valid values, units, identifiers, holding times, qualifiers, method relationships, and project-specific business rules.
- Preserve stable master data
Locations, analytes, methods, units, facilities, and regulatory limits need controlled identifiers. Stable master data allows results collected years apart to participate in the same analysis.
- Keep the complete record analytically available
Storage tiers and cloud architectures can manage cost without breaking continuity. Buyers should ask whether older records remain query-able by the same reporting, GIS, statistical, and AI tools used for current data.
- Review whether growth is producing knowledge
More data is valuable when it increases understanding. Use the history to identify redundant sampling, emerging risk, data gaps, and locations where conditions justify a different monitoring strategy. Keep the data. Improve what you collect next.
The larger lesson from 446,000 EDDs
Environmental data growth is not a temporary surge waiting to settle down. The drivers are structural: more scientific capability, more contaminants, long-lived obligations, broader portfolios, and greater expectations for transparency and proof.
The right response is not to ration history. It is to build an environmental data foundation that can absorb increasing volume and convert a longer record into better decisions. Organizations that do this well gain something more useful than a large database. They gain a compounding body of evidence.
As environmental data volumes grow, the question becomes how professionals turn that expanding record into insight—see what environmental professionals are actually doing with their data.
Frequently Asked Questions
What is an electronic data deliverable in environmental monitoring?
An electronic data deliverable, or EDD, is a structured file used to transfer sampling and analytical results, often from a laboratory into an environmental data system. A well-designed EDD includes results plus the identifiers, units, methods, qualifiers, detection limits, dates, and quality-control information needed to validate and interpret them.
Why are environmental EDD volumes growing?
Common drivers include new contaminants, additional monitoring locations, improved analytical methods, lower detection limits, changing permits, expanded portfolios, and long-running remediation or compliance programs. New requirements often add to the existing workload.
Did PFAS regulation cause the 40% increase in Locus EDD volume from 2020 to 2025?
The timing is consistent with expanding PFAS monitoring and analytical activity, but the product usage data cannot isolate PFAS as the cause. The increase likely reflects several concurrent changes in monitoring, regulation, customer activity, and analytical complexity.
How much historical environmental data should a company retain?
Retention requirements vary by program, jurisdiction, permit, contract, and legal context. From an analytical standpoint, organizations benefit from keeping as much validated data as practical for as long as practical. The record should remain accessible with its metadata, quality indicators, and lineage intact.
What should buyers ask about environmental software scalability?
Ask for evidence involving real data volumes, EDD throughput, validation performance, query response, historical depth, laboratory formats, security, customer tenure, and operation across both lower-volume and highly complex programs. A theoretical row limit is only one part of scalability.
Locus is the only self-funded water, air, soil, biological, energy, and waste EHS software company that is still owned and managed by its founder. The brightest minds in environmental science, embodied carbon, CO2 emissions, refrigerants, and PFAS hang their hats at Locus, and they’ve helped us to become a market leader in EHS software. Every client-facing employee at Locus has an advanced degree in science or professional EHS experience, and they incubate new ideas every day – such as how machine learning, AI, blockchain, and the Internet of Things will up the ante for EHS software, ESG, and sustainability.