PFAS Regulations: Delay of Effective Date of adding certain PFAS to the TRI
Delay of Effective Date of adding certain PFAS to the TRI.
Delay of Effective Date of adding certain PFAS to the TRI.
Locus Technologies continues to explore new frontiers such as a “natural language” AI chatbot for data stored in Locus software.
At Locus, we are constantly exploring innovative ways to visualize and analyze large datasets, empowering users to derive insights with ease.
The GIS visualization shows how the chlorine levels near our product manager’s home have normalized over the past 6 weeks.
Todd Pierce documents his parallel insights as an Asheville resident directly impacted and as an environmental information management expert.
Explore how innovative technologies like Locus Water software-as-a-service (SaaS) can play a pivotal role in addressing the water crisis and promoting water sustainability.
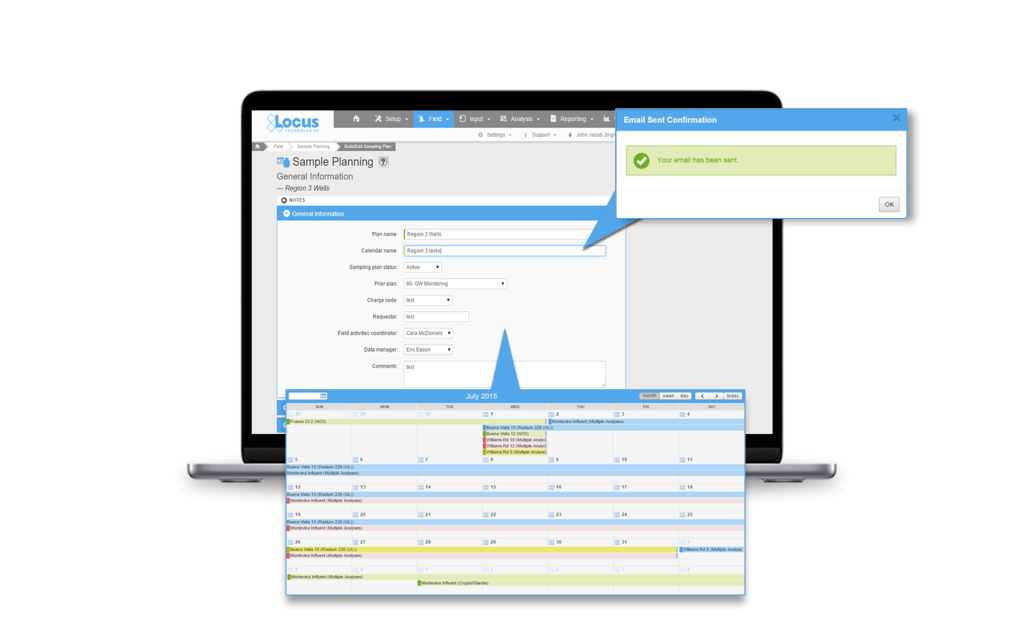
There is a need for most water entities to centralize data, and more easily load, share, analyze, and report data. Locus Technologies’ customizable software makes scheduling and collecting routine water samples is made easy by using Locus Mobile and EIM. Below is a list of frequent challenges that customers have encountered during their water sampling process and how they can be solved using the right tools from Locus. or better communications.
Planning tools need to allow flexibility in terms of different sampling intervals and date ranges, different field and analytical parameters, and account for location grouping. Using a well-designed application can pull together all of this detailed information and can provide a summary view of the individual samples. A manager can easily view sample status, and whether the sample is complete, in process, or planned. A well-designed application can also generate the chain of custody (COC), and lab and sample shipping date information and labels per sample, which is a huge time saver. This type of sample tracking detail seemed to be very useful to many conference attendees to help ensure they are in regulatory compliance with required sampling frequencies. A key feature to look for is an application that is flexible enough that it can allow one-time, unplanned sample events such as water main breaks, customer complaints and schedule changes, and can handle complex multi-year routine sampling with ease. As a plus, it’s easy for you or your manager to know where you stand at any time.
Data entry errors and fixing bad data when it was transcribed from field notes to Excel or other programs is a persistent problem with the old way of doing things. Your company needs a better way to streamline the error prone data collection process. Many clients are interested in an alternative to the pencil/paper/clipboard method and had goals to move to tablet or smartphone for data collection. The universal wish list for mobile field applications included:
Everyone is aware that software updates all the time. Sometimes its security enhancements and sometime feature enhancements or bug fixes. A source of frustration is getting a software update and not knowing what was updated or how best to incorporate a new feature/enhancement into their established process. There was also concern for impact to an established routine with field crews that were used to the existing way of doing things. Even if a functionality improved the workflow, enhancements are only valuable to a user if they understand how to use them and how to incorporate them into their existing process.
Mobile applications, which appear very simple to the users, are in reality complex software and require careful integration with the receiving database for a range of complex use cases. This makes rolling out new mobile features challenging for both the developers and the users. Enhanced customer/developer communication along with a sandbox environment can go a long way towards solving some of the inherent issues with rapid innovations and updates associated with cloud and mobile software.
Software tools are available and can solve a lot of the common data management challenges, but know what you want, know the problem you are trying to solve and know it will take some time and effort, but the end result will significantly improve your business processes. Though these challenges are present when choosing a software, Locus Technologies has the experts to help you hurdle the challenges to find the solution that is best for your business.
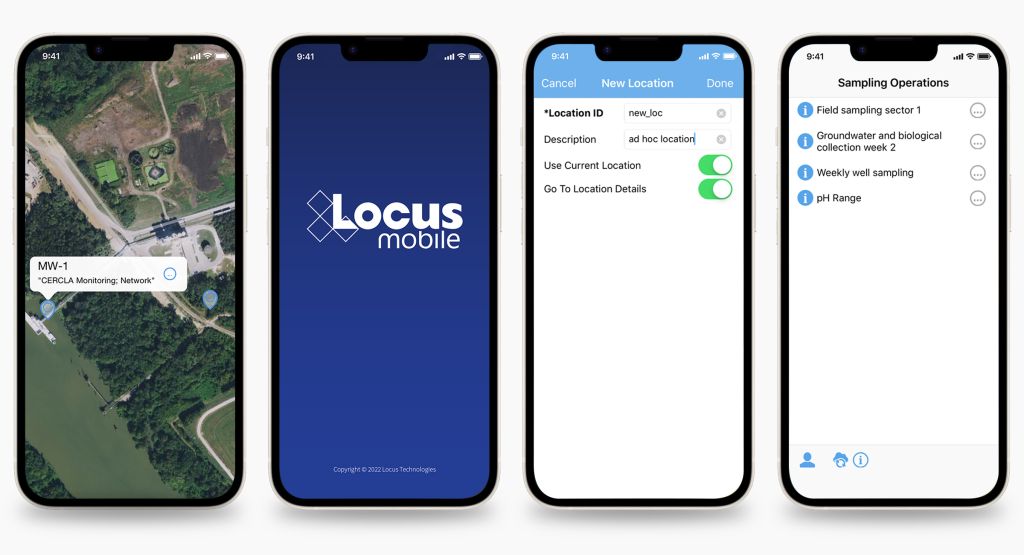
Tracking your data is made easy within our software as a service (SaaS), Locus Platform (LP). Your company can take advantage of LP’s mobile-aware browser functions, giving you the capability to do all your fieldwork with your existing phones or tablets. When cellular connections are unavailable or unreliable, Locus also has a Mobile app which supports the offline capabilities you need to keep your workflow going.
Regardless of your mobile approach, each mobile form can be easily configured to capture the data you require in the field such as photos and the sampling results.
Whether in the office, or out in the field, Locus Technologies is with you every step of the way during the tracking process. Contact us to find your solution.
![]()
SAN FRANCISCO, Calif., 23 July 2019 — Locus Technologies (Locus), the market leader in multi-tenant SaaS water quality, environmental compliance, and sustainability management, today announced that it is going all-in on Amazon Web Services, Inc. (AWS), moving its entire infrastructure to the world’s leading cloud. By moving its flagship product EIM (Environmental Information Management) to AWS this month, Locus will complete its transition to AWS. Locus previously moved its Locus Platform (LP) to AWS in 2018.
EIM is the world’s leading water quality management software used by many Fortune 500 companies, water utilities, and the US Government since 1999. Among its many features, EIM delivers real-time tools to ensure that water utilities deliver clean water to consumers’ taps and don’t discharge contaminated wastewater above allowable limits to groundwater or surface water bodies like streams, lakes, or oceans.
EIM generates big data, and with over 500 million analytical records at over 1.3 million locations worldwide, it is one of the largest centralized, multi-tenant water quality management SaaS systems in the world. With anticipated growth in double digits stemming from the addition of streaming data from sensors and many IoT monitoring devices, Locus needed to have a highly scalable architecture for its software hosting. The unmatched performance and scalability of AWS’s offerings are just the right match for powering Locus’ SaaS.
Because of the scope of its applications, Locus is expecting to leverage the breadth and depth of AWS’s services (including its database systems, serverless architecture, IoT streaming, blockchain, machine learning, and analytics) to automate and enhance the on-demand EHS compliance, sustainability, facility, water, energy, and GHG management tools that Locus’ software provides to its customers.
Running on AWS’s fault-tolerant and highly performant infrastructure will help support Locus’s everyday business, and will scale easily for peak periods, where reporting demand such as GHG calculation engine or significant emissions incidents like spills can skyrocket scalability demand.
By leveraging Amazon CloudFront, Amazon Virtual Private Cloud (Amazon VPC), Amazon Elastic Kubernetes Service (Amazon EKS) and AWS Lambda, Locus is migrating to a microservices architecture to create more than 150 microservices that independently scale workloads while reducing complexity in the cloud, thereby enhancing every element of the customer cloud experience. Locus built a data lake on Amazon Simple Storage Service (Amazon S3) and will leverage Amazon Redshift to analyze the vast amount of data it is storing in the cloud, delivering insights and predictive analytics that uncover chemicals trending patterns and predict future emissions releases at various locations.
Locus intends to leverage AWS IoT services and Amazon Managed Blockchain by building a new native integration to help businesses generate value from the millions of events generated by connected devices such as real-time environmental monitoring sensors and environmental treatment systems controls. AWS IoT is a set of cloud services that let connected devices easily and securely interact with cloud applications like EIM and Locus Platform and other devices. Locus IoT Cloud on AWS allows customers to experience real-time emissions monitoring and management across all their connected sensors and devices. And for customers who want to allow multiple parties to transact (e.g. GHG trading) without a trusted central authority, AWS provides a fully managed, scalable blockchain service. Amazon Managed Blockchain is a fully managed service makes it easy to setup, deploy, and manage scalable blockchain networks that Locus intends to use for emissions management and trading.
For example, a water utility company that maintains thousands of IoT-enabled sensors for water flow, pressure, pH, or other water quality measuring devices across their dispersed facilities and pipeline networks will be able to use Locus IoT on AWS to ingest and manage the data generated by those sensors and devices, and interpret it in real time. By combining water sensor data with regulatory databases, water utility companies will be able to automatically create an emergency shutdown if chemical or other exceedances or device faults are detected and as such, will be better prepared to serve their customers and environment.
By combining the powerful, actionable intelligence in EIM and rapid responsiveness through Locus Platform with the scalability and fast-query performance of AWS, customers will be able to analyze large datasets seamlessly on arrival in real time. This will allow Locus’ customers to explore information quickly, find insights, and take actions from a greater variety and volume of data—all without investing the significant time and resources required to administer a self-managed on-premises data warehouse.
“After 22 years in business, and after evaluating AWS for a year with our Locus Platform, we decided to switch and continue all our business on AWS. We are taking advantage of their extensive computing power, depth and breadth of services and expertise to develop an effective cloud infrastructure to support our growing business and goal of saving the planet Earth by providing and managing factual information on emissions management, all the while reducing operational costs of Locus’ customers,” said Neno Duplan CEO of Locus. “By operating on AWS, we can scale and innovate quickly to provide new features and improvements to our services – such as blockchain-based emissions management – and deliver exceptional scalability for our enterprise customers. With AWS, we don’t have to focus on the undifferentiated heavy lifting of managing our infrastructure, and can concentrate instead on developing and improving apps and services.”
“By organizing and analyzing environmental, sustainability, and water quality information in the cloud, Locus is helping organizations to understand the impact of climate change on drinking water,” said Mike Clayville, Vice President, Worldwide Commercial Sales at AWS. “AWS’s unmatched portfolio of cloud services, proven operational expertise, and unmatched reliability will help Locus to further automate environmental compliance for companies ranging from local water utilities to multinational manufacturing corporations, to federal government research agencies. ”By choosing to go all-in on AWS, Locus is able to innovate and expand globally, developing new solutions that will leverage comprehensive analytics and machine learning services to gain deeper insights and forecast sustainability metrics that will help deliver clean drinking water to consumers around the world.”
MOUNTAIN VIEW, Calif., 9 July 2019 — Locus Technologies, (Locus), the industry leader in water quality, EHS, sustainability, and compliance management software, is pleased to announce that the City of San Marcos, Texas Water/Wastewater Utility selected Locus Environmental Information Management (EIM) software to streamline water quality and wastewater management and compliance.
“With Locus’ water quality software we can streamline and modernize how we manage and report our critical water quality and wastewater data,” said Ron Riggins, San Marcos Water Quality Manager. “With an integrated mobile application, we will be able to access and react to field information faster than ever before.”
“By selecting Locus EIM water quality software, the City of San Marcos, Texas can simplify managing water and wastewater data and integrate with their existing GIS system. This will provide them a modern cloud solution with fully integrated mobile capabilities,” said Wes Hawthorne, President of Locus.