Top 10 Enhancements to Locus Environmental Software in 2020
Let’s look back on the most exciting new features and changes made in EIM, Locus’ environmental data management software, during 2020!
Let’s look back on the most exciting new features and changes made in EIM, Locus’ environmental data management software, during 2020!
MOUNTAIN VIEW, Calif., 1 September 2020 — Locus Technologies (Locus), industry leader in water data management software, today announced that Valley Water (formerly Santa Clara Valley Water District) has chosen Locus environmental software for their data collection and management.
Valley Water has selected Locus’ environmental software, EIM, following consultant work Locus provided for the utility going back 14 years. They will seek to utilize Locus EIM as a laboratory database management system, and for data analytics. Locus EIM will be used to manage sample data for over 200 million gallons of drinking water consumed daily by over 2 million people in the district.
“Valley Water has an award-winning track record of bringing the highest-quality water to the Bay Area. Being local, we see the hard work that Valley Water puts into providing some of the best drinking water available anywhere. We are proud to be a part of that process,” said Wes Hawthorne, President of Locus.
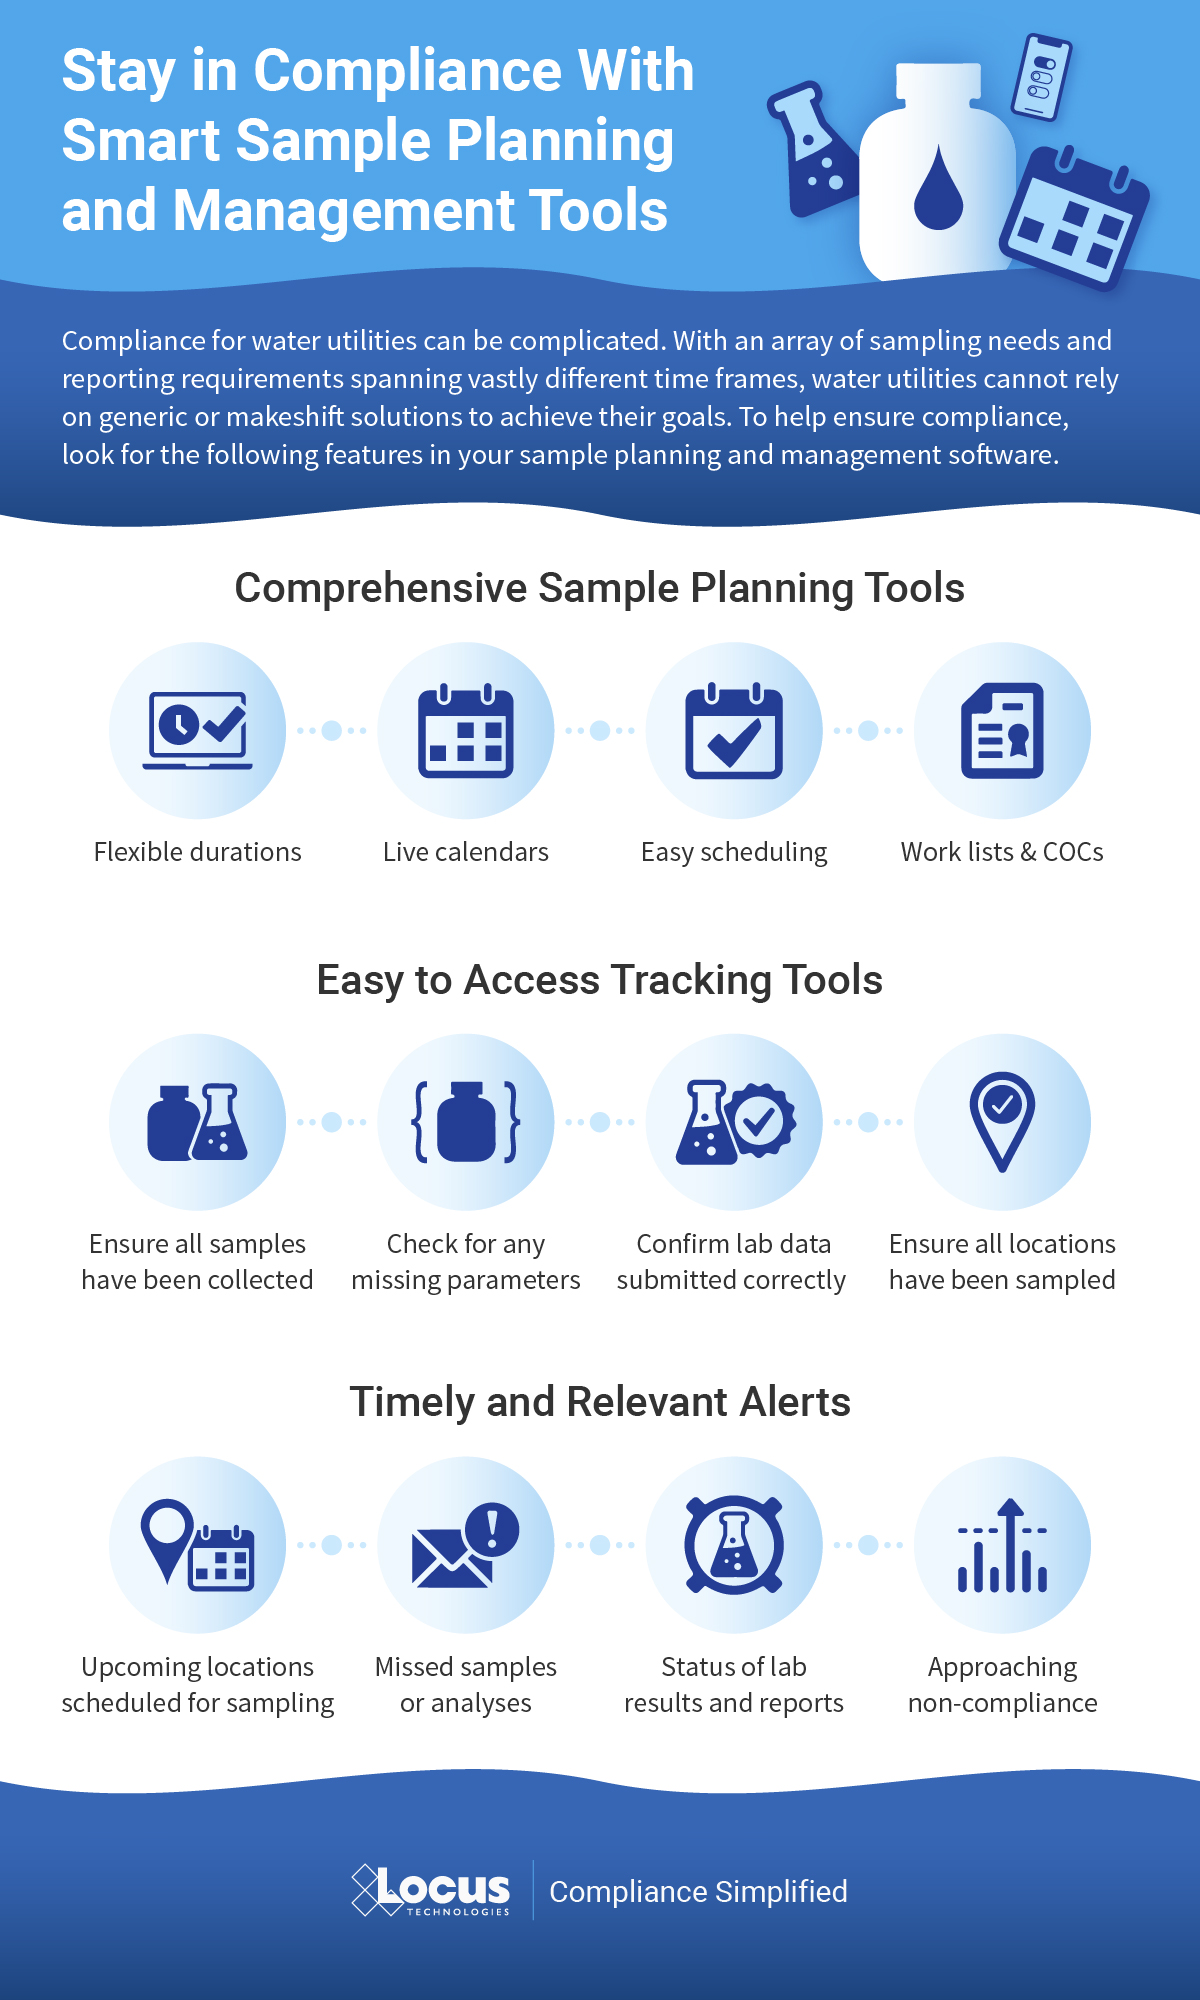
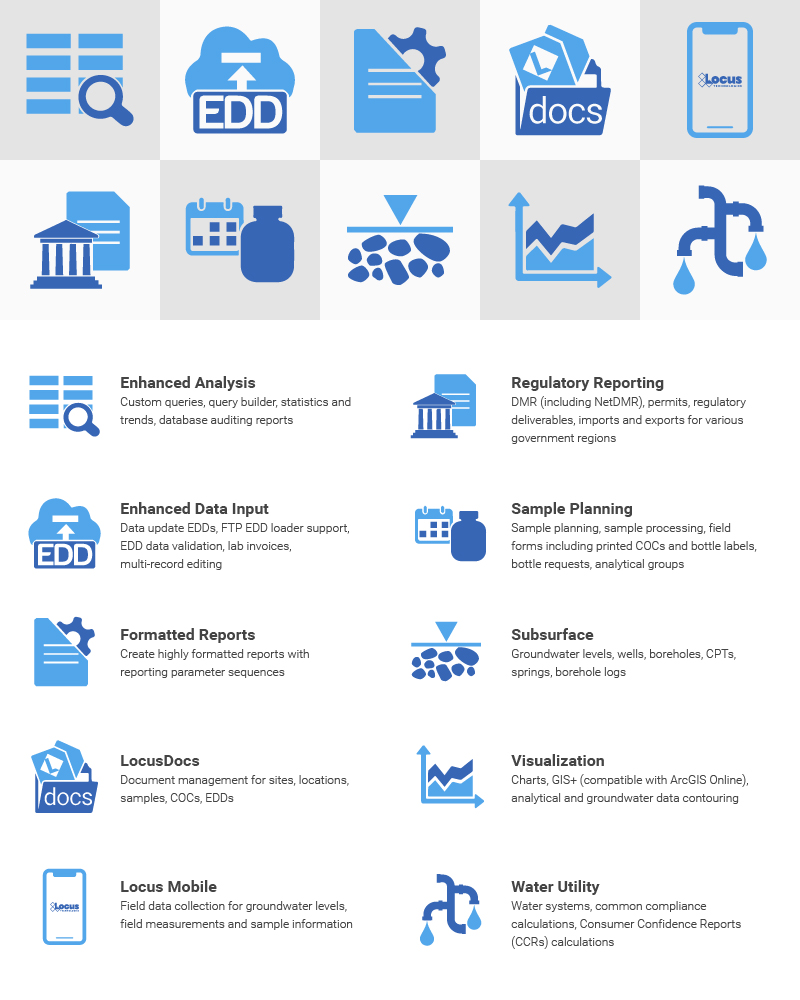
Imagine the time savings and the simplicity of having your regulatory requirements all lined out for the year without having to worry about missing required samples. For water utilities, this is especially valuable given the strict schedules and public health implications of missing sampling events. Locus sample planning streamlines repetitive sampling, such as required samples for drinking water or monitoring wells. Any sampling events can be planned and reused repeatedly, even with tweaks to the schedule for the samples to be collected. We’ve outlined some key features of Locus sample planning in this infographic.
MOUNTAIN VIEW, Calif., 17 March 2020 — Locus Technologies, industry leader in environmental software, today announced that Evergreen Natural Resources, a privately-held energy company based in Denver, Colorado, has chosen Locus environmental software for their data collection and management.
Evergreen Natural Resources has selected Locus’ environmental software, EIM, after proof of concept and usability testing. They will seek to utilize Locus EIM as a laboratory database management system, and for regulatory report generation, while also taking advantage of Locus’ premium GIS tool, GIS+, as well as Locus Mobile.
“With over 2,600 unique locations that require routine sampling, Locus’ environmental and GIS software allows us to collect, manage, visualize, and analyze data. Locus EIM aligns with our strategy to increase availability and reduce our internal application infrastructure footprint,” said Cesar Zayas, IT Director of Evergreen.
“Evergreen Natural Resources is a rapidly emerging company in the energy sector, and their decision to utilize Locus’ powerful environmental software shows their objective to manage their data quality at the highest level. Our scalable software will match their continued growth,” said Wes Hawthorne, President of Locus.
Integration with other systems, whether on-premises or in the cloud, has become a key wishlist item for many EHS software buyers. It allows you to take advantage of other tools used by your organization (or available from third parties) to simplify processes, access information, and enhance communication, both internally and externally.
MOUNTAIN VIEW, Calif., 27 January 2020
Locus Technologies, (Locus), industry leader in water quality, EHS, sustainability, and compliance management software, is pleased to announce they are among the first accredited verification bodies for the Low Carbon Fuel Standard (LCFS) program administered by the California Air Resources Board (CARB). Locus verifiers were accredited for fuel pathway applications, alternative fuel transactions, and petroleum-based fuel reports.
Originally adopted in 2009, the goal of the LCFS program is to reduce the carbon intensity (CI) of the transportation fuel pool. The LCFS is one of the key AB 32 measures to reduce greenhouse gas emissions in California, while reducing petroleum dependency and achieving improved air quality. The program has grown in scope, and certified third-party verifiers can now review both applications and routine reporting.
Locus Technologies has been a certified third-party reviewer of GHG verifications for CARB since 2010 under the Mandatory Reporting Rule and maintains an unmatched track record. Not one of over 500 GHG verifications by Locus has been overturned, a standard the company intends to match with LCFS reporting.
Locus has staff and expertise to review Tier 1 fuel pathway applications and annual reports under LCFS as well as other LCFS projects, with verifiers located in San Francisco, San Jose, Sacramento, Los Angeles, and in the Midwest. Locus also offers software products designed to assist reporters in complying with the LCFS program.
Let’s look back on the most exciting new features and changes made in EIM, Locus’ environmental data management software, during 2019!
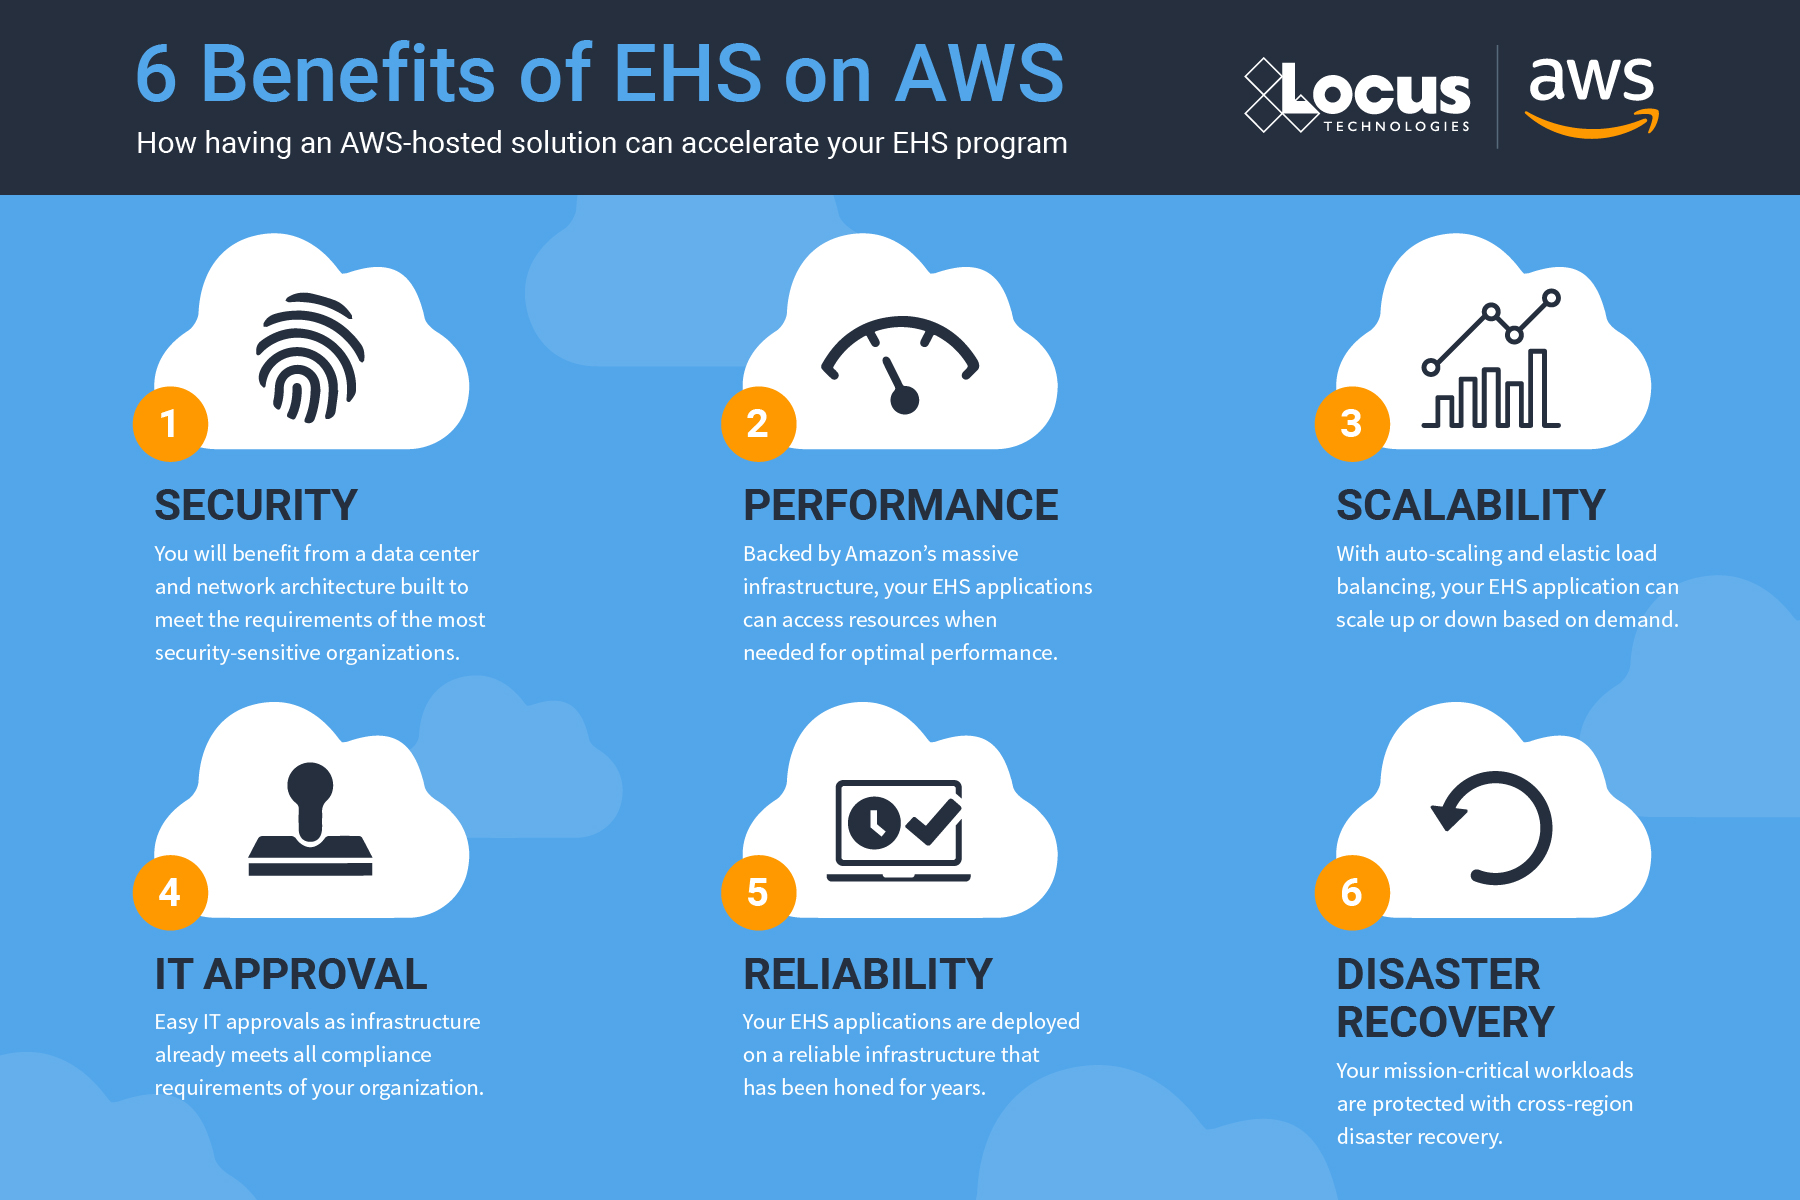
In August, Locus migrated EIM into the Amazon Web Services (AWS) cloud. EIM already had superior security, reliability, and performance in the Locus Cloud. The move to AWS improves on those metrics and allows Locus to leverage AWS specific tools that handle big data, blockchain, machine learning, and data analytics. Furthermore, AWS is scalable, which means EIM can better handle demand during peak usage periods. The move to AWS helps ensure that EIM remains the world’s leading water quality management software.
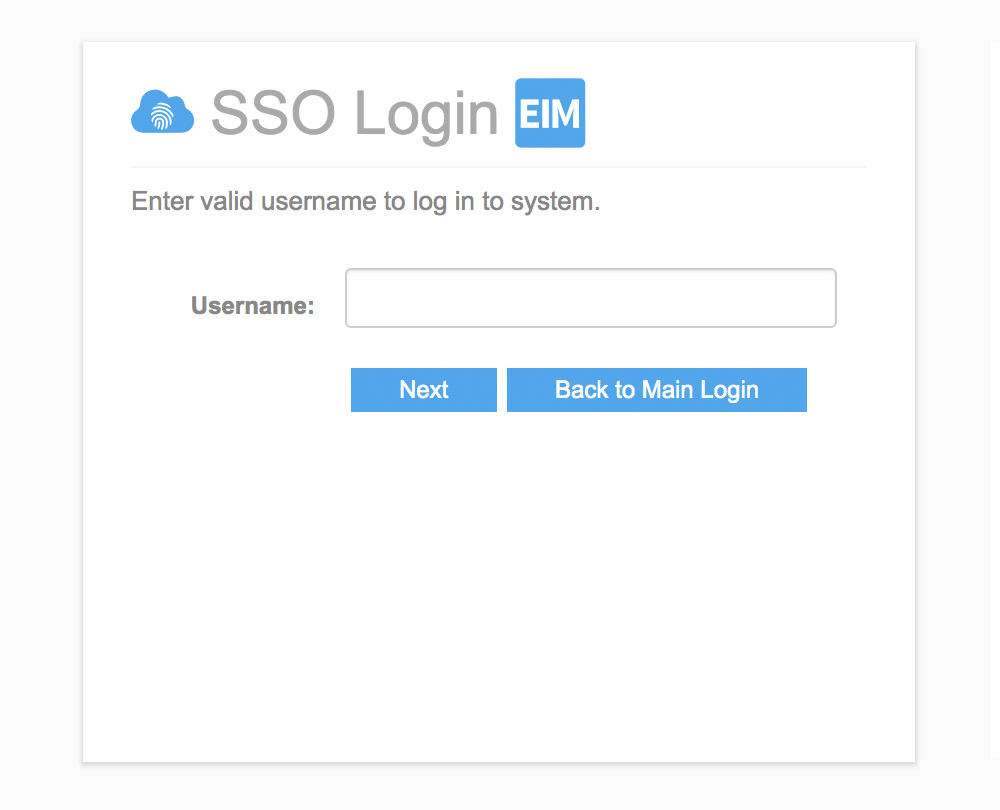
EIM now supports Single Sign-On (SSO), allowing users to access EIM using their corporate authentication provider. SSO is a popular security mechanism for many corporations. With SSO, one single login allows access to multiple applications, which simplifies username and password management and reduces the number of potential targets for malicious hacking of user credentials. Using SSO with EIM requires a one-time configuration to allow EIM to communicate with a customer’s SSO provider.
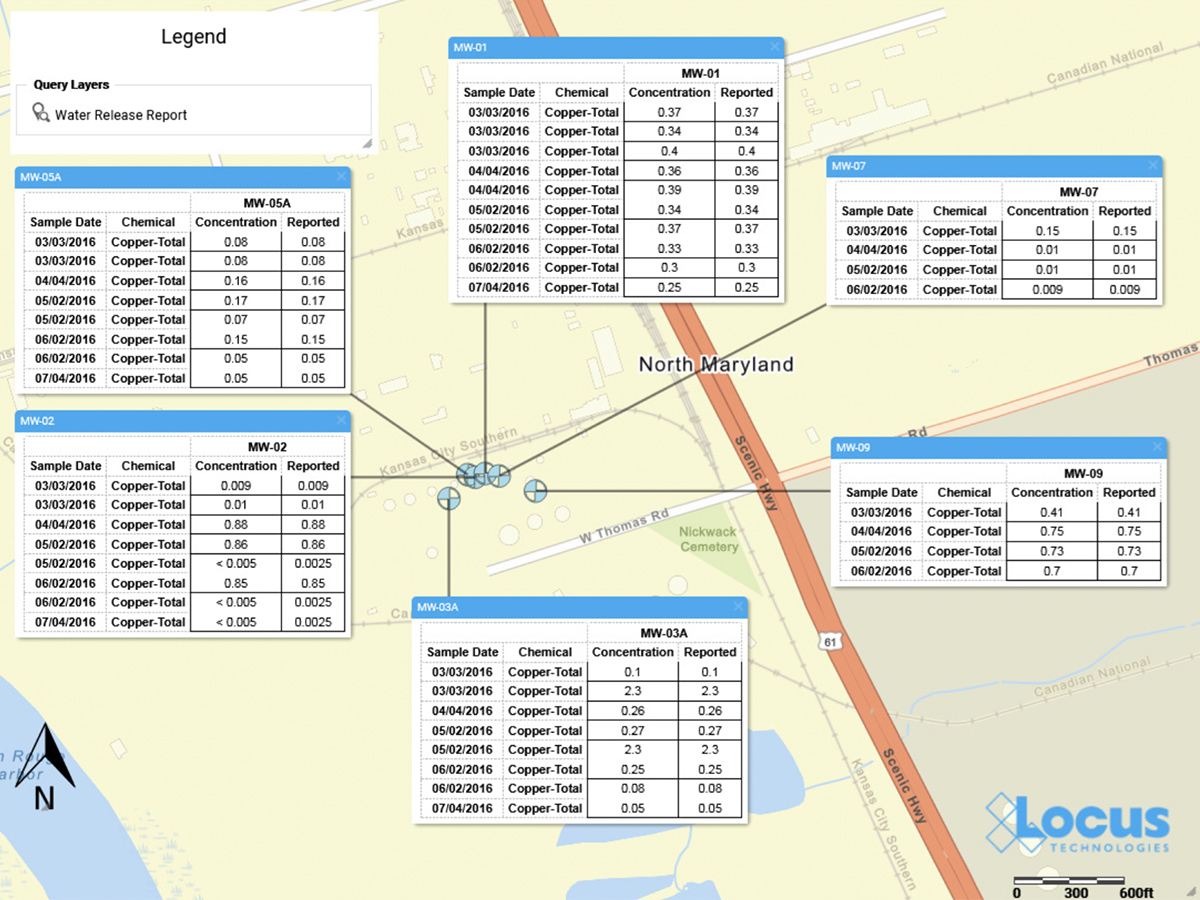
The Locus GIS+ solution now supports creating data callouts, which are location-specific crosstab reports listing analytical, groundwater, or field readings. A user first creates a data callout template using a drag-and-drop interface in the EIM enhanced formatted reports module. The template can include rules to control data formatting (for example, action limit exceedances can be shown in red text). When the user runs the template for a specific set of locations, EIM displays the callouts in the GIS+ as a set of draggable boxes. The user can finalize the callouts in the GIS+ print view and then send the resulting map to a printer or export the map to a PDF file.
For customers who don’t require the full EIM package, Locus now offers EIM One, which gives the ability to customize EIM functionality. Every EIM One purchase comes with EIM core features: locations and samples; analytical and field results; EDD loading; basic data views; and action limit exceedance reports. The customer can then purchase add-on packages to get just the functionality desired–for example a customer with DMR requirements may purchase the Subsurface and Regulatory Reporting packages. EIM One provides customers with a range of pricing options to get the perfect fit for their data management needs.
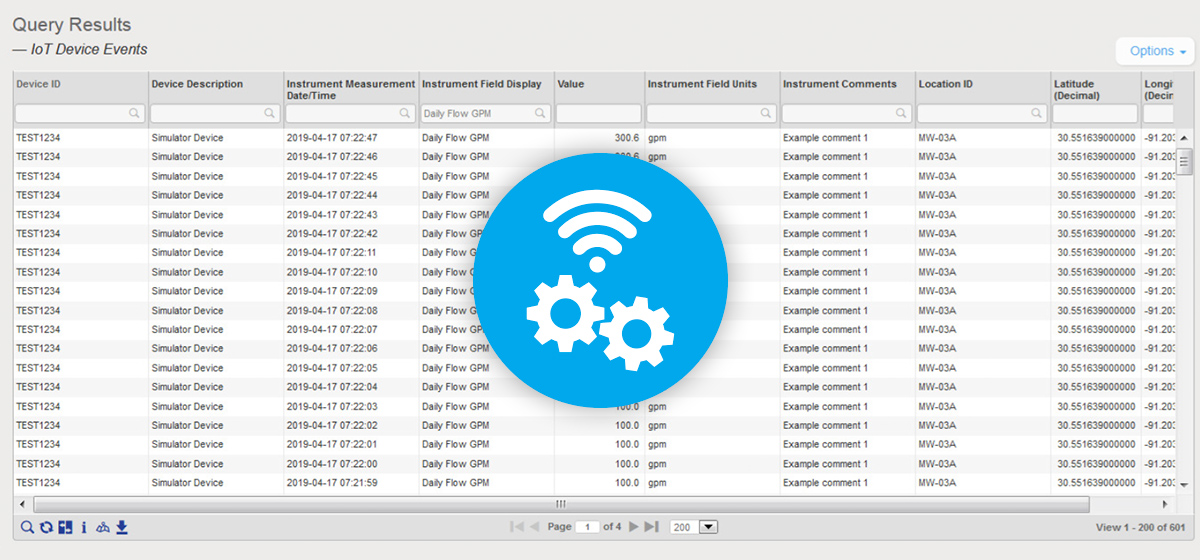
EIM can now be configured to accept data from IoT (internet of things) streaming devices. Locus must do a one-time connection between EIM and the customer’s IoT streaming application; the customer can then use EIM to define the devices and data fields to capture. EIM can accept data from multiple devices every second. Once the data values are in EIM, they can be exported using the Expert Query tool. From there, values can be shown on the GIS+ map if desired. The GIS+ Time Slider automation feature has also been updated to handle IoT data by allowing the time slider to use hours, minutes, and seconds as the time intervals.
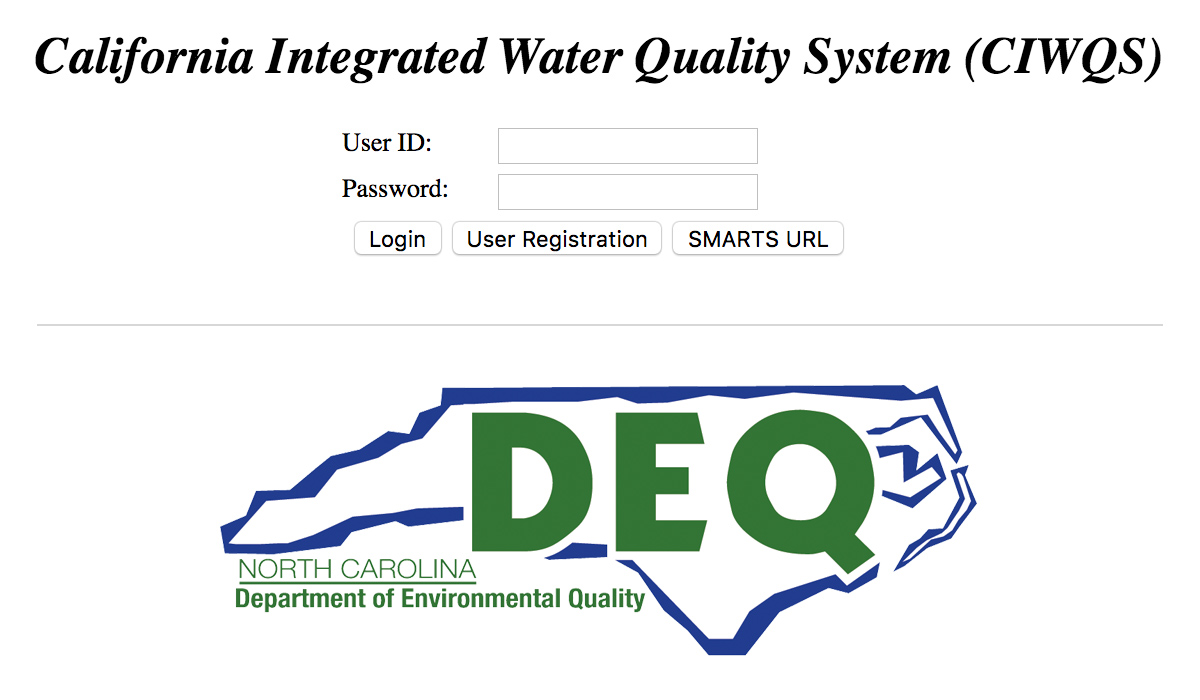
EIM currently supports several dozen regulatory agency export formats. In 2019, Locus added two more exports for CIWQS (California Integrated Water Quality System Project) and the NCDEQ (North Carolina Department of Environmental Quality). Locus continues to add more formats so customers can meet their reporting requirements.
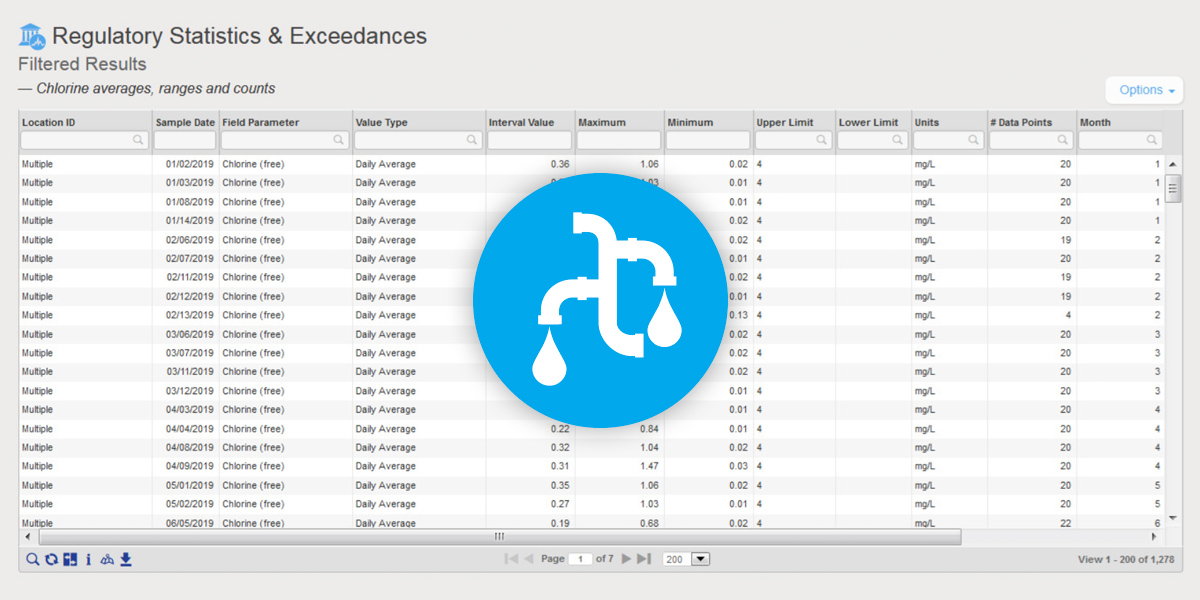
EIM is the world’s leading water quality management software, and has been used since 1999 by many Fortune 500 companies, water utilities, and the US Government. Locus added two key reports to EIM for Water in 2019 to further support water quality reporting. The first new report returns chlorine averages, ranges, and counts. The second new report supports the US EPA’s Lead and Copper rule and includes a charting option. Locus will continue to enhance EIM for Water by releasing the 2019 updates for the Consumer Confidence Report in January 2020.
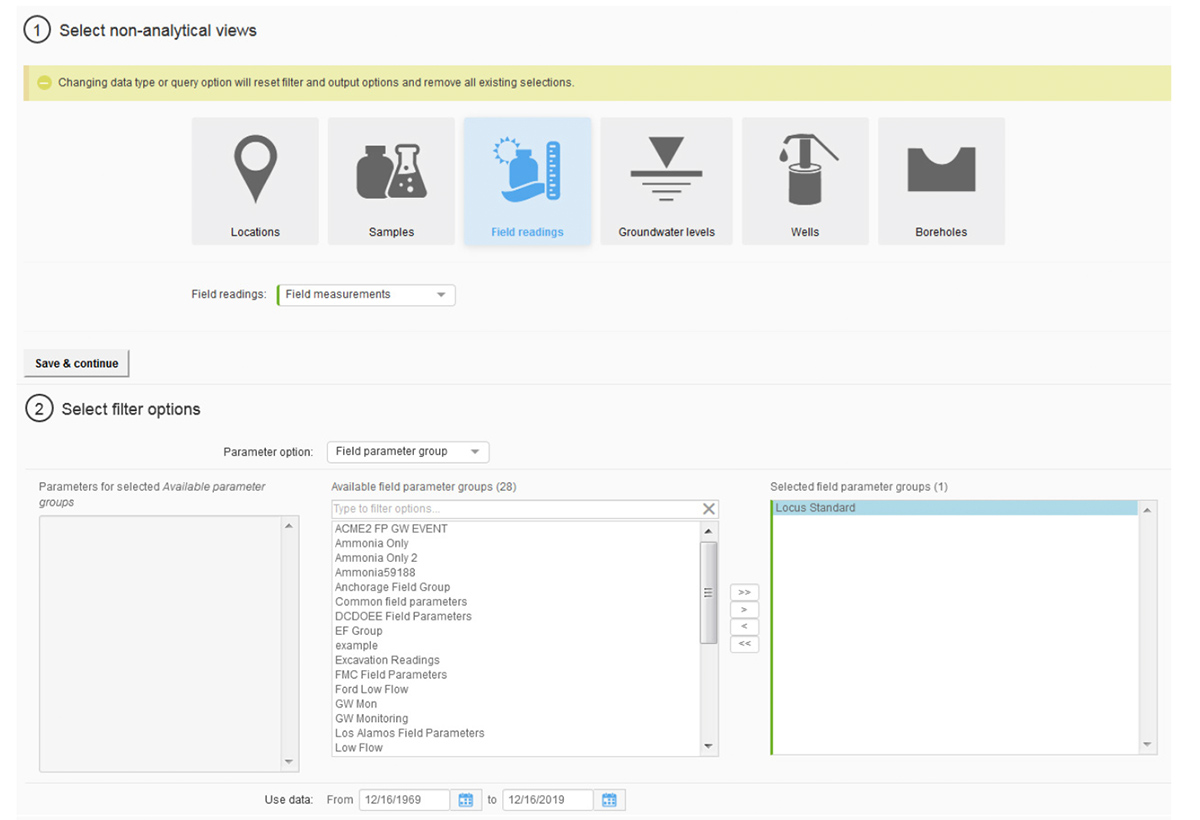
Locus continues to upgrade and improve the EIM user interface and user experience. The most noticeable change in 2019 was the overhaul of the Non-analytical Views pages in EIM, which support data exports for locations, samples, field readings, groundwater levels, and subsurface information. Roughly 25 separate pages were combined into one page that supports all these data views. Users are directed through a series of filter selections that culminate in a grid of results. The new page improves usability and provides one centralized place for these data reports. Locus plans to upgrade the Analytical Views in the same way in 2020.
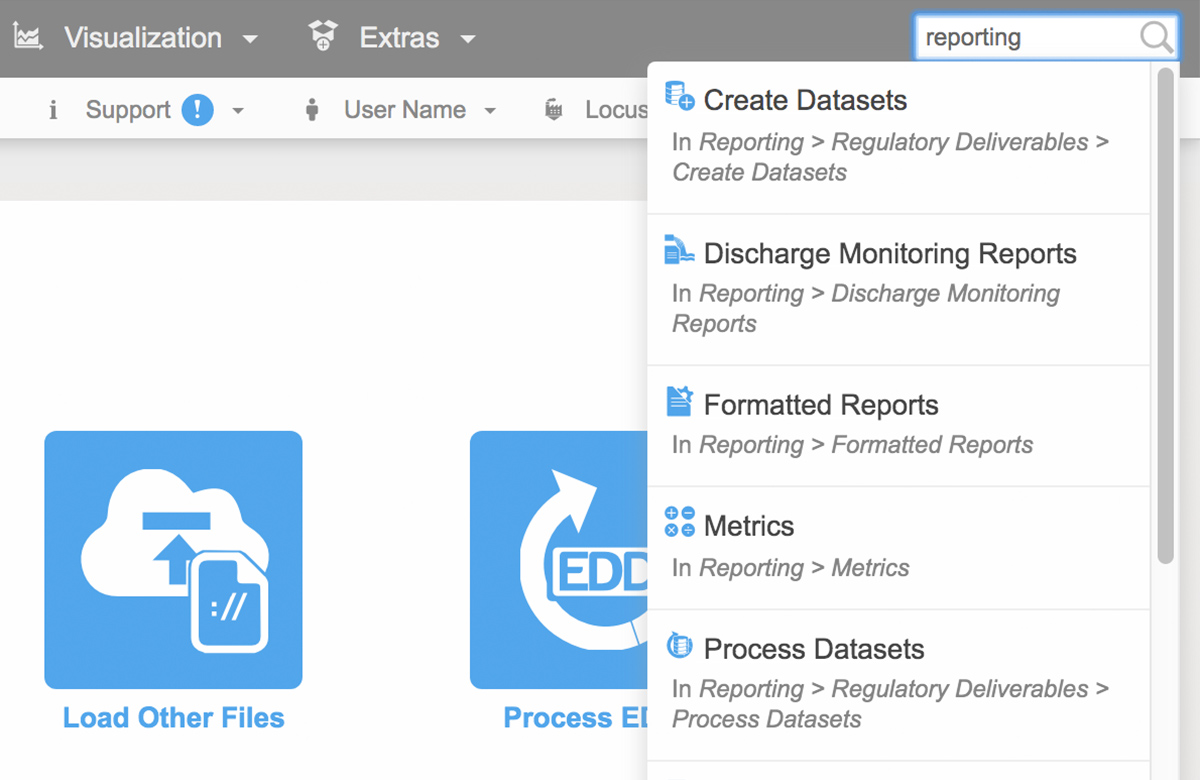
To help customers find the correct EIM menu function, Locus added a search box at the top right of EIM. The search box returns any menu items that match the user’s entered search term. In 2020, Locus will expand this search box to return matching help file documents and EDD error help, as well as searches for synonyms of menu items.
The EIM EDD loader now has a new “View history” option for viewing previously loaded data for the locations and parameters in the EDD. This function lets users put data in the EDD holding table into proper historical context. Users can check for any unexpected increases in parameter concentrations as well as new maximum values for a given location and parameter.
SAN FRANCISCO, Calif., 23 July 2019 — Locus Technologies (Locus), the market leader in multi-tenant SaaS water quality, environmental compliance, and sustainability management, today announced that it is going all-in on Amazon Web Services, Inc. (AWS), moving its entire infrastructure to the world’s leading cloud. By moving its flagship product EIM (Environmental Information Management) to AWS this month, Locus will complete its transition to AWS. Locus previously moved its Locus Platform (LP) to AWS in 2018.
EIM is the world’s leading water quality management software used by many Fortune 500 companies, water utilities, and the US Government since 1999. Among its many features, EIM delivers real-time tools to ensure that water utilities deliver clean water to consumers’ taps and don’t discharge contaminated wastewater above allowable limits to groundwater or surface water bodies like streams, lakes, or oceans.
EIM generates big data, and with over 500 million analytical records at over 1.3 million locations worldwide, it is one of the largest centralized, multi-tenant water quality management SaaS systems in the world. With anticipated growth in double digits stemming from the addition of streaming data from sensors and many IoT monitoring devices, Locus needed to have a highly scalable architecture for its software hosting. The unmatched performance and scalability of AWS’s offerings are just the right match for powering Locus’ SaaS.
Because of the scope of its applications, Locus is expecting to leverage the breadth and depth of AWS’s services (including its database systems, serverless architecture, IoT streaming, blockchain, machine learning, and analytics) to automate and enhance the on-demand EHS compliance, sustainability, facility, water, energy, and GHG management tools that Locus’ software provides to its customers.
Running on AWS’s fault-tolerant and highly performant infrastructure will help support Locus’s everyday business, and will scale easily for peak periods, where reporting demand such as GHG calculation engine or significant emissions incidents like spills can skyrocket scalability demand.
By leveraging Amazon CloudFront, Amazon Virtual Private Cloud (Amazon VPC), Amazon Elastic Kubernetes Service (Amazon EKS) and AWS Lambda, Locus is migrating to a microservices architecture to create more than 150 microservices that independently scale workloads while reducing complexity in the cloud, thereby enhancing every element of the customer cloud experience. Locus built a data lake on Amazon Simple Storage Service (Amazon S3) and will leverage Amazon Redshift to analyze the vast amount of data it is storing in the cloud, delivering insights and predictive analytics that uncover chemicals trending patterns and predict future emissions releases at various locations.
Locus intends to leverage AWS IoT services and Amazon Managed Blockchain by building a new native integration to help businesses generate value from the millions of events generated by connected devices such as real-time environmental monitoring sensors and environmental treatment systems controls. AWS IoT is a set of cloud services that let connected devices easily and securely interact with cloud applications like EIM and Locus Platform and other devices. Locus IoT Cloud on AWS allows customers to experience real-time emissions monitoring and management across all their connected sensors and devices. And for customers who want to allow multiple parties to transact (e.g. GHG trading) without a trusted central authority, AWS provides a fully managed, scalable blockchain service. Amazon Managed Blockchain is a fully managed service makes it easy to setup, deploy, and manage scalable blockchain networks that Locus intends to use for emissions management and trading.
For example, a water utility company that maintains thousands of IoT-enabled sensors for water flow, pressure, pH, or other water quality measuring devices across their dispersed facilities and pipeline networks will be able to use Locus IoT on AWS to ingest and manage the data generated by those sensors and devices, and interpret it in real time. By combining water sensor data with regulatory databases, water utility companies will be able to automatically create an emergency shutdown if chemical or other exceedances or device faults are detected and as such, will be better prepared to serve their customers and environment.
By combining the powerful, actionable intelligence in EIM and rapid responsiveness through Locus Platform with the scalability and fast-query performance of AWS, customers will be able to analyze large datasets seamlessly on arrival in real time. This will allow Locus’ customers to explore information quickly, find insights, and take actions from a greater variety and volume of data—all without investing the significant time and resources required to administer a self-managed on-premises data warehouse.
“After 22 years in business, and after evaluating AWS for a year with our Locus Platform, we decided to switch and continue all our business on AWS. We are taking advantage of their extensive computing power, depth and breadth of services and expertise to develop an effective cloud infrastructure to support our growing business and goal of saving the planet Earth by providing and managing factual information on emissions management, all the while reducing operational costs of Locus’ customers,” said Neno Duplan CEO of Locus. “By operating on AWS, we can scale and innovate quickly to provide new features and improvements to our services – such as blockchain-based emissions management – and deliver exceptional scalability for our enterprise customers. With AWS, we don’t have to focus on the undifferentiated heavy lifting of managing our infrastructure, and can concentrate instead on developing and improving apps and services.”
“By organizing and analyzing environmental, sustainability, and water quality information in the cloud, Locus is helping organizations to understand the impact of climate change on drinking water,” said Mike Clayville, Vice President, Worldwide Commercial Sales at AWS. “AWS’s unmatched portfolio of cloud services, proven operational expertise, and unmatched reliability will help Locus to further automate environmental compliance for companies ranging from local water utilities to multinational manufacturing corporations, to federal government research agencies. ”By choosing to go all-in on AWS, Locus is able to innovate and expand globally, developing new solutions that will leverage comprehensive analytics and machine learning services to gain deeper insights and forecast sustainability metrics that will help deliver clean drinking water to consumers around the world.”
Locus recently joined the nuclear power plant community in Orlando, FL for this year’s Radiological Effluents and Environmental Workshop. It’s always a pleasure to join other professionals in a space that encourages discussion, education, and awareness of industry processes and compliance.
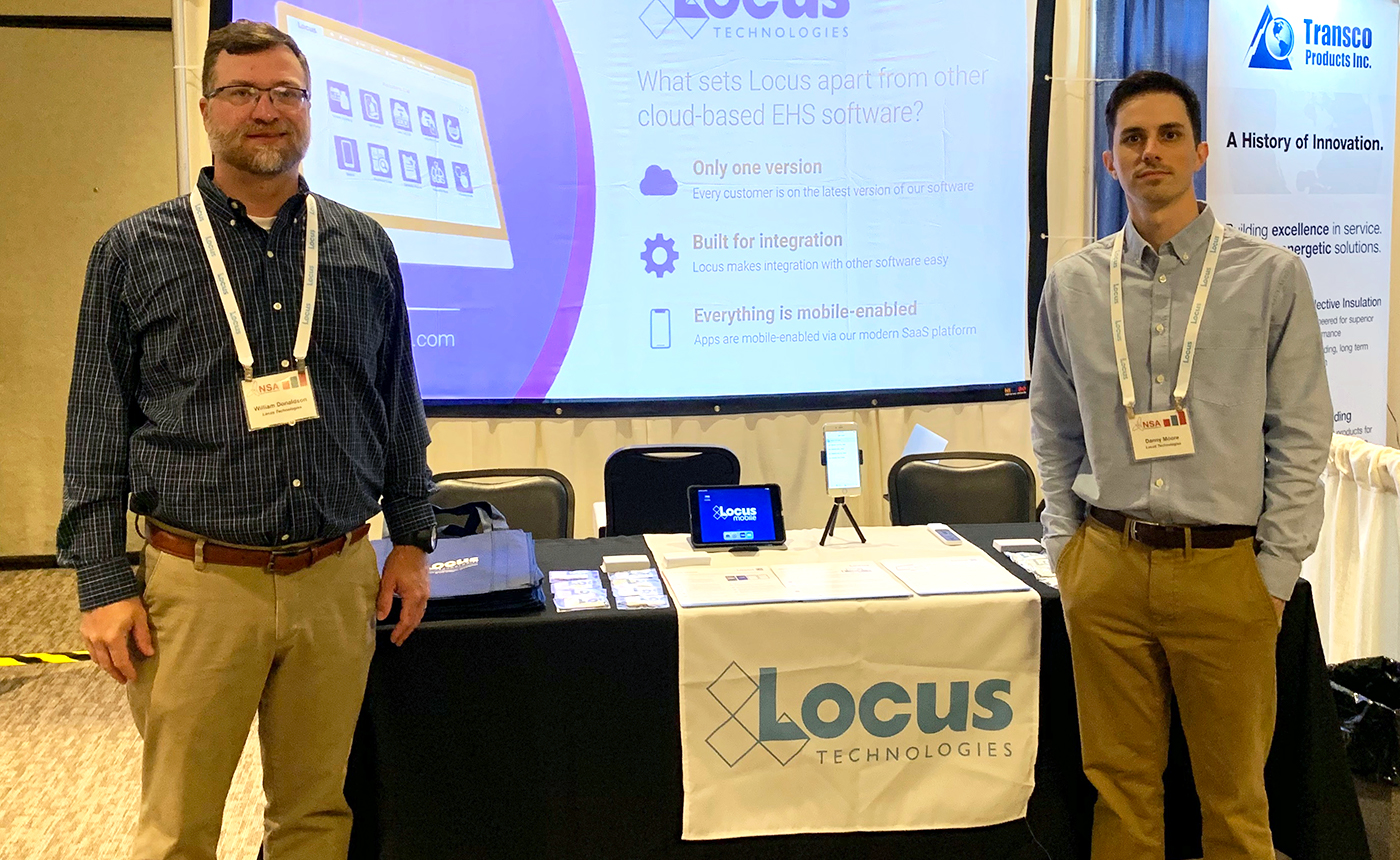
Bill Donaldson and Danny Moore of Locus Technologies.
Each conference we attend is an opportunity to learn. Whether talking with current or potential customers, it’s always fascinating to hear some of the success and horror stories experienced in their daily operations. We’ve summarized a few of those conversations below. And since REEW takes place in the summer, there’s a theme.
 Version Island
Imagine you’ve spent years utilizing a certain feature of your radiological software. You’ve gone through the training process, the growing pains, and you are finally enjoying the fruits of that labor. Now imagine learning that the latest and greatest version being released has removed the feature that you’ve grown to rely on. You are now stuck on a version island. At this point, a costly and time consuming upgrade will cause more problems. Locus SaaS has no version numbers, meaning you will never need to upgrade.
 Off the Grid
At one time, the simple columns and rows in Excel seemed to provide a sufficient solution to prepare your REMP sampling data for reports. However, when you need to transfer data between systems, or create more sophisticated reports, those grids begin to feel like prison bars. Maybe it’s time to go off the grid and deploy a more modern solution that can connect and work side by side with your existing tools.
 Sunsetting (Decommissioning)
Closing a power plant is a long and involved process that many attendees were in the process of dealing with or will be in the near future. This operational change can be the motivation to rethink the way radiological data is sampled and managed. Some software packages can be too big for the job. Locus offers a modular approach where you only pay for what you need. Choosing which system tools are relevant to the type of data sampling and resources available can minimize implementation cost and increase productivity.
 Serene Security
Many people we spoke with at REEW had serious security concerns. Locus takes those concerns seriously. We are SOC 1 and SOC 2 certified and have migrated our software to Amazon Web Services. All customer data is stored with AWS, one of the most advanced and secure cloud-hosting providers on the planet. Locus provides the ability to control user permissions, customizing access based on job duties. This provides a more granular approach to data security.
 Making Plans
Using a sample planning application organizes sample events and allows for scheduling weeks, months, or years in advance. Many were interested in this powerful tool that is flexible enough to adapt when a reactor changes modes, allowing for one-time, ad-hoc samples. Mobile applications that integrate with planned samples and events minimize setup, ease data collection, speed up loading field data, and can expedite samples to the lab more efficiently.
Your feedback has helped Locus build a solution that makes it easy to manage all your facility’s data for RETS/REMP, helping you meet your NRC reporting requirements. We enjoyed speaking with everyone at REEW and we look forward to seeing you again next year!
Learn more about Locus for Nuclear.
About the author—Danny Moore, Locus Technologies

Mr. Moore has spent the last decade designing and marketing for enterprise SaaS systems. In his career at Locus, he leads a team of marketing professionals in branding, content creation, social media engagement, and email outreach. Mr. Moore enjoys attending conferences as a Locus brand ambassador and sharing any feedback gained to improve product development.
About the author—Bill Donaldson, Locus Technologies

Mr. Donaldson has 5 years experience in SaaS systems, performing Product Management and QA/QC of Locus Mobile iOS application and Locus’ Environmental Information Management system (EIM). While completing his B.S., Mr. Donaldson held several paid internships, where he configured a Relational GeoDatabase and a Database Management System (DBMS), for biological data entry.
In most cities in the US, drinking water quality conforms with the norms of the Safe Drinking Water Act, which requires EPA to set Maximum Contaminant Levels (MCL) for potential pollutants. Besides, the EPA’s Consumer Confidence Rule (CCR) of 1998 requires most public water suppliers to provide consumer confidence reports, also known as annual water quality reports, to their customers.
PFAS stands for “perfluoroalkyl and polyfluoroalkyl substances,” with the most important thing to know that this large group of synthetic chemicals includes perfluorooctanoic acid (PFOA) and perfluorooctane sulfonate (PFOS).
Not Regulated by EPA
When it comes to drinking water from the tap in the US, the phrase that fits concerning PFOA and PFOS is “caveat emptor” (buyer beware). The EPA has not regulated these chemicals. There are no federal regulations for PFOA and PFOS in drinking water in the US.
In May 2016, the EPA established a drinking water “health advisory” of 70 parts per trillion (ppt) for the combined concentrations of PFOA and PFOS. While that was a start, there’s a big difference between a health advisory and a regulation that has teeth. Moreover, many scientists consider 70 ppt too high a limit. Reportedly, the EPA is considering turning its 70 ppt health advisory into regulation.
Meanwhile, some states have stepped up to the plate to protect their residents and visitors better. In April 2019, for instance, the New Jersey Department of Environmental Protection (DEP) proposed maximum contamination levels (MCLs) of 14 ppt for PFOA and 13 ppt for PFOS in the state’s drinking water.
As a water consumer, you should be aware of this crisis, as it has the potential to affect both your health and wealth.
What are PFOA and PFOS?
This toxic couple has contaminated the drinking water supply in areas surrounding some industrial sites and military bases. They’re the most studied of the PFAS group because they’re the ones that have been produced in the most significant quantities in the United States, according to the US Environmental Protection Agency (EPA).
PFOA and PFOS, which repel water and stains of various types, have been used as coatings on fabrics and leather and in the production of stain-repellent carpeting and are found in firefighting foams — which have been used extensively on US military bases for decades — among other products. Moreover, some related polyfluoroalkyl compounds can be transformed into these chemicals in the environment, per the National Institutes of Health (NIH), with the Environmental Working Group (EWG) stating that some perfluorinated chemicals not only break down into PFOA in the environment but also can do so in the human body.
While PFOA and PFOS are no longer made in the US, that hardly matters in our global economy. Both are still produced internationally, which means they end up in our country via imports of consumer goods such as carpet, apparel, textiles, and paper and packaging.
Why all the concern about PFOA and PFOS?
These chemicals — dubbed “forever chemicals” because they’re persistent in the environment and the human body — have been linked to cancer, thyroid disease, weakened the immune system and liver function, low infant birth weight, and other health problems, according to many sources.
And this is what the EPA says: “There is evidence that exposure to PFAS can lead to adverse health outcomes in humans. If humans, or animals, ingest PFAS…the PFAS are absorbed and can accumulate in the body. PFAS stay in the human body for long periods. As a result, as people get exposed to PFAS from different sources over time, the level of PFAS in their bodies may increase to the point where they suffer from adverse health effects.”