Compliance Minute – Waste Container Status Vlog
Chris De Cree, an EHS Implementation Manager from Locus Technologies walks us through our container tracking tool.
Chris De Cree, an EHS Implementation Manager from Locus Technologies walks us through our container tracking tool.
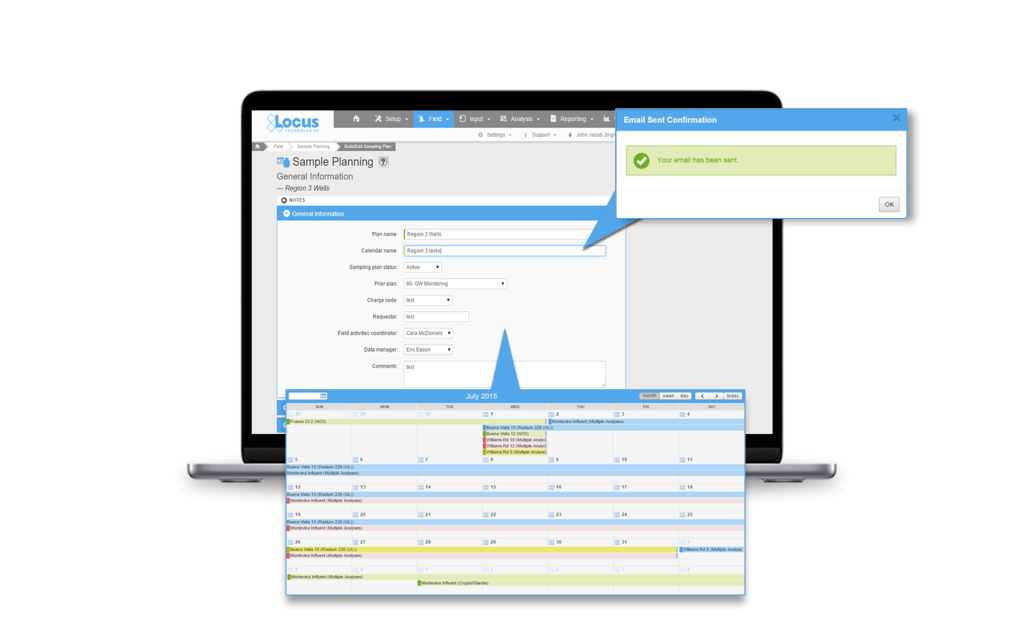
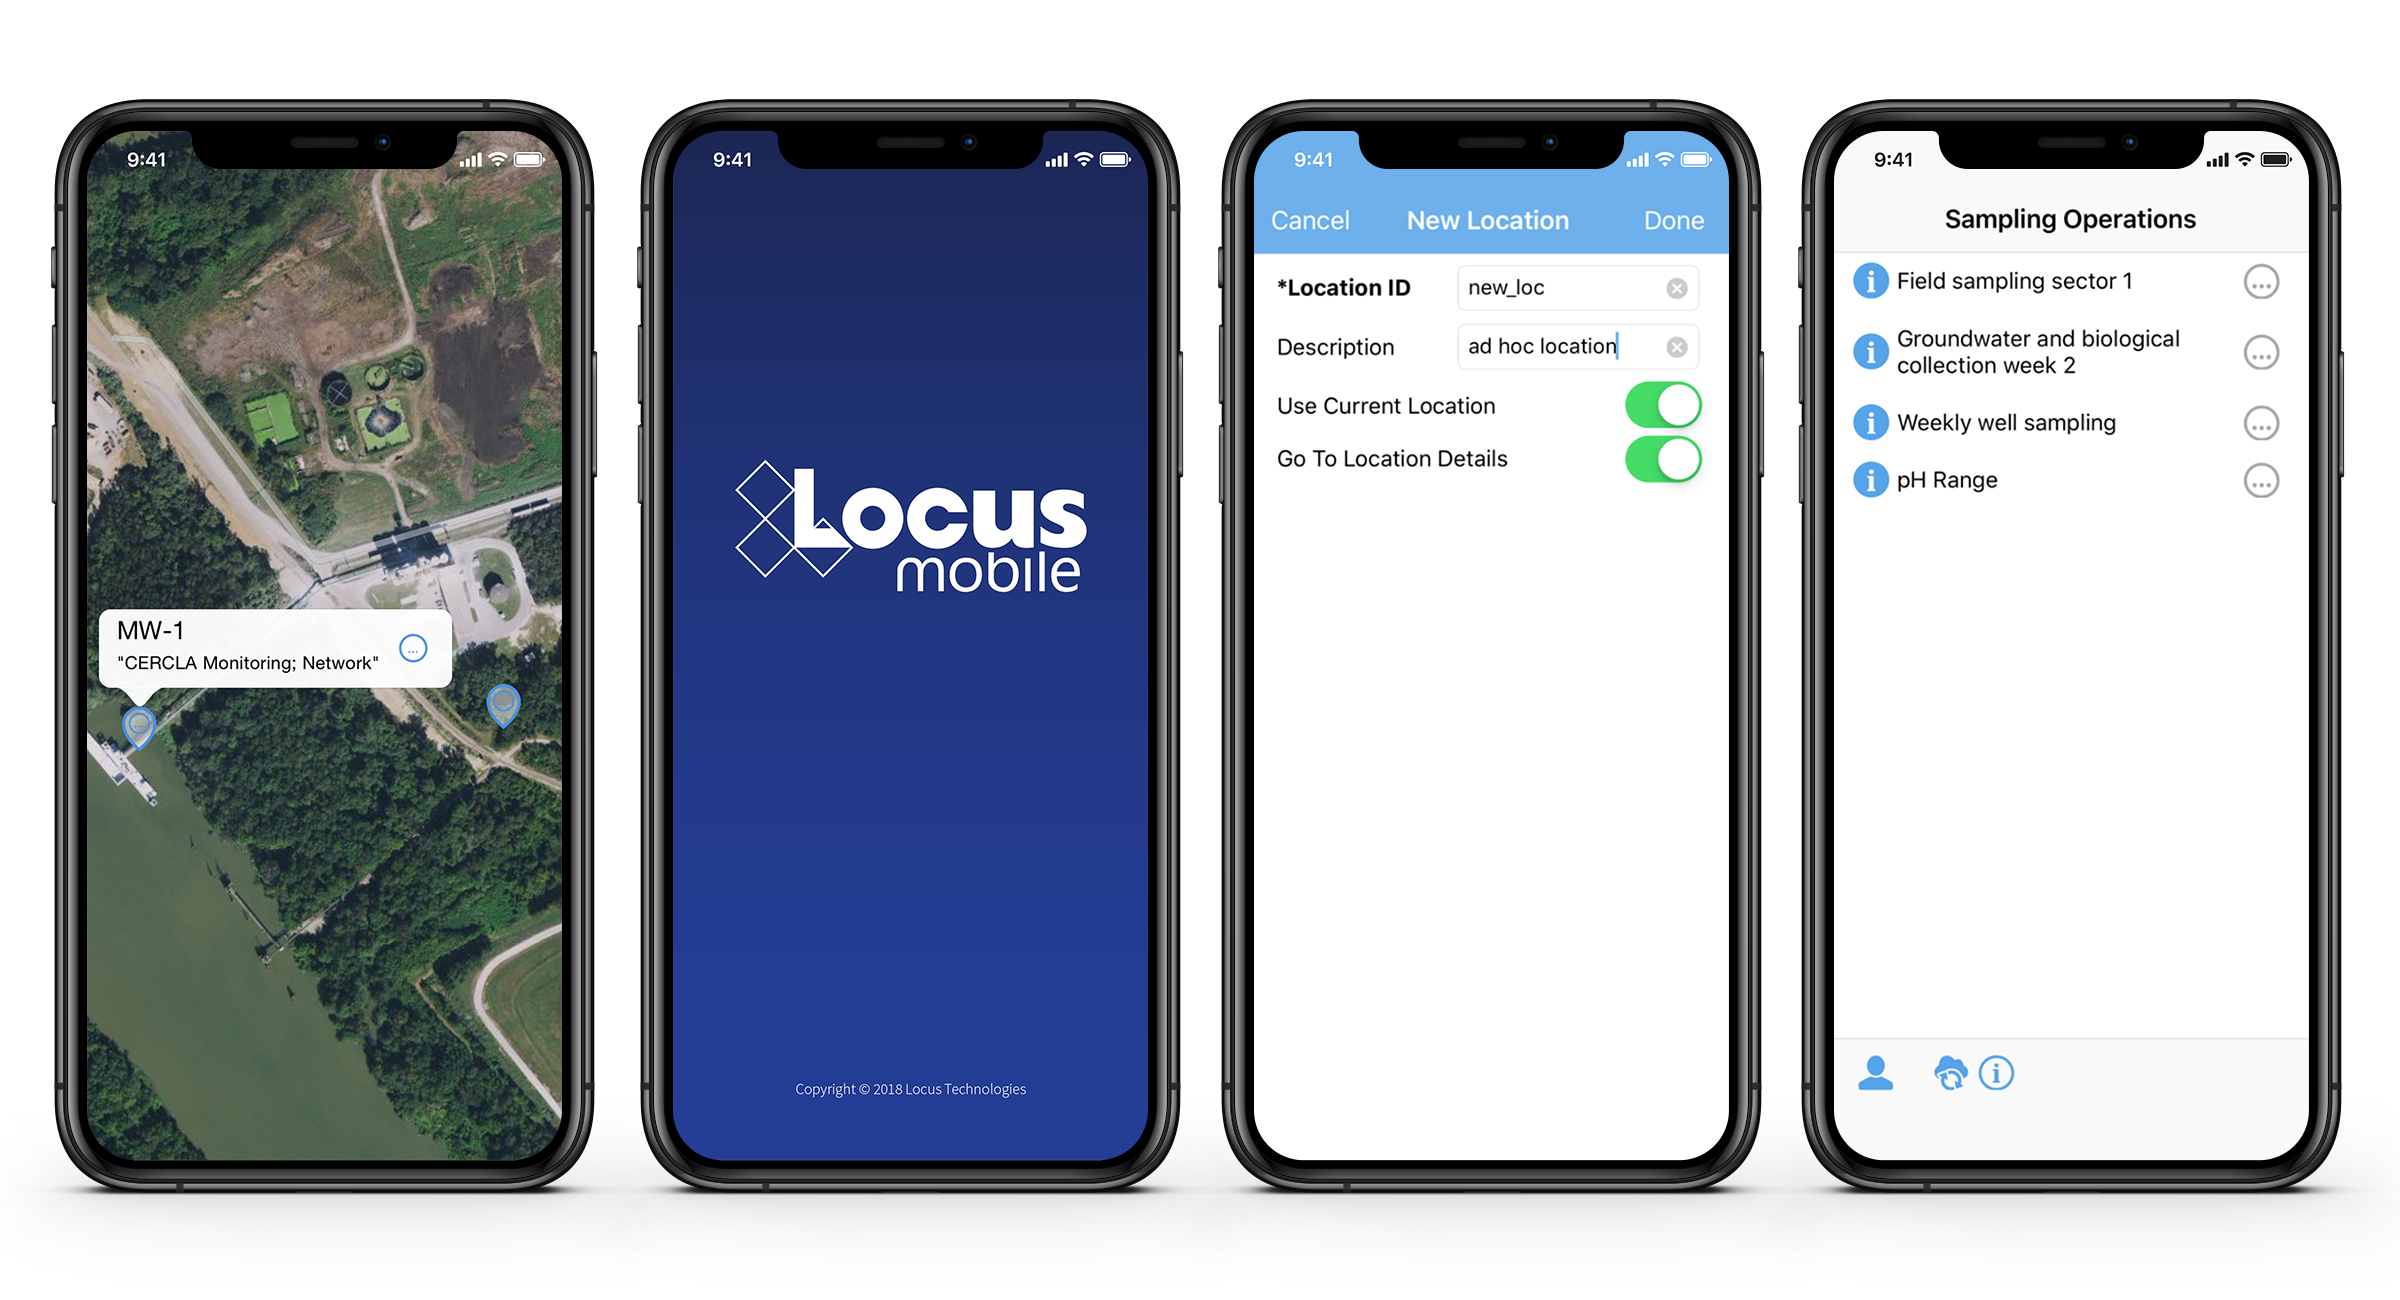
Locus Technologies’ customizable software makes scheduling and collecting routine water samples is made easy by using Locus Mobile and EIM.
Mobile apps for water and wastewater operation and maintenance (O&M) activities have been around for some time now. Most users are familiar with the benefits such as instant data collection and access to reference information for better, more reliable O&M monitoring.
There is a need for most water entities to centralize data, and more easily load, share, analyze, and report data. Locus Technologies’ customizable software makes scheduling and collecting routine water samples is made easy by using Locus Mobile and EIM. Below is a list of frequent challenges that customers have encountered during their water sampling process and how they can be solved using the right tools from Locus. or better communications.
Planning tools need to allow flexibility in terms of different sampling intervals and date ranges, different field and analytical parameters, and account for location grouping. Using a well-designed application can pull together all of this detailed information and can provide a summary view of the individual samples. A manager can easily view sample status, and whether the sample is complete, in process, or planned. A well-designed application can also generate the chain of custody (COC), and lab and sample shipping date information and labels per sample, which is a huge time saver. This type of sample tracking detail seemed to be very useful to many conference attendees to help ensure they are in regulatory compliance with required sampling frequencies. A key feature to look for is an application that is flexible enough that it can allow one-time, unplanned sample events such as water main breaks, customer complaints and schedule changes, and can handle complex multi-year routine sampling with ease. As a plus, it’s easy for you or your manager to know where you stand at any time.
Data entry errors and fixing bad data when it was transcribed from field notes to Excel or other programs is a persistent problem with the old way of doing things. Your company needs a better way to streamline the error prone data collection process. Many clients are interested in an alternative to the pencil/paper/clipboard method and had goals to move to tablet or smartphone for data collection. The universal wish list for mobile field applications included:
Everyone is aware that software updates all the time. Sometimes its security enhancements and sometime feature enhancements or bug fixes. A source of frustration is getting a software update and not knowing what was updated or how best to incorporate a new feature/enhancement into their established process. There was also concern for impact to an established routine with field crews that were used to the existing way of doing things. Even if a functionality improved the workflow, enhancements are only valuable to a user if they understand how to use them and how to incorporate them into their existing process.
Mobile applications, which appear very simple to the users, are in reality complex software and require careful integration with the receiving database for a range of complex use cases. This makes rolling out new mobile features challenging for both the developers and the users. Enhanced customer/developer communication along with a sandbox environment can go a long way towards solving some of the inherent issues with rapid innovations and updates associated with cloud and mobile software.
Software tools are available and can solve a lot of the common data management challenges, but know what you want, know the problem you are trying to solve and know it will take some time and effort, but the end result will significantly improve your business processes. Though these challenges are present when choosing a software, Locus Technologies has the experts to help you hurdle the challenges to find the solution that is best for your business.
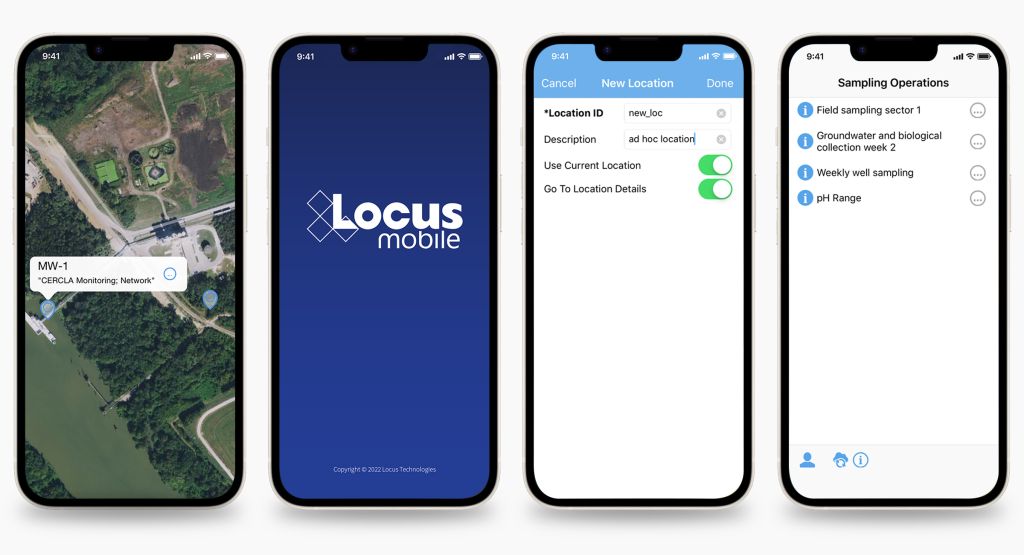
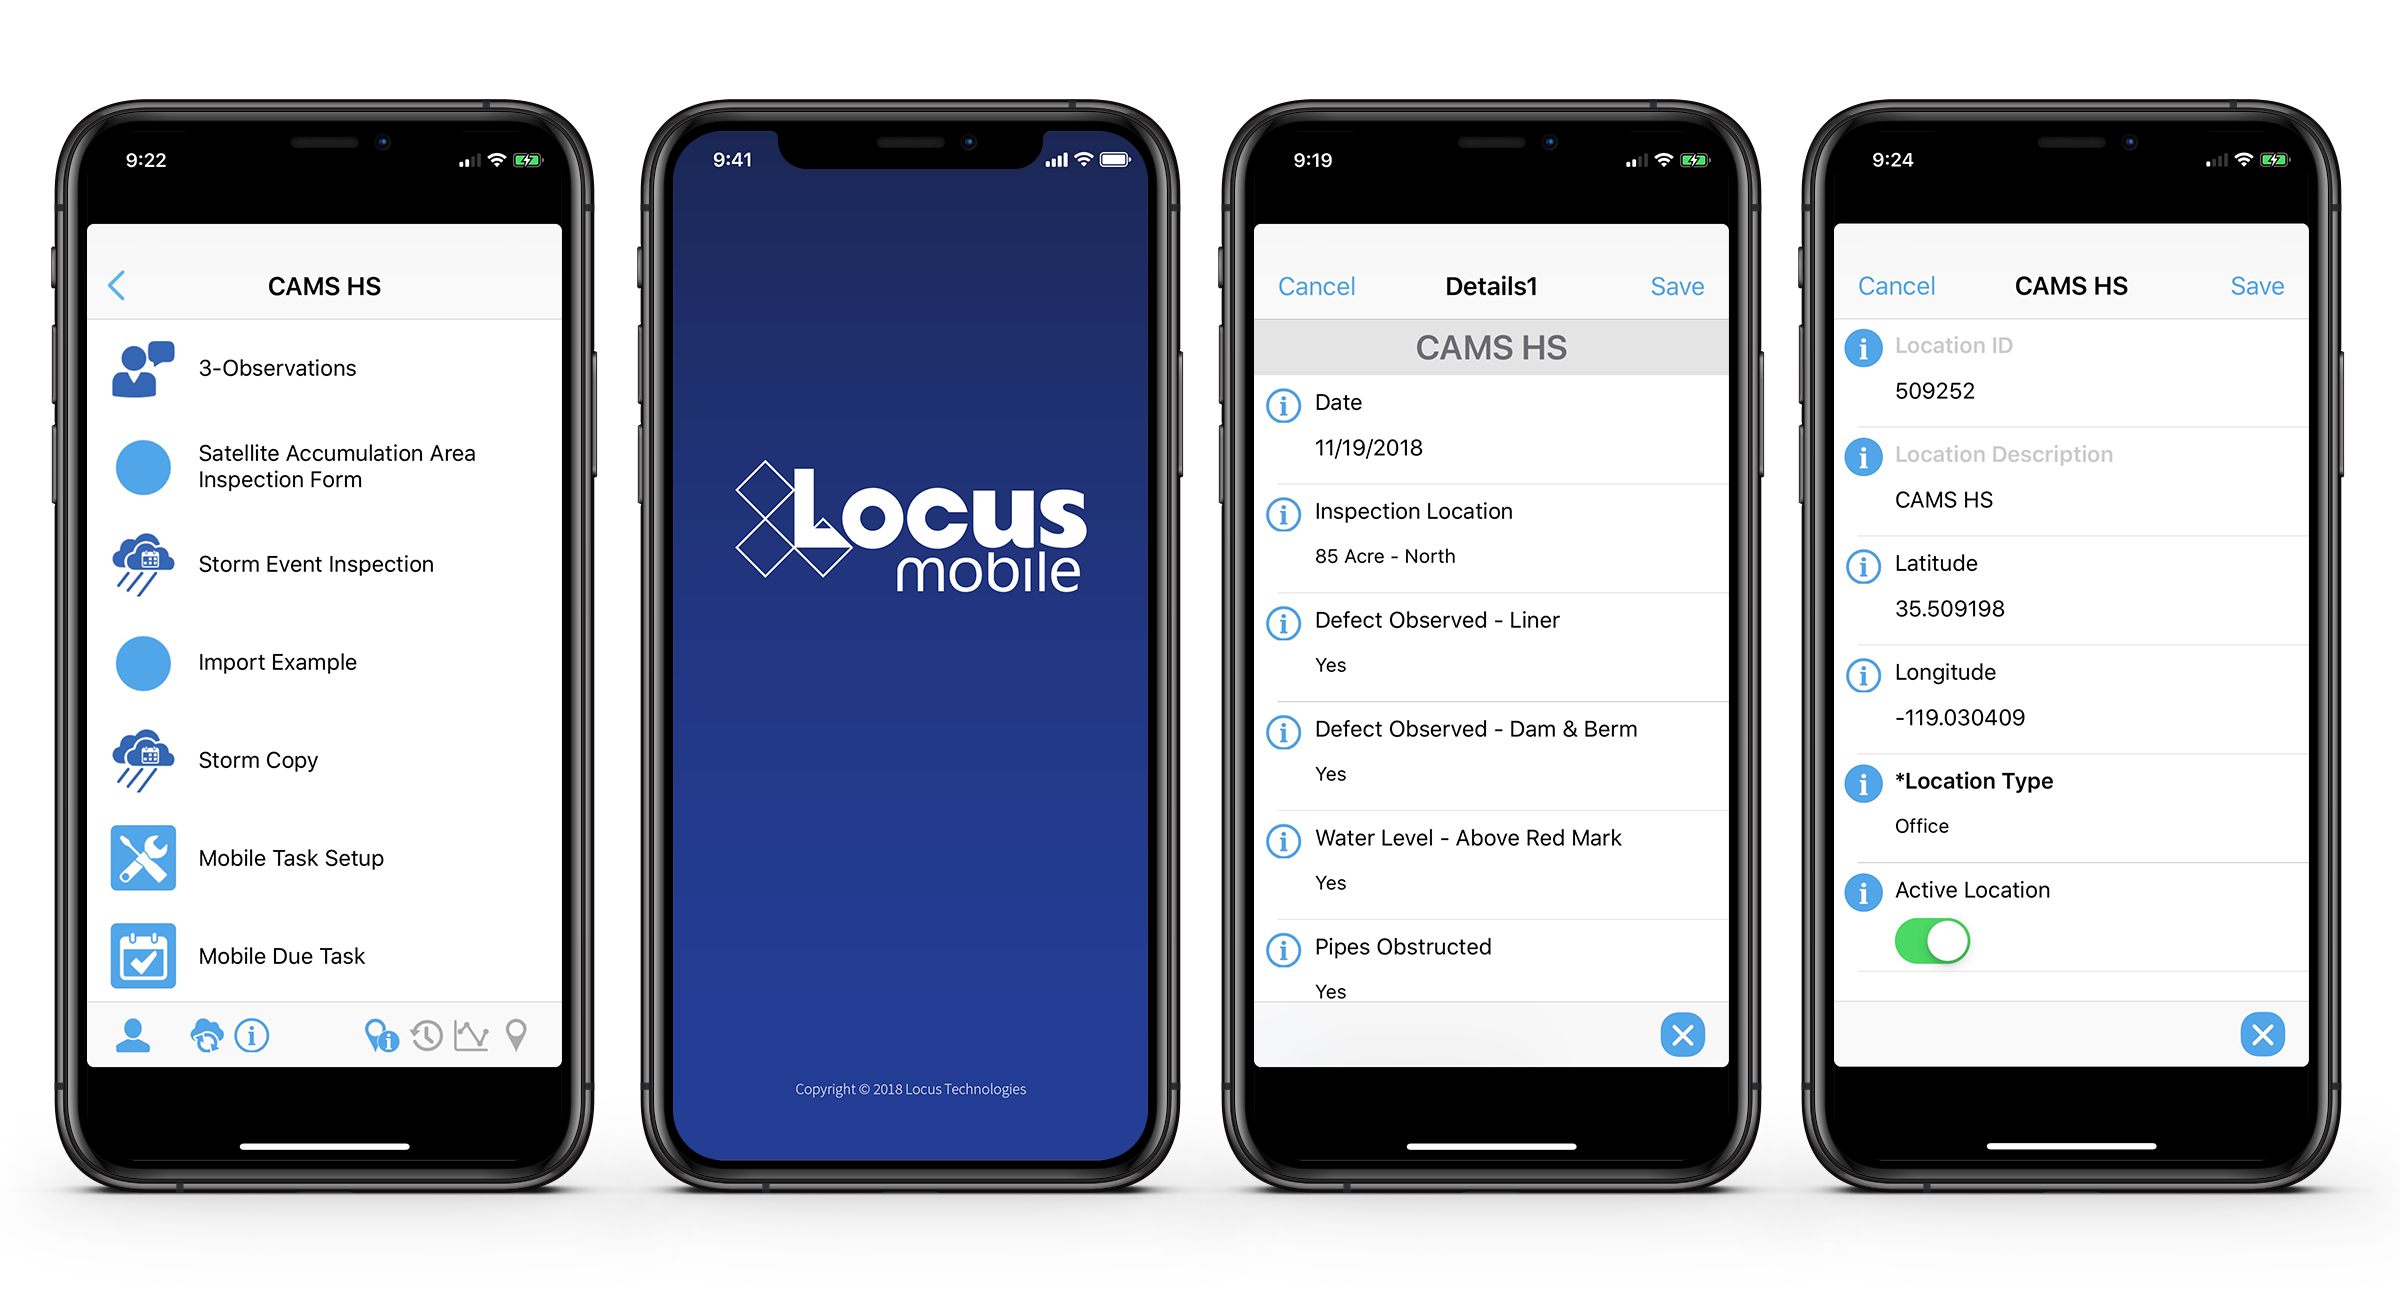
Tracking your data is made easy within our software as a service (SaaS), Locus Platform (LP). Your company can take advantage of LP’s mobile-aware browser functions, giving you the capability to do all your fieldwork with your existing phones or tablets. When cellular connections are unavailable or unreliable, Locus also has a Mobile app which supports the offline capabilities you need to keep your workflow going.
Regardless of your mobile approach, each mobile form can be easily configured to capture the data you require in the field such as photos and the sampling results.
Whether in the office, or out in the field, Locus Technologies is with you every step of the way during the tracking process. Contact us to find your solution.
![]()
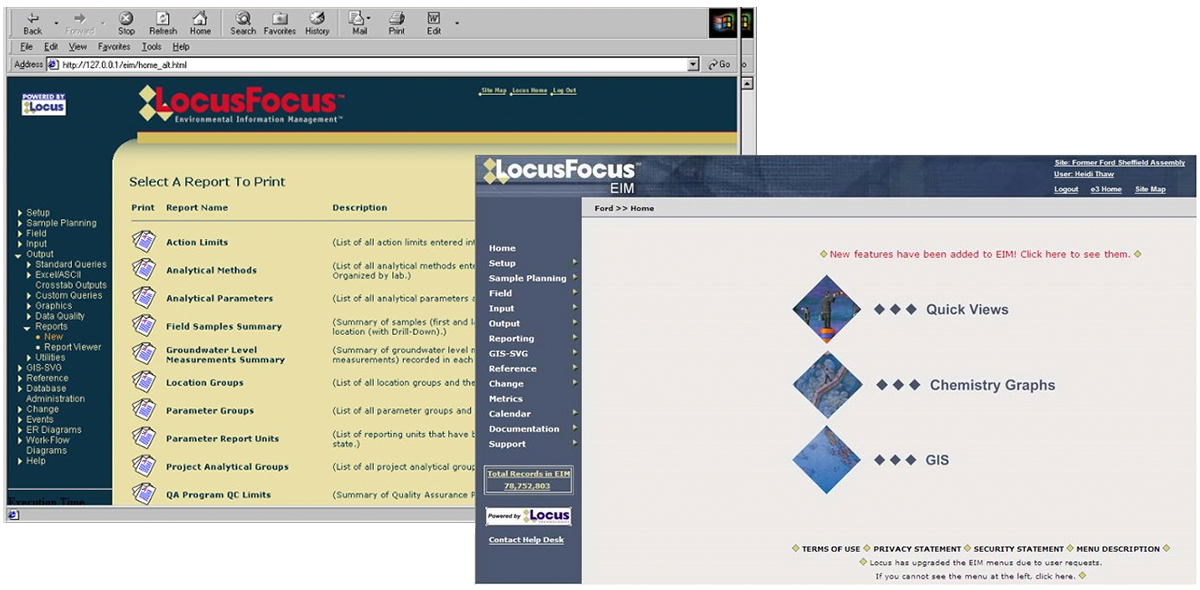
Locus was founded on the vision of online environmental data management for large volumes of complex data collected as part of environmental site investigations. Locus’ Environmental Information Management (EIM) has remained the market leader in cloud environmental data management systems for over 20 years. EIM continues to evolve to meet an ever-wider customer base from international chemical companies to local water districts. Locus has approached EIM’s evolution with the same focus since day 1, handle any type of environmental data with ease and sophistication, enabling our customers to spend less time handling data and more time assessing information.
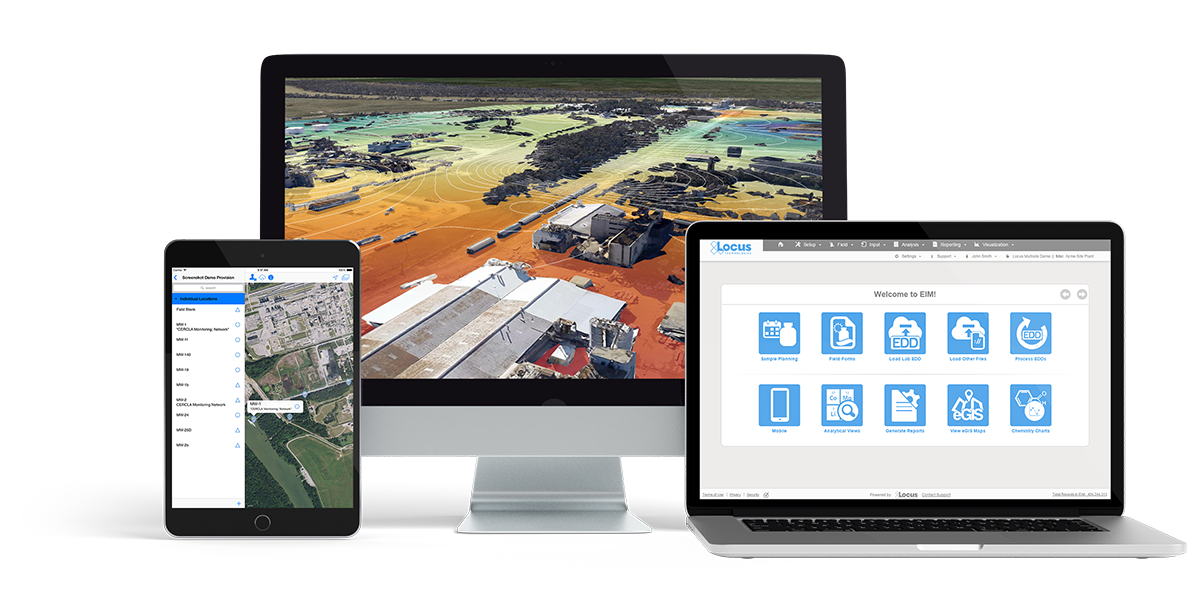
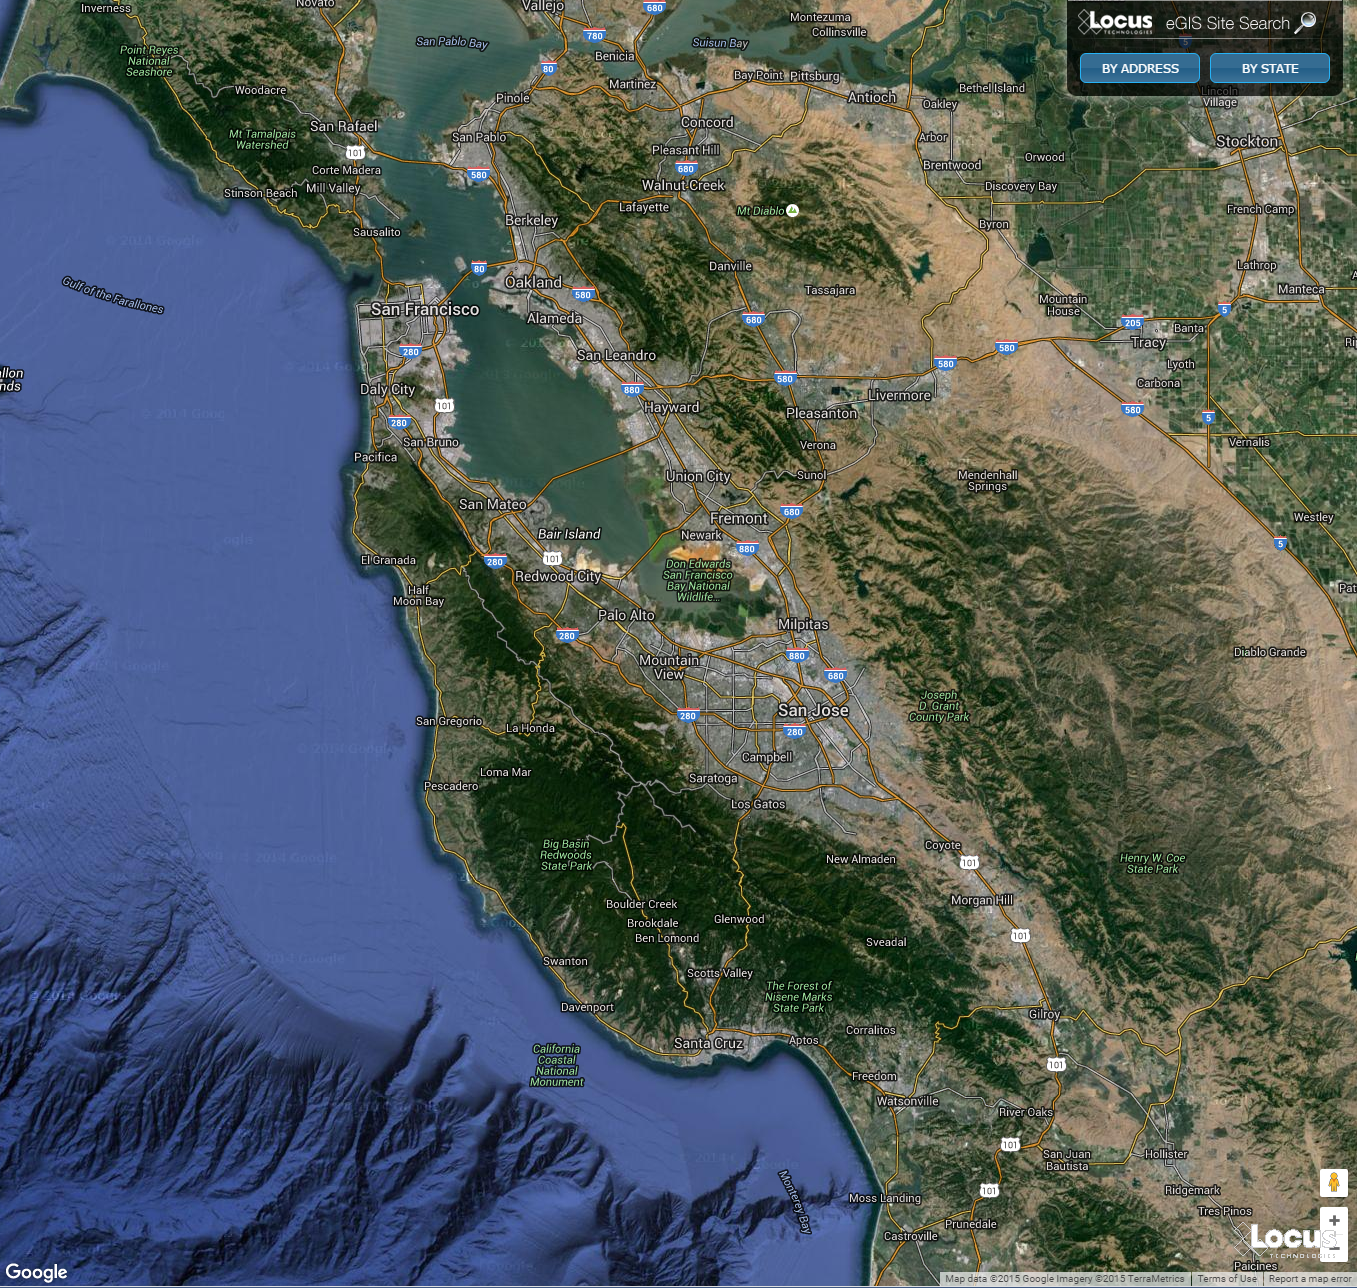
Since Google Maps was first announced, Locus worked to add GIS elements to our software as soon as it was technically feasible. Our easy-to-use visualization tools have evolved over the years from Scalable Vector Graphics, to Google, to Esri ArcGIS Online. Born with our EIM software, GIS visualization of information was something our customers wanted and loved. Always included in our pricing, having the ability to easily make maps from complex data was always a key feature of EIM. With technical advances, our maps are even more robust and integral to our vision of environmental information management.
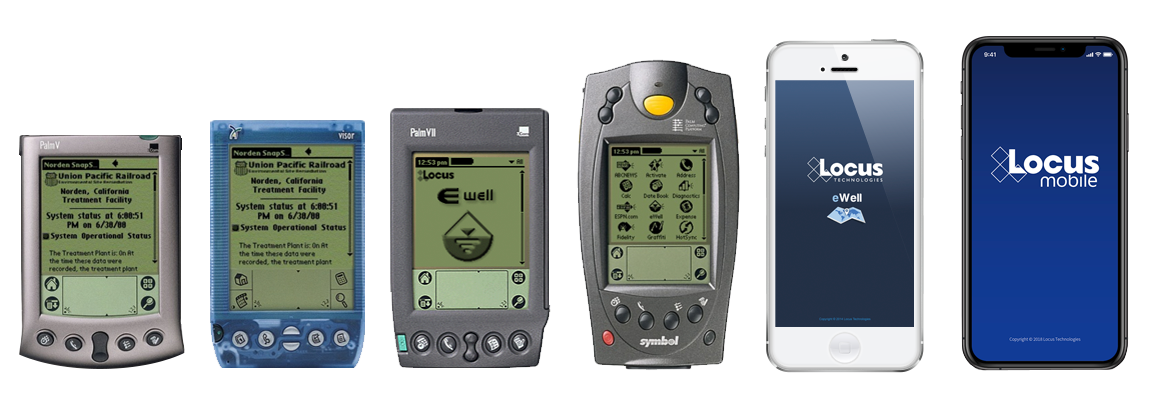
In 2000, Locus launched the first environmental data management mobile solution connected to SaaS. 20 years later, Locus Mobile is your single solution for collecting field data, completing EHS audits, tracking waste containers, and much more. Easily configure business-specific data collection needs, enter data offline and synchronize data back to the cloud for final review.
Locus has evolved and innovated SaaS solutions to meet the needs of our EHS and Water Quality customers for over 20 years. As technology and regulatory requirements change, rest assured Locus is working hard so that your organization can be ahead of the curve.
Today is GIS Day, a day started in 1999 to showcase the many uses of geographical information systems (GIS). To celebrate the passage of another year, this blog post examines how maps and GIS show time, and how Locus GIS+ supports temporal analysis for use with EIM, Locus’s cloud-based, software-as-a-service application for environmental data management.
Since GIS was first imagined in 1962 by Roger Tomlinson at the Canada Land Inventory, GIS has been used to display and analyze spatial relationships. Every discrete object (such as a car), feature (such as an acre of land), or phenomenon (such as a temperature reading) has a three-dimensional location that can be mapped in a GIS as a point, line, or polygon. The location consists of a latitude, longitude, and elevation. Continuous phenomenon or processes can also be located on a map. For example, the flow of trade between two nations can be shown by an arrow connecting the two countries with the arrow width indicating the value of the traded goods.
However, everything also has a fourth dimension, time, as locations and attributes can change over time. Consider the examples listed above. A car’s location changes as it is driven, and its condition and value change as the car gets older. An acre of land might start covered in forest, but the land use changes over time if the land is cleared for farming, and then later if the land is paved over for a shopping area. The observed temperature at a given position changes with time due to weather and climate changes spanning multiple time scales from daily to epochal. Finally, the flow of trade between two countries changes as exports, imports, and prices alter over time.
Traditional flat maps already collapse three dimensions into two, so it’s not surprising that such maps do not handle the extra time dimension very well. Cartographers have always been interested in showing temporal data on maps, though, and different methods can be employed to do so. Charles Minard’s famous 1861 visualization of Napoleon’s Russian campaign in 1812-1813 is an early example of “spatial temporal” visualization. It combines two visuals – a map of troop movements with a time series graph of temperature – to show the brutal losses suffered by the French army. The map shows the army movement into Russia and back, with the line width indicating the troop count. Each point on the chart is tied to a specific point on the map. The viewer can see how troop losses increased as the temperature went from zero degrees Celsius to -30 degrees. The original thick tan line has decreased to a black sliver at the end of the campaign.
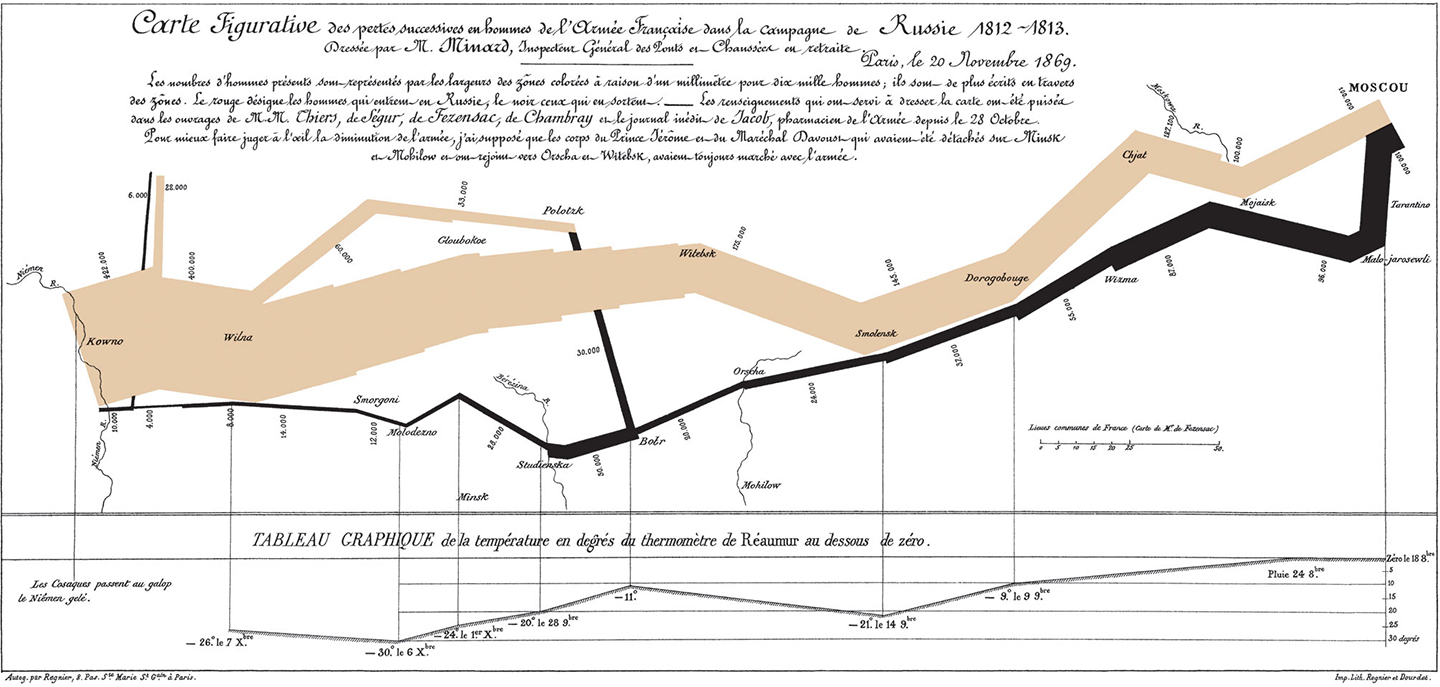
Charles Minard’s map of Napoleon’s Russian campaign in 1812-1813.
The Minard visual handles time well because the temperature chart matches single points on the map; each temperature value was taken at a specific location. Showing time changes in line or area features, such as roads or counties, is harder and is usually handled through symbology. In 1944, the US Army Corps of Engineers created a map showing historical meanders in the Mississippi River. The meanders are not discrete points but cover wide areas. Thus, past river channels are shown in different colors and hatch patterns. While the overlapping meanders are visually complex, the user can easily see the different river channels. Furthermore, the meanders are ‘stacked’ chronologically, so the older meanders seem to recede into the map’s background, similar to how they occur further back in time.
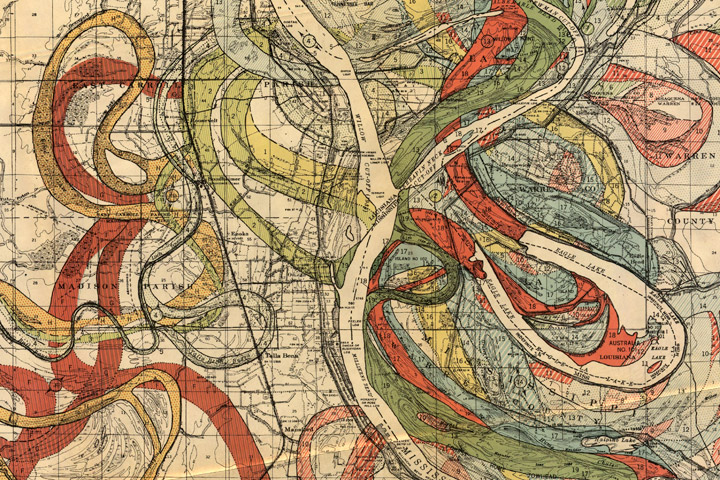
Inset from Geological Investigation of the Alluvial Valley of the Lower Mississippi River.
Another way to handle time is to simply make several maps of the same features, but showing data from different times. In other words, a temporal data set is “sliced” into data sets for a specific time period. The viewer can scan the multiple maps and make visual comparisons. For example, the Southern Research Station of the US Forest Service published a “report card” in 2011 for Forest Sustainability in western North Carolina. To show different land users over time, small maps were generated by county for three years. Undeveloped land is colored green and developed land is tan. Putting these small maps side by side shows the viewer a powerful story of increasing development as the tan expands dramatically. The only drawback is that the viewer must mentally manipulate the maps to track a specific location.
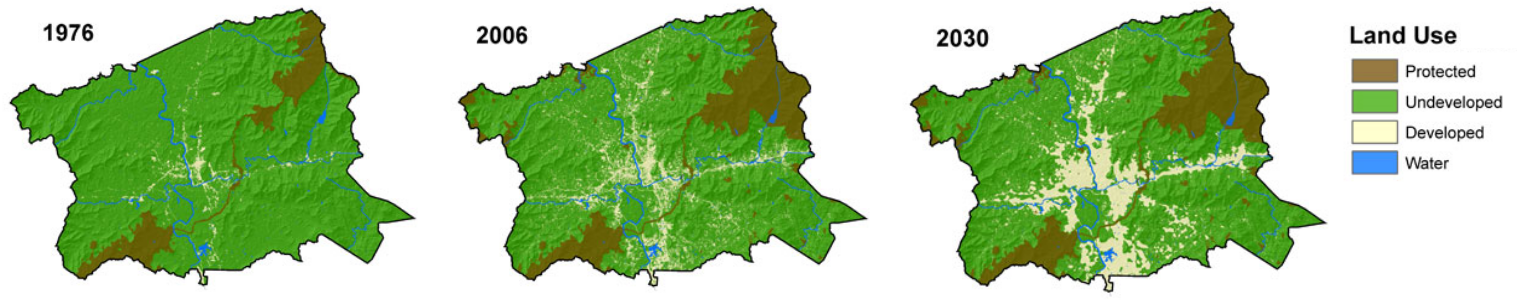
Land Use change over time for Buncombe County, NC
The previous map examples prove that techniques exist to successfully show time on maps. However, such techniques are not widespread. Furthermore, in the era of “big data” and the “Internet of Things”, showing time is even more important. Consider two examples. First, imagine a shipment of 100 hazardous waste containers being delivered on a truck from a manufacturing facility to a disposal site. The truck has a GPS unit which transmits its location during the drive. Once at the disposal site, each container’s active RFID tag with a GPS receiver tracks the container’s location as it proceeds through any decontamination, disposal, and decommission activities. The locations of the truck and all containers have both a spatial and a temporal component. How can you map the location of all containers over time?
As a second example, consider mobile data collection instruments deployed near a facility to check for possible contamination in the air. Each instrument has a GPS so it can record its location when the instrument is periodically relocated. Each instrument also has various sensors that check every minute for chemical levels in the air plus wind speed and temperature. All these data points are sent back to a central data repository. How would you map chemical levels over time when both the chemical levels and the instrument locations are changing?
In both cases, traditional flat maps would not be very useful given the large amounts of data that are involved. With the advent of GIS, though, all the power of modern computers can be leveraged. GIS has a powerful tool for showing time: animation. Animation is similar to the small “time slice” maps mentioned above, but more powerful because the slices can be shown consecutively like a movie, and many more time slices can be created. Furthermore, the viewer no longer has to mentally stack maps, and it is easier to see changes over time at specific locations.
Locus has adopted animation in its GIS+ solution, which lets a user use a “time slider” to animate chemical concentrations over time. When a user displays EIM data on the GIS+ map, the user can decide to create “time slices” based on a selected date field. The slices can be by century, decade, year, month, week or day, and show the maximum concentration over that time period. Once the slices are created, the user can step through them manually or run them in movie mode.
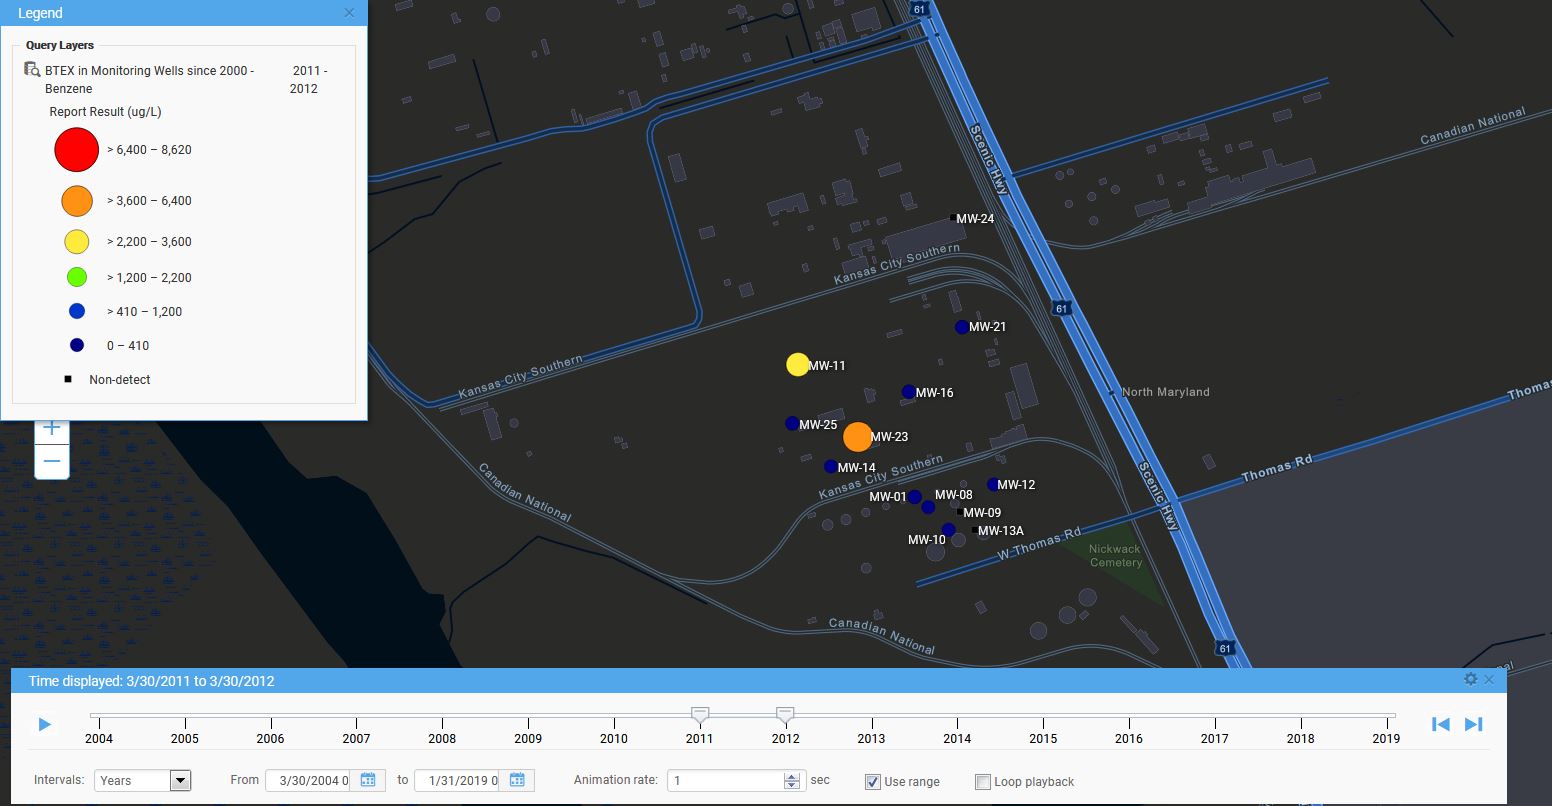
To use the time slider, the user must first construct a query using the Locus EIM application. The user can then export the query results to the GIS+ using the time slider option. As an example, consider an EIM query for all benzene concentrations sampled in a facility’s monitoring wells since 2004. Once the results are sent to the GIS+, the time slider control might look like what is shown here. The time slices are by year with the displayed slice for 3/30/2004 to 3/30/2005. The user can hit play to display the time slices one year at a time, or can manually move the slider markers to display any desired time period.

Locus GIS+ time slider
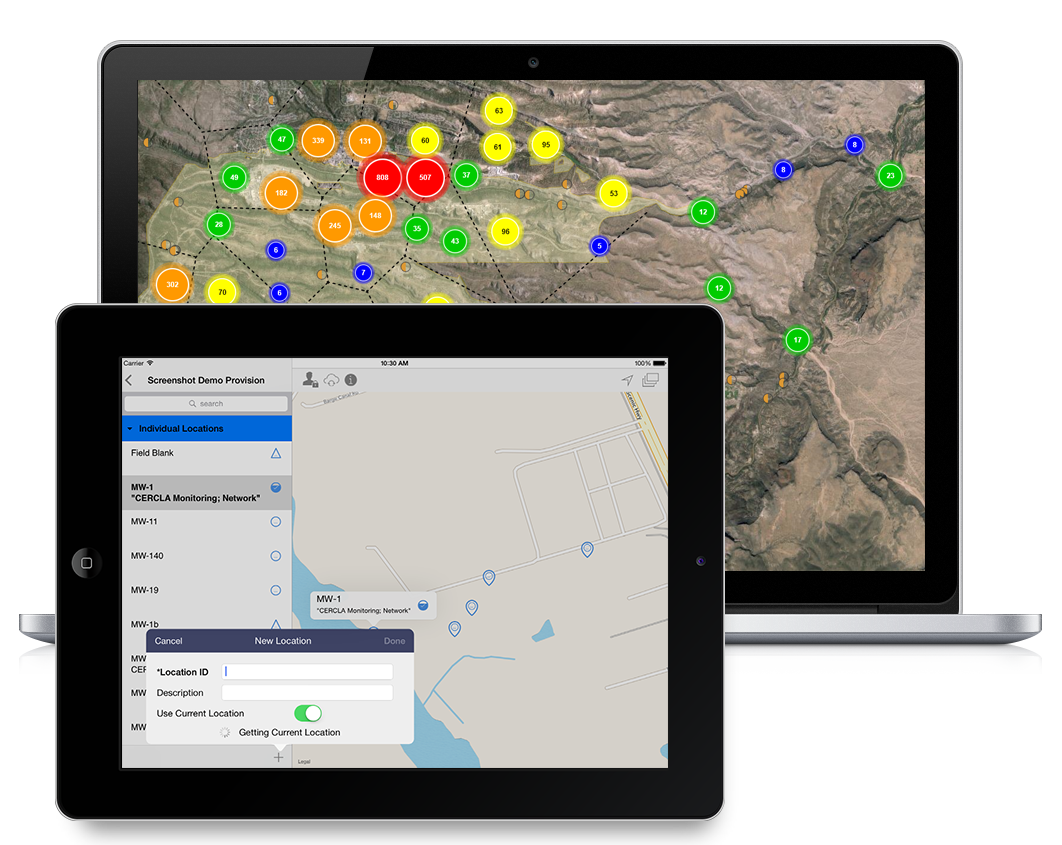
Here is an example of a time slice displayed in the GIS+. The benzene results are mapped at each location with a circle symbol. The benzene concentrations are grouped into six numerical ranges that map to different circle sizes and colors; for example, the highest range is from 6,400 to 8,620 µg/L. The size and color of each circle reflect the concentration value, with higher values corresponding to larger circles and yellow, orange or red colors. Lower values are shown with smaller circles and green, blue, or purple colors. Black squares indicate locations where benzene results were below the chemical detection limit for the laboratory. Each mapped concentration is assigned to the appropriate numerical range, which in turn determines the circle size and color. This first time slice for 2004-2005 shows one very large red “hot spot” indicating the highest concentration class, two yellow spots, and several blue spots, plus a few non-detects.
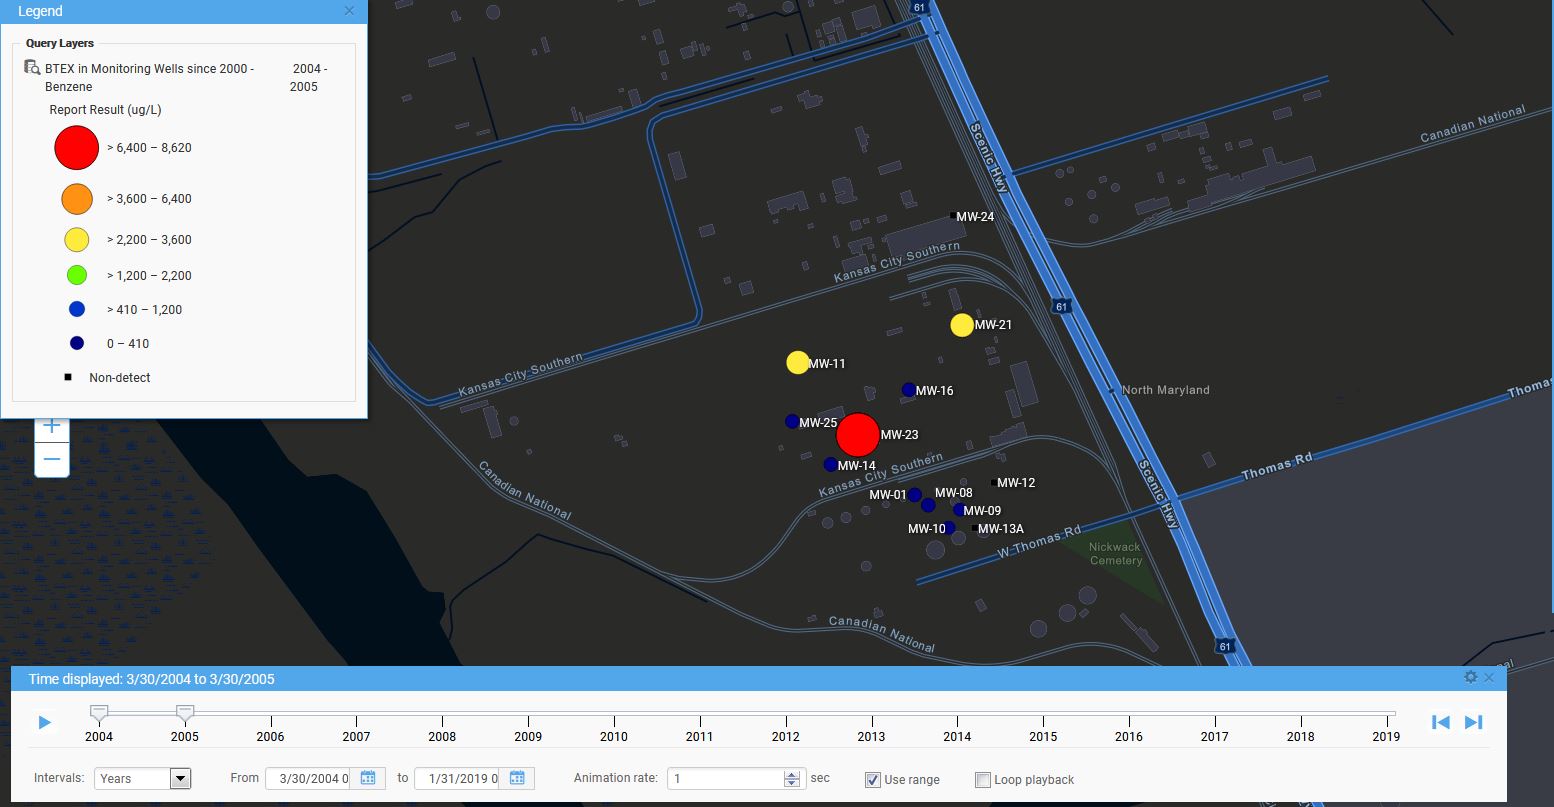
Time slice for a year for a Locus GIS+ query
Starting the time slider runs through the yearly time slices. As time passes in this example, hot spots come and go, with a general downward trend towards no benzene detections. In the last year, 2018-2019, there is a slight increase in concentrations. Watching the changing concentrations over time presents a clear picture of how benzene is manifesting in the groundwater wells at the site.
GIS+ time slider in action
While displaying time in maps has always been a challenge, the use of automation in GIS lets users get a better understanding of temporal trends in their spatial data. Locus continues to bring new analysis tools to their GIS+ system to support time data in their environmental applications.
Time slice for a Locus GIS+ query
Locus GIS+ features all of the functionality you love in EIM’s classic Google Maps GIS for environmental management—integrated with the powerful cartography, interoperability, & smart-mapping features of Esri’s ArcGIS platform!
Learn more about Locus’ GIS solutions.
Dr. Pierce manages a team of programmers tasked with development and implementation of Locus’ EIM application, which lets users manage their environmental data in the cloud using Software-as-a-Service technology. Dr. Pierce is also directly responsible for research and development of Locus’ GIS (geographic information systems) and visualization tools for mapping analytical and subsurface data. Dr. Pierce earned his GIS Professional (GISP) certification in 2010.
Mobile apps for water and wastewater operation and maintenance (O&M) activities have been around for some time now. Most users are familiar with the benefits such as instant data collection and access to reference information for better, more reliable O&M monitoring. However, as new software tools are consistently becoming more powerful and more accessible, that “ground-breaking” mobile app that you purchased five years ago may now be looking a little dated. When you are ready to upgrade, here are some of the features that are the new “must haves”.
For many O&M programs, you may have your own data collection needs that are specific to your facility or industry. Mobile O&M apps now allow you to tailor your input forms to add new data fields, remove unwanted fields, change some of the logic like making certain fields required, and make certain fields tied into established pick lists. Even better, you can match the mobile form to the original paper form, making the transition to mobile simple and intuitive for staff. And, the more the merrier, as modern mobile apps let you have multiple forms on the same app so you have everything you need in one place.
It is not enough to just enter your O&M information into a mobile device. You also want to make sure you are entering correct data. Current O&M mobile tools can check your entry as you enter it and validate against whatever criteria are established for that data. So you make sure that you’re entering a pH reading of 7.2, rather than 72. You can also use configurable pick lists to limit data entry to your specific desired entries and not have to correct misspellings or 16 different ways to say “out of service”. Make sure that pick lists are configurable and can be shared with each of your company’s devices.
You are probably already using your phone to compare prices at your local store. It is amazingly easy to simply scan a product’s barcode and instantly see the best available price locally or online. Since virtually every phone/tablet now has a built-in camera, you can use that to scan barcodes or QR codes to associate data entry with a tagged sampling port or asset. This can save you from possible mismatch errors that can occur when simply selecting from a list or typing in data.
We are starting to use voice recognition technology in our mobile devices to quickly send out text messages. Why not use it for recording inspection/audit comments or field issues? Voice recognition is improving every year, and can provide your comments onto a data collection form much faster than typing and can be especially useful for conditions where gloves are required and typing or stylus input is not practical. Using the phone’s native abilities, take advantage of voice feature to streamline note taking, knowing that you can always fix up any issues back in the office.
Mobile apps should have a summary screen to review your data before sending it back to your database, such as a summary form for all data collected during a shift. And once you do sync your data back to the main database (you have a main database right???), instantly reset the form for the next day data collection event so you are always ready.
Mobile apps that won’t function when there is no connection should be abandoned. You need to be able to collect data no matter the location and the signal strength. Look for mobile apps that function with zero connectivity, and save the data until a signal is found. Not every location at modern water and wastewater facilities has a hot spot, so be prepared with the right app.
We all know the struggle of getting things done with limited staff and without compromising the quality of our work, especially in EHS. Locus Technologies’ Locus Platform offers multiple options to ease the complexity by providing a SaaS platform packed with some nifty apps. Here are some tools in Locus Platform that can help you utilize your workforce much more efficiently:
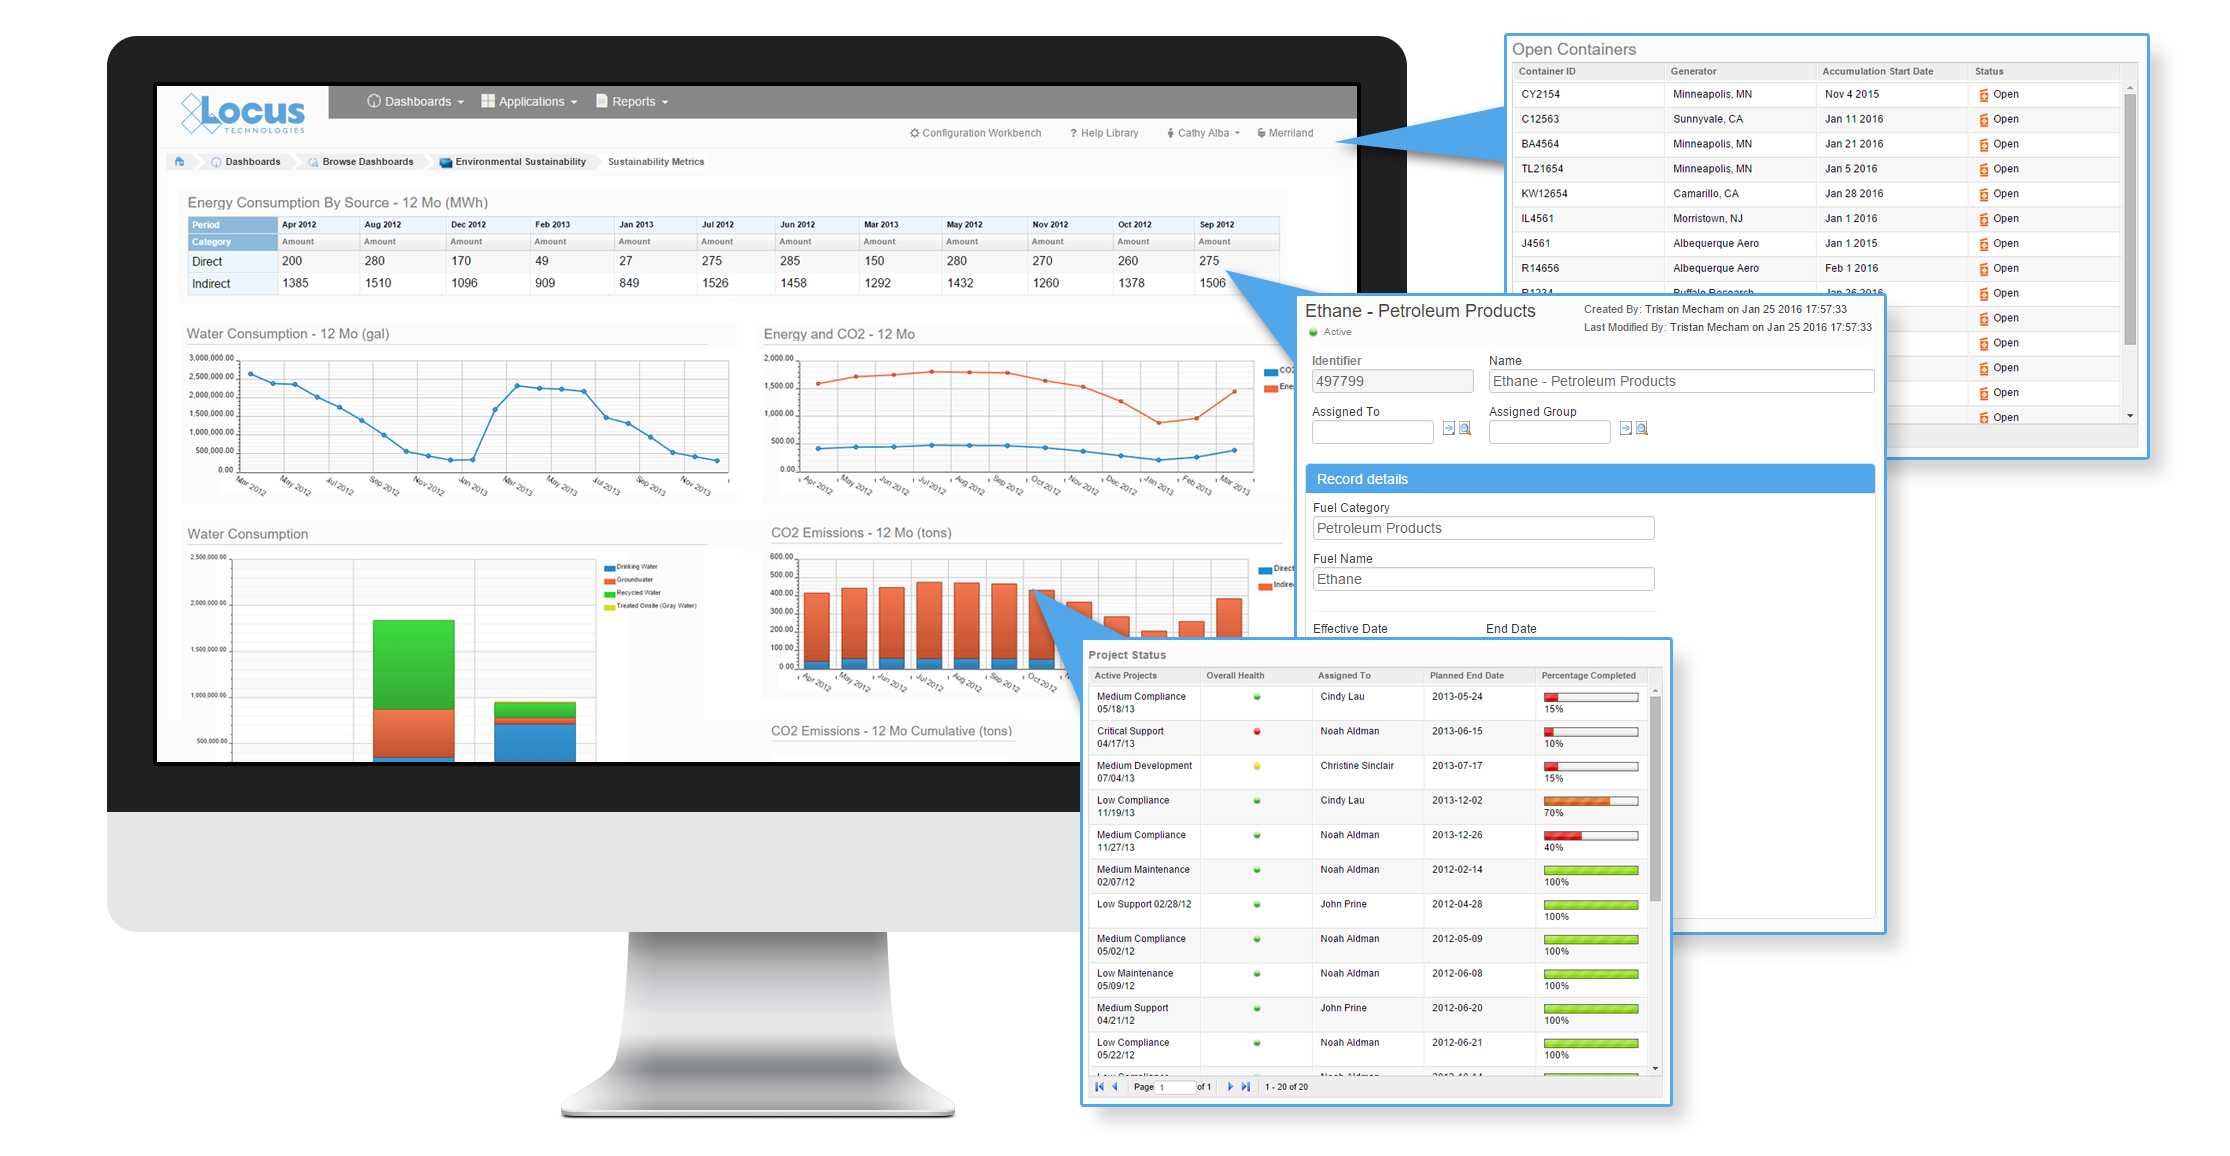
Every software has built-in report and dashboards, but they may not meet all your needs when purchased off the shelf. If you need a new report, chart, or other visualization of your data, it usually incurs a custom software development charge, but not with Locus Platform (LP).
Locus Platform allows you to assemble the information you want in your chosen format (bar or line charts, maps, tables, treemaps, diagrams, etc.) and share your custom dashboards and real-time information/data with your team. In addition, the views and dashboards export to Excel, so you can easily integrate with commonly used tools and further mine the data.
At the enterprise level, powerful dashboards will help you understand the status of each facility based on a matrix you design. With the LPs flexibility, facility information can be automatically populated based on the user credentials, saving your team time and frustration.

Locus Platform’s Sustainability application and calculation engine support simultaneous calculations using multiple methods for various reporting programs including EPA, California ARB, CDP, TCR, DJSI, and others. This allows users to input data only once and utilize it to report to multiple federal, state, and voluntary reporting programs, according to their required format.
Locus Platform will also support direct electronic reporting formats for many reporting programs, so that additional manual transcription and submittal of data are no longer necessary. This is a very powerful tool and a huge advantage to customers in terms of improving efficiency, while reducing costs.
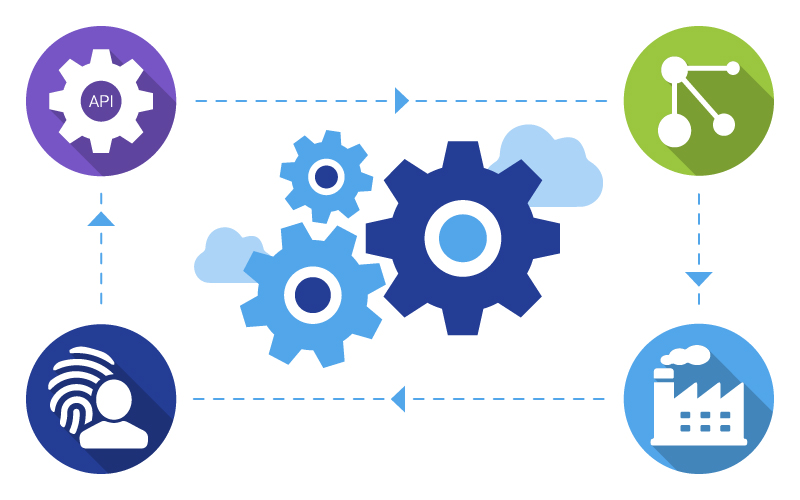
Integration, if done correctly, can save you a great deal of time and headache during some of the most tedious and cumbersome tasks in EHS data management. Locus Platform has built in a unique point and click integration application to enable connection with major databases or third-party systems that have open API (Access privileges). Some integration, database, and communication standards and methods that are supported include: OLE compliance, SOAP, COM, Java, XML, web services, ODBC/ODMA/SQL/Oracle, VIM, and MAPI.
Locus Platform also works well with MS Excel and provides a powerful two-way synchronization allowing users to download parts of the database to Excel, then work, edit, and verify or append data on their local copy of Excel where they have no internet connection. Any revisions they perform to the downloaded data in Excel can be automatically synchronized back to the Locus Platform application. During the process, a complete audit trail will be preserved. This can be a great time saver especially when you are sending large volumes of valid values in a database or if you are migrating any historical data.
Locus’ Mobile application allows you to sync with your server to create data collection profiles on a mobile device, whether it’s your phone or a tablet. It will allow you to click through and enter data on the device even when you are offline. Data validation is performed in real time and is stored locally on the device, once the phone reaches an internet signal, it will sync with your server, and the data will automatically be updated in Locus’ cloud-hosted solution. What’s more, Locus Mobile works seamlessly with both EIM and Locus Platform.
Using Mobile you receive the benefits of data entry directly on the mobile device, with immediate data availability on the cloud when you reach an internet signal. Other advantages of using Locus Mobile include location metadata and mapping integration, bar-code/OR code scanning, voice recognition, and form customization. If you’d like to know more about the Locus Mobile application, check out the Top 10 cool features in Locus Mobile.
Locus has prioritized enhancing its GHG application in Locus Platform to make it easy to manage GHG emission inventory tracking and reporting requirements. Locus Technologies is the only software vendor that is a certified GHG verifier under the State of California’s AB32, and has performed the most GHG verifications in California since 2015.
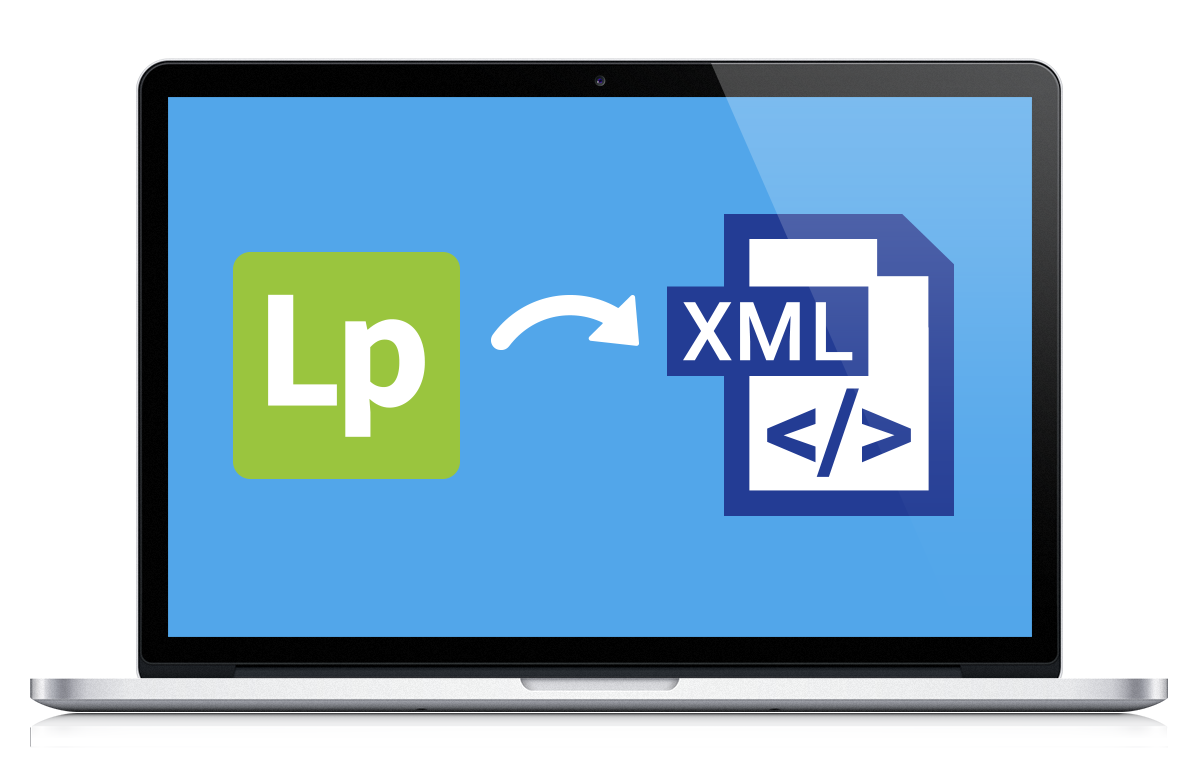
The State and Federal eGGRT web portals are notoriously cumbersome and require a significant amount of your time to input all the required data and generate your report. But with XML support, you can bypass almost the entire data entry process, and complete your submittal within a few minutes. XML reports support many greenhouse gas subparts, including EPA GHG Subparts C, D, W, and NN. And because data entry for EPA and CARB is consolidated in the XML GHG application, it eliminates the need to maintain separate agency spreadsheets and software.
Additional reporting programs are also adding support for XML submittals, such as EPA’s eManifest. This functionality can be a huge time saver for anyone working with these online regulatory reporting tools.
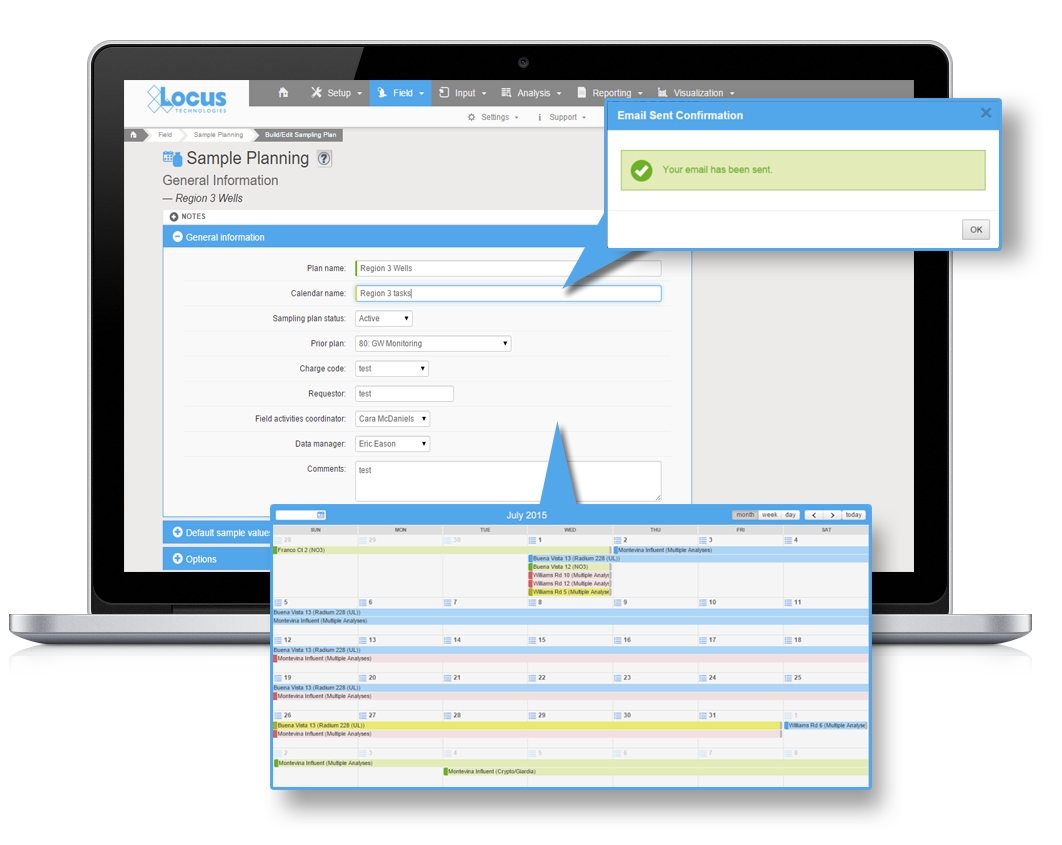
Sample planning can be a valuable and necessary tool for many in highly regulated fields, including water utilities, where adherence to regulatory defined sampling schedules is essential. Moreover, if you have reviewed the drinking water requirements, you know the regulations require complex and variable schedules ranging from monthly samples at routine locations for a set list of parameters to once every five, seven, or nine years at other locations for a completely different list of parameters. Missing a required sampling event can mean fines and public notice to customers.
Other industries face similar complex sampling needs and the financial and reputational impacts can be hefty for missing required samples. So if you are currently an EIM user, or considering an environmental information management system, don’t forget about sample planning components that will save you time and money.
Here are some benefits of Sample Planning that may make you a believer.
Sample Planning in EIM excels in streamlining repetitive sampling, such as required drinking water samples, or quarterly monitoring well samples. Any sampling events with a schedule from daily to once every 10 years can be planned in EIM’s module and reused again and again, even with tweaks to the schedule for the samples to be collected. Imagine the time savings and the simplicity of having your regulatory requirements all lined out for the year and not have to worry about missing required samples. For water utilities, this is especially valuable given the very strict schedules and the public health implications of missing sampling events.
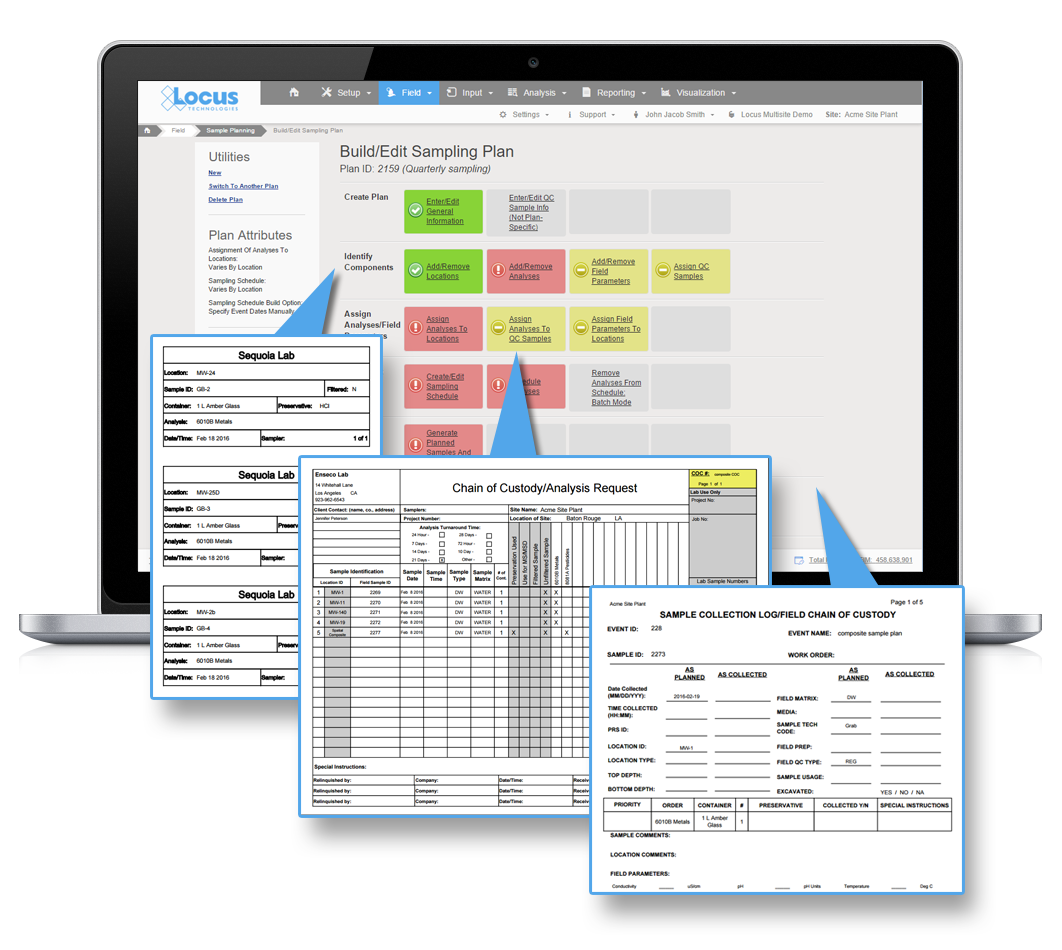
When samples are planned in EIM, it is a few simple clicks of the mouse to generate COCs, work lists, and bottle labels for the field crew. This saves time for the field and office staff, and helps ensure they collect the needed samples and not miss a collection or a field or laboratory parameter. Moreover, higher levels of accuracy and fewer transcription errors are ensured as sample IDs and requested analyses are printed electronically rather than entered by hand.
For customer’s considering using Locus Mobile to streamline their field data collection, Sample Planning is a natural fit. All the samples planned in the Sample Planning module can be delivered directly to Locus Mobile for one or more field staff. You can even have multiple different events sent to the field crew so they can plan ahead in the field. All the collected data is uploaded to EIM in real-time (if service is available) or later (if not) for review and final checks after the field event is concluded. Imagine giving your sampling teams the weekly plan and tracking the progress each day as they sync their data. A handy feature of Locus Mobile, it can remove all the previously collected samples from the plan each day to make your field sampler’s life much simpler.
Larger drinking water utilities will find the integration of Sample Planning and mobile quite appealing, especially with daily sampling by multiple sampling teams and a large number of required routine samples.
 All your required field sample information is already in EIM for your sampling event.
When lab data comes back from the lab, you no longer need to enter in the field sample information, it will already be in EIM.
For drinking water utilities, where you may be sampling daily for chlorine at your sample locations, imagine seeing the results across your distribution system instantly, and ability to see it on a map in near real time. Even better, you can share the results with your operations team with a simple dashboard link.
By using Sample Planning, you will know exactly what samples have and have not been collected. You will also know which ones were collected late, and which ones are yet to be collected. This type of information can help ensure you don’t’ miss required samples, and identify schedule impacts when collection is not going according to plan.
When missed samples are identified, its easy to add to the next day’s sampling and send that information to field teams using the integrated mobile app.
 Gain ability to track receipt of laboratory results with fine precision
For customers that need to track laboratory results down to the method and analyte level, Sample Planning will make that tedious task easy. Therefore, if you ordered an EPA Method 6010C analysis and no result for lead is reported, you will know immediately when the results arrive back from the lab that the deliverable is incomplete. EIM will also tell you when the lab substituted one method for another. You can then decide whether this change is acceptable or not. Because most regulations include a long list of required analytes and acceptable methods, this type of detail is invaluable to help ensure that you remain in compliance.
Trying to review laboratory invoices, especially for large sampling events or complex sampling programs, can be a chore. With EIM’s Sample Planning module, most of the hard work is already done for you. Once you have all your data back, EIM will tell you:
Sorry, no posts matched your criteria