Tag Archive for: Environmental Software

EIM Search Tool – Vlog

[sc_vimeo width=”640″ height=”360″ aspect_ratio=”16:9″ video_id=”814747329″ style=”default” position=”right”]

The EIM platform lets the user perform successful searches through various methods. In all searches, the user does not need to specify if the search term is a menu item, help page, or data entity such as parameter or location. Rather, the search bar determines the most relevant results based on the data currently in EIM.

Locus Technologies President, Wes Hawthorne tells us in this video how useful he finds this feature on the EIM platform.

[sc_button link=”https://www.locustec.com/blog/quick-search-and-natural-language/” text=”Click here to learn more” link_target=”_self” color=”000000″ background_color=”52a6ea”]


Request a demo

Send us your contact information and a Locus representative will be in touch to discuss your organization’s needs and provide an estimate, or set up a free demo of our enterprise environmental software solutions.

    Name

    Company Email

    Phone

    Tell us about your company's needs

    Locus is committed to preserving your privacy.

    Finding the Best Environmental Sampling Tool

    There is a need for most water entities to centralize data, and more easily load, share, analyze, and report data. 
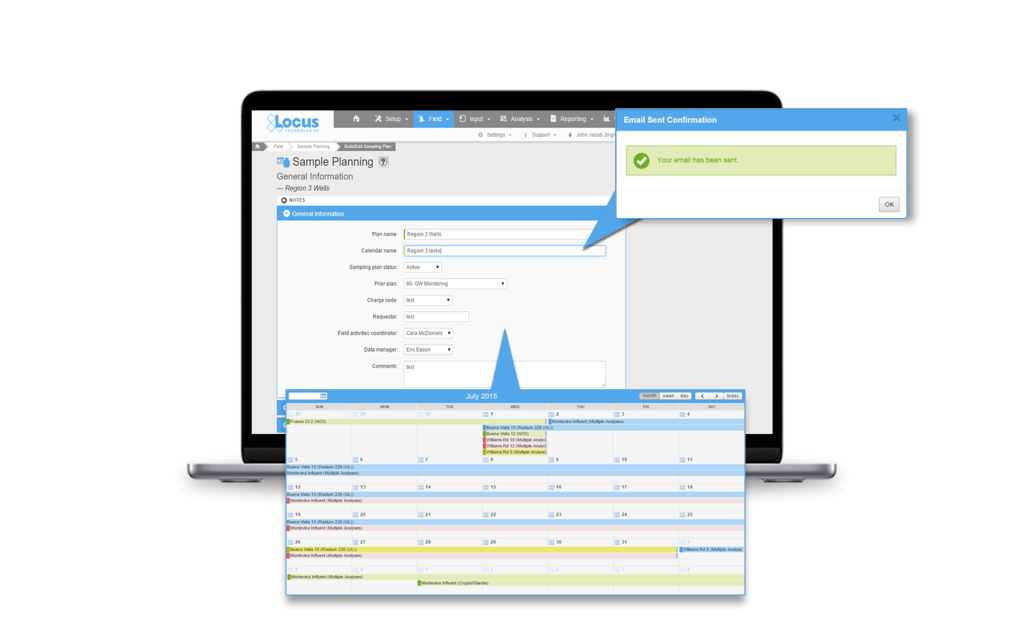
Locus Technologies’ customizable software makes scheduling and collecting routine water samples is made easy by using Locus Mobile and EIM. Below is a list of frequent challenges that customers have encountered during their water sampling process and how they can be solved using the right tools from Locus. or better communications. 

    Challenge 1: Finding a flexible sampling planning tool 

    Planning tools need to allow flexibility in terms of different sampling intervals and date ranges, different field and analytical parameters, and account for location grouping. Using a well-designed application can pull together all of this detailed information and can provide a summary view of the individual samples. A manager can easily view sample status, and whether the sample is complete, in process, or planned.  A well-designed application can also generate the chain of custody (COC), and lab and sample shipping date information and labels per sample, which is a huge time saver. This type of sample tracking detail seemed to be very useful to many conference attendees to help ensure they are in regulatory compliance with required sampling frequencies. A key feature to look for is an application that is flexible enough that it can allow one-time, unplanned sample events such as water main breaks, customer complaints and schedule changes, and can handle complex multi-year routine sampling with ease. As a plus, it’s easy for you or your manager to know where you stand at any time. 

    LocusPlatform_Water_Sampling

    Challenge 2: Eliminating data entry errors caused by hand data entry 

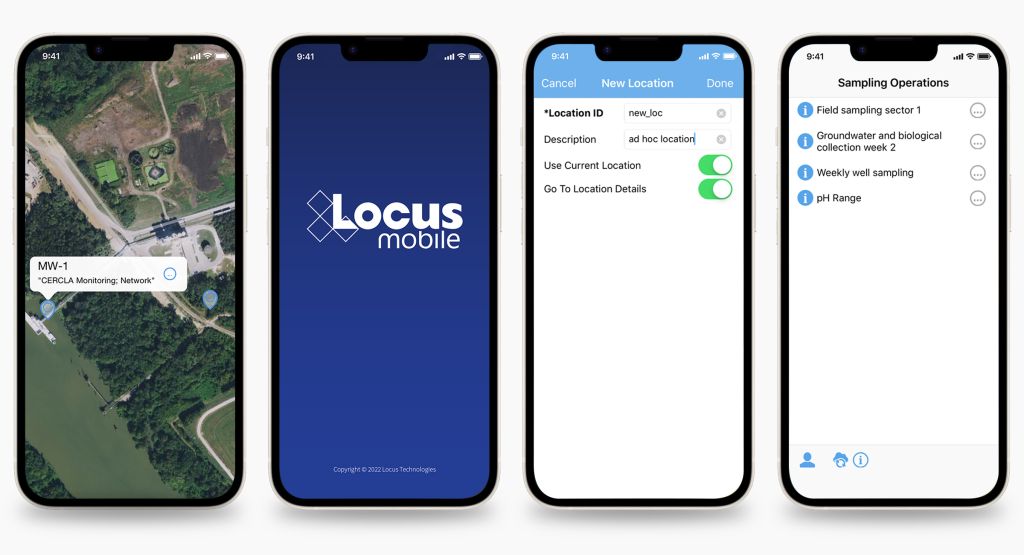
    Data entry errors and fixing bad data when it was transcribed from field notes to Excel or other programs is a persistent problem with the old way of doing things.  Your company needs a better way to streamline the error prone data collection process.  Many clients are interested in an alternative to the pencil/paper/clipboard method and had goals to move to tablet or smartphone for data collection.  The universal wish list for mobile field applications included: 

    • Easy to use and set up 
    • Built in data validation to catch data entry errors at the source 
    • Direct upload to a data system so the end of the day all the daily samples were in the system with the push of a button 
    • Prepopulating locations especially for large water systems 
    • Complete field instructions for samplers on what to collect and where to collect it to eliminate missed samples 
    • Smart tracking to know on a daily/weekly basis, what samples were collected and what samples were still outstanding 
    • Integrated with sample planning tools (See challenge 1) to automate the sampling instructions and track the data collection activities vs plan 

    Locus-Mobile-Water-Sampling

    Challenge 3: Getting the most out of their software, especially regarding updates 

    Everyone is aware that software updates all the time.  Sometimes its security enhancements and sometime feature enhancements or bug fixes.  A source of frustration is getting a software update and not knowing what was updated or how best to incorporate a new feature/enhancement into their established process.  There was also concern for impact to an established routine with field crews that were used to the existing way of doing things. Even if a functionality improved the workflow, enhancements are only valuable to a user if they understand how to use them and how to incorporate them into their existing process. 

    Some suggestions from the attendees included:
    • Concurrent documentation updates with software updates 
    • “Quick start” guides for new functionality 
    • Online training on the new functionality with recording for later viewing 
    • Heads up on what is coming in the next several months so they can do strategic planning (sharing the roadmap) 
    • Sandbox environment to test the enhancements before going in production so they can plan how to incorporate the features into their process and train field crews 

    Mobile applications, which appear very simple to the users, are in reality complex software and require careful integration with the receiving database for a range of complex use cases.  This makes rolling out new mobile features challenging for both the developers and the users.  Enhanced customer/developer communication along with a sandbox environment can go a long way towards solving some of the inherent issues with rapid innovations and updates associated with cloud and mobile software. 

    Locus-Technologies-Training-and-Support

    Software tools are available and can solve a lot of the common data management challenges, but know what you want, know the problem you are trying to solve and know it will take some time and effort, but the end result will significantly improve your business processes. Though these challenges are present when choosing a software, Locus Technologies has the experts to help you hurdle the challenges to find the solution that is best for your business. 

    Request a demo

    Send us your contact information and a Locus representative will be in touch to discuss your organization’s needs and provide an estimate, or set up a free demo of our enterprise environmental software solutions.

      Name

      Company Email

      Phone

      Tell us about your company's needs

      Locus is committed to preserving your privacy.

      Simplify Your Water Tracking with Locus Platform

      Tracking your data is made easy within our software as a service (SaaS), Locus Platform (LP). Your company can take advantage of LP’s mobile-aware browser functions, giving you the capability to do all your fieldwork with your existing phones or tablets.   When cellular connections are unavailable or unreliable, Locus also has a Mobile app which supports the offline capabilities you need to keep your workflow going. 

      Regardless of your mobile approach, each mobile form can be easily configured to capture the data you require in the field such as photos and the sampling results.  

      Along with easy mobile data collection, Locus Platform can help you to:
      • Track and report your daily results, such as chlorine, nitrite and temperature to water treatment operators, for real time adjustments.
      • Monitor lab results from routine sampling. 
      • Flag out of range data in real time for notifications or data entry corrections. 
      • Analyze data geospatially to understand situations impacting water quality. 
      • Report average monthly chlorine results. 
      • Track water quality complaints and illicit discharges overtime.  
      • Generate Nitrification Reports.  
      • Prepare Monthly Flushing reports. 
      Of course, those are not the limits of Locus Platform. Our software can also help you to: 
      • Track and manage all types of tasks and regulatory commitments. 
      • Track any type of permit and associated requirements. 
      • Generate notifications for defined events, such as data entered above limits. 
      • Produce PDF and Excel reports for regulators and customers. 
      • Keep all your information in an easy-to-use secure system and basically future proof your program. 

      Whether in the office, or out in the field, Locus Technologies is with you every step of the way during the tracking process. Contact us to find your solution. 

      Request a demo

      Send us your contact information and a Locus representative will be in touch to discuss your organization’s needs and provide an estimate, or set up a free demo of our enterprise environmental software solutions.

        Name

        Company Email

        Phone

        Tell us about your company's needs

        Locus is committed to preserving your privacy.

        Locus at 25 Years: How Did We Fund Locus?

        Many in our material-driven culture, particularly in Silicon Valley, assign more excellent value to companies based on how much venture capital or private equity money they have raised or how quickly their companies have grown after initial seeding, and less to founders who bootstrapped their companies from nothing and after that, positioned them for long and steady growth. Although the term means different things in different areas of knowledge, in entrepreneurship, bootstrapping is the process of starting a business with little or no external funding.

        Locus has proven that how much funding a startup company has raised or how quickly it has grown are the wrong metrics to measure a company’s success, particularly in the arena of environmental compliance and data management. We bootstrapped Locus in 1997 and, without outside capital, created a new industry at the intersection of two significant trends before either was a trend: the growth in Internet usage and the growth in the acquisition, storage, and analysis of environmental information. Locus not only defined and pioneered this new space of environmental information management in the cloud but also became an industry leader leaving behind many well-funded startups with “borrowed ideas” and established ERP software companies. At every startup stage, some actions are “right” for the startup to maximize return on time, money, and effort. Fortunately, Locus took the necessary steps that allowed it to weather several recessions and market downfalls.

        While bootstrapping techniques are not just limited to funding, they also apply to how companies are run. By bootstrapping Locus, we created a built-to-last, slow-burn startup that was focused on the singular goal of building a cloud-based environmental data information management system and avoided expending effort on expanding applications that the market did not need or those that we were too dependent on external help. Bootstrapping provided Locus with a strategic roadmap for achieving sustainability through customer funding (i.e., partnering with customers)—if it is essential for Locus, it must be necessary for the customer first. If it is vital for customers, they must pay for a portion of it and have “skin in the game. “We don’t build applications to attract customers. We attract customers with our ideas to build applications together” became Locus’s modus operandi: Locus was born and built with this simple philosophy.

        Once Locus had built a solid customer base, Locus encouraged its paying customers to become consultants who defined the Locus product map. This strategy resulted in a rapid evolutionary expansion of Locus’ software in the marketplace. Crowdsourcing product development from customers with real-world problems has become the cornerstone of Locus’ success in the market.

        Let us digress here to comment on what it takes to build an environmental database management system. In the 1990s, when Dr. Duplan was leading the development of a client-server database for his then-employer (there were no internet-based databases back then), he and others now at Locus attended a trade show where a product called Oracle Environmental or something like that was being marketed. Yes, this is the same Oracle that is now one of the largest software companies in the world, with a market cap in the hundreds of billions, revenues in the tens of billions, profits in the billions, and over 130,000 employees.

        This small group of engineers and scientists wondered how they could compete against a growing behemoth like Oracle with all its programmers and financial resources. They listened to a marketing spiel and took the system for a test drive at Oracle’s booth. Their worries almost immediately vanished. What they saw was characterized by all as a system that was “a mile wide and an inch deep.” It was designed and developed by individuals with no field experience, little or no engineering or scientific expertise, and little understanding of environmental data and data flow. It claimed to touch on many different types of data (which it did) but owing to its lack of depth, it clearly could not work in the real world. Sure enough, the product was gone within a few years.

        In contrast, EIM has been designed and developed by individuals with advanced degrees in civil and environmental engineering, water resources, geology, chemistry, and biology. All who are not solely computer programmers have spent serious time in the field, have overseen the drilling of boreholes and wells, planned and collected samples, verified and validated analytical data, and have created data reports for internal, external entities. These individuals are very cognizant of the vagaries of environmental data.

        When giving demos of the system, we are often peppered with questions such as:

        • How do you calculate the groundwater elevation in a well that has some saline in the groundwater?
        • Can your system handle different units when reporting or calculating statistical measures?
        • Does your system have a means of accommodating dilutions when validating your data?
        • How does your system handle synonyms for parameters or alternate location names?
        • Does your system store TEFs?
        • Does your validation module assign qualifiers, and if so, how?
        • Can your system accommodate changes in well reference elevations?
        • Is your system’s data validation module based on SDGs, analysis lots, sample prep lots, or a combination?
        • To what extent and level are your systems capable of tracking a sample from planning to the grave?

        All these questions make sense to us, and we have an answer to them. Our deep domain expertise in such matters, coupled with our backgrounds in engineering and the sciences and our relevant work experience, has enabled us to work with our customers to build ground-breaking tools and modules for our products that work for all companies.

        While other environmental software companies have come and gone—often after getting much press, only to fizzle out on broken promises and dried-up funding, Locus has never wavered from its path to provide environmental data management services to corporations and government agencies. Despite the absence of a flashy PR machine and VC or PE funding, Locus has continued to be a profitable, independent, and visionary organization, which is now considered one of the top environmental software companies in the world.


        This is the fourth post highlighting the evolution of Locus Technologies over the past 25 years. The first three can be found here and here, and here. This series continues with Locus at 25 Years: Blockchain for Emissions Management.

        Locus at 25 Years: Locus Platform, Multitenant Architecture, the Secret of our Success

        Locus Platform

        Locus Platform is the preeminent on-demand application development platform for EHS, ESG, and beyond, supporting many organizations and government institutions. Individual enterprises and governmental organizations trust Locus’s SaaS Platform to deliver robust, reliable, Internet-scale applications. The foundation of Locus Platform (LP) is a metadata-driven software architecture that enables multitenant applications. This unique technology, a significant differentiator between Locus and its competitors, makes the Locus Platform fast, scalable, and secure for any application. What do we mean by metadata-driven? If you look up metadata-driven development on the web, you find the following:  

        “The metadata-driven model for building applications allows an Enterprise to deploy multiple applications on the same hosting infrastructure easily. Since multiple applications share the same Designer and Rendering Engine, the only difference is the metadata created uniquely for each application.” 

        Why Multitenancy is Better than Single

        The Triumph of the Multitenant SaaS model, which Locus brings to the EHS/ESG industry.

        In the case of LP, it is the Designer and Rendering Engine cited in this definition. All LP customers share this engine and use it to create their custom applications. These applications may consist of dashboards, forms to enter data, plots, reports, and so forth, all designed to meet a set of requirements. Instructions (metadata) stored in a database tell the engine how to build these entities, the total of which form a client-designed application.  

        Locus Platform Evolution

        Locus Platform’s evolution to the leading EHS and ESG Platform.

        History has shown that every so often, incremental advances in technology and changes in business models create significant paradigm shifts in the way software applications are designed, built, and delivered to end-users. The invention of personal computers (PCs), computer networking, and graphical user interfaces (UIs) gave rise to the adoption of client/server applications over expensive, inflexible, character-mode mainframe applications. And today, reliable broadband Internet access, service-oriented architectures (SOAs), and the cost inefficiencies of managing dedicated on-premises applications are driving a transition toward the delivery of decomposable, collected, shared, Web-based services called software as a service (SaaS). 

        With every paradigm shift comes a new set of technical challenges, and SaaS is no different. Existing application frameworks are not designed to address the unique needs of SaaS. This void has given rise to another new paradigm shift, namely platform as a service (PaaS). Hosted application platforms are managed environments specifically designed to meet the unique challenges of building SaaS applications and deliver them more cost-efficiently. 

        The focus of Locus Platform is multitenancy, a fundamental design approach that dramatically improves the manageability of EHS and ESG SaaS applications.  Locus Platform is the world’s first PaaS built from scratch to take advantage of the latest software developments for building EHS, ESG, sustainability, and other applications. Locus Platform delivers turnkey multitenancy for Internet-scale applications.  

        Locus Multitenancy

        The Benefits of Multitenancy

        A single shared software and hardware stack across all customers.

        The same applies to many different sets of users; all Locus’ LP applications are multitenant rather than single-tenant. Whereas a traditional single-tenant application requires a dedicated group of resources to fulfill the needs of just one organization, a multitenant application can satisfy the needs of multiple tenants (companies or departments within a company, etc.) using the hardware resources and staff needed to manage just a single software instance. A multitenant application cost-efficiently shares a single stack of resources to satisfy the needs of multiple organizations. 

        Single Tenancy

        Single-tenant apps are expensive for the vendor and the customer.

        Tenants using a multitenant service operate in virtual isolation: Organizations can use and customize an application as though they each have a separate instance. Yet, their data and customizations remain secure and insulated from the activity of all other tenants. The single application instance effectively morphs at runtime for any particular tenant at any given time. 

        The Waste of Single Tenancy

        Single-tenant apps create waste

        Multitenancy is an architectural approach that pays dividends to application providers (Locus) and users (Locus customers). Operating just one application instance for multiple organizations yields tremendous economy of scale for the provider. Only one set of hardware resources is necessary to meet the needs of all users, a relatively small, experienced administrative staff can efficiently manage only one stack of software and hardware, and developers can build and support a single code base on just one platform (operating system, database, etc.) rather than many. The economics afforded by multitenancy allows the application provider to, in turn, offer the service at a lower cost to customers—everyone involved wins. 

        Some attractive side benefits of multitenancy are improved quality, user satisfaction, and customer retention. Unlike single-tenant applications, which are isolated silos deployed outside the reach of the application provider, a multitenant application is one large community that the provider itself hosts. This design shift lets the provider gather operational information from the collective user population (which queries respond slowly, what errors happen, etc.) and make frequent, incremental improvements to the service that benefits the entire user community at once. 

        Two additional benefits of a multitenant platform-based approach are collaboration and integration. Because all users run all applications in one space, it is easy to allow any user of any application varied access to specific data sets. This capability simplifies the effort necessary to integrate related applications and the data they manage.  

        Gartner Chart Showing Locus Technologies

        Gartner recognized the power of the Locus Platform in their early research.


        This is the third post highlighting the evolution of Locus Technologies over the past 25 years. The first two can be found here and here. This series continues with Locus at 25 Years: How did we fund Locus?

        Locus at 25 Years: Locus EIM and the Triumph of the SaaS Model

        Locus EIM

        How did Locus succeed in deploying Internet-based products and services in the environmental data sector? After several years of building and testing its first web-based systems (EIM) in the late 1990s, Locus began to market its product to organizations seeking to replace their home-grown and silo systems with a more centralized, user-friendly approach. Such companies were typically looking for strategies that eliminated their need to deploy hated and costly version updates while at the same time improving data access and delivering significant savings.

        Several companies immediately saw the benefit of EIM and became early adopters of Locus’s innovative technology. Most of these companies still use EIM and are close to their 20th anniversary as a Locus client. For many years after these early adoptions, Locus enjoyed steady but not explosive growth in EIM usage.

        Triumph of the SaaS Model

        E. M. Roger’s Diffusion of Innovation (DOI) Theory has much to offer in explaining the pattern of growth in EIM’s adoption. In the early years of innovative and disruptive technology, a few companies are what he labels innovators and early adopters. These are ones, small in number, that are willing to take a risk, that is aware of the need to make a change, and that are comfortable in adopting innovative ideas. The vast majority, according to Rogers, do not fall into one of these categories. Instead, they fall into one of the following groups: early majority, late majority, and laggards. As the adoption rate grows, there is a point at which innovation reaches critical mass. In his 1991 book “Crossing the Chasm,” Geoffrey Moore theorizes that this point lies at the boundary between the early adopters and the early majority. This tipping point between niche appeal and mass (self-sustained) adoption is simply known as “the chasm.”

        Rogers identifies the following factors that influence the adoption of an innovation:

        1. Relative Advantage – The degree to which an innovation is seen as better than the idea, program, or product it replaces.
        2. Compatibility – How consistent the innovation is with the potential adopters’ values, experiences, and needs.
        3. Complexity – How difficult innovation is to understand and use.
        4. Trialability –  The extent to which the innovation can be tested or experimented with before a commitment to adoption.
        5. Observability – The extent to which the innovation provides tangible results.

        In its early years of marketing EIM, some of these factors probably considered whether EIM was accepted or not by potential clients. Our early adopters were fed up with their data stored in various incompatible silo systems to which only a few had access. They appreciated EIM’s organization, the lack of need to manage updates, and the ability to test the design on the web using a demonstration database that Locus had set up. When no sale could be made, other factors not listed by Rogers or Moore were often involved. In several cases, organizations looking to replace their environmental software had budgets for the initial purchase or licensing of a system but had insufficient monies allocated for recurring costs, as with Locus’s subscription model. One such client was so enamored with EIM that it asked if it could have the system for free after the first year. Another hurdle that Locus came up against was the unwillingness of clients at the user level to adopt an approach that could eliminate their co-workers’ jobs in their IT departments. But the most significant barriers that Locus came up against revolved around organizations’ security concerns regarding the placement of their data in the cloud.

        LocusFocus

        One of the earliest versions of EIM

        Oh, how so much has changed in the intervening years! The RFPs that Locus receives these days explicitly call out for a web-based system or, much less often, express no preference for a web-based or client-server system. We believe this change in attitudes toward SaaS applications has many root causes. Individuals now routinely do their banking over the web. They store their files in Dropbox and their photos on sites like Google Photos or Apple and Amazon Clouds. They freely allow vendors to store their credit card information in the cloud to avoid entering this information anew every time they visit a site. No one who keeps track of developments in the IT world can be oblivious to the explosive growth of Amazon Web Services (AWS), Salesforce, and Microsoft’s Azure. We believe most people now have more faith in the storage and backup of their files on the web than if they were to assume these tasks independently.

        Locus EIM

        An early update to EIM software

        Changes have also occurred in the attitudes of IT departments. The adoption of SaaS applications removes the need to perform system updates or the installation of new versions on local computers. Instead, for systems like EIM, updates only need to be completed by the vendor, and these take place at off-hours or at announced times. This saves money and eliminates headaches. A particularly nasty aspect of local, client-server systems is the often experienced nightmare when installing an updated version of one application causes failures in others that are called by this application. None of these problems typically occur with SaaS applications. In the case of EIM, all third-party applications used by it run in the cloud and are well tested by Locus before these updates go live.

        Locus EIM

        Locus EIM continues to become more streamlined and user friendly over the years.

        Yet another factor has driven potential clients in the direction of SaaS applications, namely, search. Initially, Locus was primarily focused on developing software tools for environmental cleanups, monitoring, and mitigation efforts. Such efforts typically involved (1) tracking vast amounts of data to demonstrate progress in the cleanup of dangerous substances at a site and (2) the increased automation of data checking and reporting to regulatory agencies.

        Locus EIM

        Locus EIM handles all types of environmental data.

        Before systems like EIM were introduced, most data tracking relied on inefficient spreadsheets and other manual processes. Once a mitigation project was completed, the data collected by the investigative and remediation firms remained scattered and stored in their files, spreadsheets, or local databases. In essence, the data was buried away and was not used or available to assess the impacts of future mitigation efforts and activities or to reduce ongoing operational costs. Potential opportunities to avoid additional sampling and collection of similar data were likely hidden amongst these early data “storehouses,” yet few were aware of this. The result was that no data mining was taking place or possible.

        Locus EIM in 2022

        Locus EIM in 2022

        The early development of EIM took place while searches on Google were relatively infrequent (see years 1999-2003 below). Currently, Google processes 3.5 billion searches a day and 1.2 trillion searches per year. Before web-based searches became possible, companies that hired consulting firms to manage their environmental data had to submit a request such as “Tell me the historical concentrations of Benzene from 1990 to the most recent sampling date in Wells MW-1 through MW-10.” An employee at the firm would then have to locate and review a report or spreadsheet or perform a search for the requested data if the firm had its database. The results would then be transmitted to the company in some manner. Such a request need not necessarily come from the company but perhaps from another consulting firm with unique expertise. These search and retrieval activities translated into prohibitive costs and delays for the company that owned the site.

        Google Search Growth

        Google Searches by Year

        Over the last few decades, everyone has become dependent on and addicted to web searching. Site managers expect to be able to perform their searches, but honestly, these are less frequent than we would have expected. What has changed are managers’ expectations. They hope to get responses to requests like those we have imagined above in a matter of minutes or hours, not days. They may not even expect a bill for such work. The bottom line is that the power of search on the web predisposes many companies to prefer to store their data in the cloud rather than on a spreadsheet or in their consultant’s local, inaccessible system.

        The world has changed since EIM was first deployed, and as such, many more applications are now on the path, that Locus embarked on some 20 years ago. Today, Locus is the world leader in managing on-demand environmental information. Few potential customers question the merits of Locus’s approach and its built systems. In short, the software world has caught up with Locus. EIM and LP have revolutionized how environmental data is stored, accessed, managed, and reported. Locus’ SaaS applications have long been ahead of the curve in helping private, and public organizations manage their environmental data and turn their environmental data management into a competitive advantage in their operating models.

        We refer to the competitive advantages of improved data quality and flow and lower operating costs. EIM’s Electronic Data Deliverable (EDD) module allows for the upload of thousands of laboratory results in a few minutes. Over 60 automated checks are performed on each reported result. Comprehensive studies conducted by two of our larger clients show savings in the millions gained from the adoption of EIM’s electronic data verification and validation modules and the ability of labs to load their EDDs directly into a staging area in the system. The use of such tools reduces much of the tedium of manual data checking and, at the same time, results both in the elimination of manually introduced errors and the reduction of throughput times (from sampling to data reporting and analysis). In short, the adoption of our systems has become a win-win for companies and their data managers alike.


        This is the second post highlighting the evolution of Locus Technologies over the past 25 years. The first can be found here. This series continues with Locus at 25 Years: Locus Platform, Multitenant Architecture, the Secret of our Success.

        Celebrating 55 years of GIS-based EHS data insights

        GIS Day was established in 1999 to showcase the power and flexibility of geographical information systems (GIS).  In celebration of the 55th birthday of GIS, we’ve compiled a brief history of the evolution of this powerful technology, with a special focus on how it can be used in EHS applications to make environmental management easier.

        Not only is GIS more powerful than ever before—it is also vastly more accessible.  Anyone with Internet access can create custom maps based on publicly available data, from real-time traffic conditions to environmental risk factors, to local shark sightings. Software developers, even those at small companies or startups, now have access to APIs for integrating advanced GIS tools and functionality into their programs.

        Origins of GIS

        Before you can understand where GIS is today, it helps to know how it started out. This year is the 55th anniversary of the work done by Roger Tomlinson in 1962 with the Canada Land Inventory. We consider this the birth of GIS, and Mr. Tomlinson has been called the “father of GIS”.

        The original GIS used computers and digitalization to “unlock” the data in paper maps, making it possible to combine data from multiple maps and perform spatial analyses. For example, in the image shown here from the Canada Land Inventory GIS, farms in Ontario are classified by revenue to map farm performance.

        An early GIS system from the Canada Land Inventory, in Data for Decisions, 1967

        An early GIS system from the Canada Land Inventory, in Data for Decisions, 1967
        Photo: Mbfleming. “Data for Decisions (1967).” YouTube, 12 Aug. 2007, https://youtu.be/ryWcq7Dv4jE.
          Part 1, Part 2, Part 3

        In 1969, Jack Dangermond founded Esri, which became the maker of, arguably, the world’s most popular commercial GIS software. Esri’s first commercial GIS, ARC/INFO, was released in 1982, and the simpler ArcView program followed in 1991. Many of today’s most skilled GIS software developers can trace their roots back to this original GIS software.

        Back then, GIS work required expensive software packages installed on personal computers or large mainframe systems. There was no Google Maps; all map data had to be manually loaded into your software. Getting useful data into a GIS usually required extensive file manipulation and expertise in coordinate systems, projections, and geodesy.

        While the government, utility, and resource management sectors used GIS heavily, there was not much consumer or personal use of GIS. Early GIS professionals spent much of their time digitizing paper maps by hand or trying to figure out why the map data loaded into a GIS was not lining up properly with an aerial photo. This may sound familiar to those who have been in the environmental industry for awhile.

        Esri’s ArcView 3.2 for desktop computers (from the 1990s)

        Esri’s ArcView 3.2 for desktop computers (from the 1990s)
        https://map.sdsu.edu/geog583/lecture/Unit-3.htm

        The Google Revolution

        How much has changed since those early days! After the release of OpenStreetMap in 2004, Google Maps and Google Earth in 2005, and Google Street View in 2007, GIS has been on an unstoppable journey—from only being used by dedicated GIS professionals on large computers in specific workplaces, to be accessible to anyone with an internet browser or a smartphone. High-quality map data and images—often the most expensive item in a GIS project in the 1990’s — are now practically free.

        Just think how revolutionary it is that anyone can have instant access to detailed satellite images and road maps of almost anywhere on Earth! Not only can you perform such mundane tasks as finding the fastest route between two cities or locating your favorite coffee shop while on vacation—you can also see live traffic conditions for cities across the globe; view aerial images of countries you have never visited; track waste drums around your facility; and get street level views of exotic places. Back in 1991, such widespread access to free map data would have seemed like something straight out of science fiction.

        Traffic conditions in London, 3:30 pm 10/16/2017, from Google Maps

        Traffic conditions in London, 3:30 pm 10/16/2017, from Google Maps

        South Base Camp, Mount Everest, Google StreetView

        South Base Camp, Mount Everest, Google StreetView

        Mashups in the cloud

        Obviously, the amount of spatial data needed to provide detailed coverage of the entire globe is far too large to be stored on one laptop or phone. Instead, the data is distributed across many servers “in the cloud.” Back in the 1990s, everything for one GIS system (data, processing engine, user interface) needed to be in the same physical place—usually one hard drive or server. Now, thanks to the internet and cloud computing, the data can be separate from the software, creating “distributed” GIS.

        The combination of freely available data with distributed GIS and the power of smart phones has led us to the age of “neogeography”—in which anyone (with some technical knowledge) can contribute to online maps, or host their maps with data relevant to their personal or professional needs. GIS no longer requires expensive software or cartographical expertise; now, even casual users can create maps linking multiple data sources, all in the cloud.

        Google’s MyMaps is an example of a tool for easily making your maps. Maps can range from the playful, such as locations of “Pokemon nests,” to the serious, such as wildfire conditions.

        These online maps can be updated in real time (unlike paper maps) and therefore kept current with actual conditions. Such immediate response is instrumental in emergency management, where conditions can change rapidly, and both first responders and the public need access to the latest data.

        Map showing wildfire and traffic conditions in northern California, 10/16/2017

        Map showing wildfire and traffic conditions in northern California, 10/16/2017
        https://google.org/crisismap/us-wildfires

        Furthermore, software programmers have created online GIS tools that let non-coders create their maps. These tools push the boundaries of distributed GIS even further by putting the processing engine in the cloud with the data. Only the user interface runs locally for a given user. During this period of GIS history, it became easy to create “mashups” for viewing different types of disparate data at once, such as natural hazard risks near offices, pizza stores near one’s neighborhood, EPA Superfund sites near one’s home, property lines, flood plains, landslide vulnerability, and wildfire risk.

        Floodplain data for Buncombe County, NC

        Floodplain data for Buncombe County, NC
        https://buncombe-risk-tool.nemac.org

        Programming GIS with APIs

        Another significant advance in GIS technology is the ability to integrate or include advanced GIS tools and features in other computer programs. Companies such as Google and Esri have provided toolkits (called APIs, or application programming interfaces) that let coders access GIS data and functions inside their programs. While neogeography shows the power of personal maps created by the untrained public, computer programmers can use APIs to create some very sophisticated online GIS tools aimed at specific professionals or the public.

        One example is the publicly-available Intellus application that Locus Technologies developed and hosts for the US Department of Energy’s Los Alamos National Laboratory. It uses an Esri API and distributed GIS to provide access to aerial images and many decades of environmental monitoring data for the Los Alamos, NM area. Users can make maps showing chemical concentrations near their home or workplace, and they can perform powerful spatial searches (e.g., “find all samples taken within one mile of my house in the last year”). The results can be color-coded based on concentration values to identify “hot spots”.

        Map from Intellus showing Tritium concentrations near a specified location

        Map from Intellus showing Tritium concentrations near a specified location
        https://www.intellusnmdata.com

        Another example of more sophisticated forms of analysis is integration of GIS with environmental databases. Many government facilities and private vendors incorporate GIS with online data systems to let public users evaluate all types of information they find relevant.

        For example, contour lines can be generated on a map showing constant values of groundwater elevation, which is useful for determining water flow below ground. With such powerful spatial tools in the cloud, any facility manager or scientist can easily create and share maps that provide insight into data trends and patterns at their site.

        Groundwater contour map

        Groundwater contour map where each line is a 10 ft. interval, from the Locus EIM system

        Other examples include monitoring air emissions at monitoring sites (like US EPA’s AirData Air Quality Monitors, shown below) and actual stream conditions from the USGS (also shown below).

        Screen capture of air quality data from US EPA AirData GIS app

        Screenshot from US EPA AirData Air Quality Monitors interactive GIS mapping platform, showing Long Beach, California


        Screen capture of USGS National Water Information System interactive GIS map tool

        Screen capture of USGS National Water Information System interactive GIS map tool, showing a site in Mountain View, California

        There’s a (map) app for that

        One particularly exciting aspect of GIS today is the ability to use GIS on a smartphone or tablet. The GIS APIs mentioned above usually have versions for mobile devices, as well as for browsers. Programmers have taken advantage of these mobile APIs, along with freely available map data from the cloud, to create apps that seamlessly embed maps into the user experience. By using a smartphone’s ability to pinpoint your current latitude and longitude, these apps can create personalized maps based on your actual location.

        A search in the Apple AppStore for “map” returns thousands of apps with map components. Some of these apps put maps front-and-center for traditional navigation, whether by car (Waze, MapQuest, Google), public transit (New York Subway MTA Map, London Tube Map), or on foot (Runkeeper, Map My Run, AllTrails). Other apps use maps in a supporting role to allow users to find nearby places; for example, banking apps usually have a map to show branches near your current location.

        What’s really exciting are the apps that allow users to enter data themselves via a map interface. For example, HealthMap’s Outbreaks Near Me not only shows reports of disease outbreaks near your location, but it also lets you enter unreported incidents. The GasBuddy app shows the latest gasoline prices and lets you enter in current prices. This “crowdsourcing” feature keeps an app up-to-date by letting its users update the map with the latest conditions as they are happening.

        The Outbreaks Near Me app for phones (left) and the GasBuddy app for tablets (right)

        The Outbreaks Near Me app for phones (left) and the GasBuddy app for tablets (right)

        EHS professionals can further harness the power of GIS using mobile applications.  For example, in the Locus Mobile app for field data collection, users can enter environmental data—such as temperature or pH measurements—from a sampling location, then upload the data back to cloud-based environmental management software for immediate review and analysis. Mobile apps can also support facility compliance audits, track current locations of hazardous waste drums, collect on-scene incident data (complete with photos), and record exact locations for mapping by colleagues back in the office.

        GIS-enabled mobile apps also typically include a map interface for navigating to data collection points and tracking visited locations. Other key features to look for include ad hoc location creation for capturing unplanned data—this lets users create new data collection points “on the fly” simply by clicking on the map.

        Locus Mobile App

        Views of many different mobile app use cases from tracking drums to collecting field data

        A bright future for GIS applications within EHS software

        Where will GIS as a whole go from here? It’s possible that augmented reality, virtual reality, and 3D visualization will continue to expand and become as ubiquitous as the current “2D” maps on browsers and phones. Also, the “internet of things” will surely have a GIS component because every physical “thing” can be tied to a geographical location. Similarly, GIS can play an important role in “big data” by providing the spatial framework for analysis.

        GIS is one of the most effective ways to convey information to a wide range of users, from corporate managers looking at the company’s key metrics to operational personnel looking for incidents across facilities and trying to find trends. It is a highly intuitive data query interface that empowers users to explore the data hidden deep in enterprise EHS databases. The examples presented above are just the tip of the iceberg for the range of possibilities to simplify communication of information and look more broadly across enterprises to identify where real or potential issues lie.

        An EHS software system should have many ways to extract data and information to form insights beyond a few “canned” reports and charts. A spatially-accurate picture can often provide more actionable insight than tables and text. Imagine being able to see spill locations, incident locations, environmental monitoring stations for air quality, wastewater outfalls, central and satellite waste accumulation area locations, and PCB and asbestos equipment and/or storage locations—all visually represented on an actual map of your facility and its surroundings. All these types of maps are invaluable in an enterprise EHS software system and should be a critical item on your checklist when selecting software for your EHS needs.

        Thanks to the GIS Timeline for providing some of the history for this article.


        Locus employee Todd PierceAbout guest blogger— Dr. Todd Pierce, Locus Technologies

        Dr. Pierce manages a team of programmers tasked with development and implementation of Locus’ EIM application, which lets users manage their environmental data in the cloud using Software-as-a-Service technology. Dr. Pierce is also directly responsible for research and development of Locus’ GIS (geographic information systems) and visualization tools for mapping analytical and subsurface data. Dr. Pierce earned his GIS Professional (GISP) certification in 2010.


        [jwplayer mediaid=”16590″]

        Interested in Locus’ GIS solutions?

        Introducing Locus GIS+. All the functionality you love in EIM’s classic Google Maps GIS for environmental management— now integrated with the powerful cartography, interoperability, & smart-mapping features of Esri’s ArcGIS platform!

        Learn more about GIS+


        Predicting the Big Data Boom: Hazardous Data Explosion

        In 1989, 25 years before the technologically advanced world we currently live in, Locus’ founding members were busy publishing an article about the challenges of managing massive amounts of data produced from testing and long-term monitoring at hazardous waste sites.

        The article, “Hazardous Data Explosion“, published in the December 1989 issue of the ASCE Civil Engineering Magazine was among the first of its kind to discuss these issues within the environmental space, and placed Locus securely at the forefront of the big data craze.  This article was followed by a sequel article, titled “Taming Environmental Data“, published in 1992 in the same magazine.

        Today, the term ‘big data’ has become a staple across various industries to describe the enormity and complexity of data sets that need to be captured, stored, analyzed, visualized and reported. Although the concept may have gained public popularity fairly recently, big data has been a formidable opponent for decades.

        “It seems unavoidable that new or improved automated data processing techniques will be needed as the hazardous waste industry evolves. Automation can provide tools that help shorten the time it takes to obtain specific test results, extract the most significant finds, produce reports and display information graphically,” Buckle and Duplan stated.

        They also claimed that “expert systems” and artificial intelligence (AI) could be a possible solution—technology that has been a long time coming but still has a promising future when dealing with big data.  “Currently used in other technical fields, expert systems employ methods of artificial intelligence for interpreting and processing large bodies of information,” the authors explained.

        For more information on AI, see the CBS 60 Minutes episode titled “Artificial Intelligence, Real-Life Applications” from 9 October 2016.

        Almost 30 years later, cloud technologies combined with other advancements in big data processing are rising to the challenge of successfully processing and analyzing big environmental and sustainability data.

        Access the entire 1989 article “Hazardous Data Explosion” here.

        Tag Archive for: Environmental Software

        Nothing Found

        Sorry, no posts matched your criteria