Access your environmental data wherever you need it
Todd Pierce explains in this short video how Locus Technologies data portability can be available for all your data needs.
Todd Pierce explains in this short video how Locus Technologies data portability can be available for all your data needs.
Chris De Cree, an EHS Implementation Manager from Locus Technologies walks us through our container tracking tool.
To celebrate a milestone 25 years of success in EHS and ESG software development, we sat down with Locus President, Wes Hawthorne for a brief discussion. In this post, we ask him a series of questions highlighting the past, present and future of EHS and ESG.
One of the persistent challenges we’ve seen for the past 25 years is that the responsibilities of environmental professionals are continually expanding. Previously, almost all environmental work was localized, with facility-level permits for air, water, waste, etc. That has expanded over the years to include new regulations and reporting requirements for sustainability, social metrics, and other new compliance areas, while the old facility-level programs still continue. This has led to more pressure on environmental managers to keep up with these programs, and increased reliance on tools to manage that information. That’s where Locus has always focused our effort, to make that ever-expanding workload more manageable with modern solutions.
The current flood of interest in ESG is certainly notable as far as bringing corporate attention to the environmental field, as well as having requirements originate from the SEC here in the US. We have become accustomed to managing oversight from multiple regulatory bodies at the local, state, and federal level, but SEC would be a newcomer in our line of work. Their involvement will be accompanied by a range of new requirements that are common for the financial world, but would be unfamiliar to environmental staff.
Across other EHS fields, we are seeing increased demand for transparency in EHS functions. Overall, this is a positive move, as it brings more attention to EHS issues and develops a better EHS culture within organizations. But this also drives the need for better tools to make EHS information readily available across all levels of the organization.
As far as technologies, the ones most likely to have significant impact in the environmental field are ones that don’t require a significant capital investment. Although there are definitely some practical advantages to installing smart monitoring devices and other new technologies, procuring the funding for those purchases is often difficult for environmental professionals. Fortunately, there are still many technologies that have already been implemented successfully in other fields, but only need to be adapted for environmental purposes. Even simple changes like using web-based software in place of spreadsheets can have a huge impact on efficiency. And we haven’t yet seen the full impact of the proliferation of mobile devices on EHS functions. We are still working on new ways to take advantage of mobile devices for data collection, analysis, and communication purposes.
We’ve seen a number of innovation milestones in the past 25 years, and while we didn’t invent SaaS, we’ve been largely responsible for adapting it and perfecting it for environmental purposes. One of the major innovations we’ve integrated into our products include online GIS tools where users can easily visualize their environmental data on maps without expensive desktop software. Another one was our fully configurable software platform with built-in form, workflow, and report builders tailored for environmental purposes, which allows anyone to build and deploy environmental software applications that exactly match their needs. There have been many other innovations we’ve incorporated into our software, but these two stand out as the most impactful.
More and more, we are seeing all types of reporting being converted into pure data exchanges. Reports that used to include regulatory forms and text interpretations are being replaced with text or XML file submittals. This transition is being driven largely by availability of technology for EHS professionals to generate and read these files, but it is also promoted by regulatory agencies and other stakeholders receiving these reports. Stakeholders have less time to read volumes of interpretive text, and are becoming more skeptical of potential bias in how facts are presented in text. These are driving the need for more pure data exchanges, with increasing emphasis on quantifiable metrics. These types of reports are also more readily compared against regulatory or industry standards. For reporters, lengthy corporate reports with volumes of text and graphics are becoming less common, and the success of an organization’s programs will be increasingly reliant on robust data sets, since ultimately only the data will be reported.
There are actually a few that immediately come to mind. One reason is the nature of our continually evolving products. By providing our solutions as SaaS, our software adapts with new environmental requirements, and with new technologies. If our software was still the same as it was 25 years ago, it simply wouldn’t be sufficient for today’s requirements. Since our software is updated multiple times each year, it is difficult to notice the incremental changes, but they can be readily seen if you compare today’s software with the original in 1997. And we’re committed to continuing the development of our products as environmental needs change.
The other primary reason for our success is our excellent staff and the environmental expertise we bring to our customers. We simply could not provide the same level of support without our team of environmental engineers, scientists, geologists, chemists, and an array of others. Having that real-world understanding of environmental topics is how we’ve maintained customer relationships for multiple decades. And our software only has value because it is maintained and operated by staff who appreciate the complexity and importance of environmental work.
 Mr. Hawthorne has been with Locus since 1999, working on development and implementation of services and solutions in the areas of environmental compliance, remediation, and sustainability. As President, he currently leads the overall product development and operations of the company. As a seasoned environmental and engineering executive, Hawthorne incorporates innovative analytical tools and methods to develop strategies for customers for portfolio analysis, project implementation, and management. His comprehensive knowledge of technical and environmental compliance best practices and laws enable him to create customized, cost-effective and customer-focused solutions for the specialized needs of each customer.
Mr. Hawthorne holds an M.S. in Environmental Engineering from Stanford University and B.S. degrees in Geology and Geological Engineering from Purdue University. He is registered both as a Professional Engineer and Professional Geologist, and is also accredited as Lead Verifier for the Greenhouse Gas Emissions and Low Carbon Fuel Standard programs by the California Air Resources Board.
If your current water data management solution doesn’t meet these requirements, then it’s time to consider a switch.
In a Software as a Service (SaaS) delivery model, service uptime is vital for several reasons. Besides the obvious of having access to the service over the internet at any given time and staying connected to it 24/7/365, there are additional reasons why service uptime is essential. One of them is quickly verifying the vendor’s software architecture and how it fits the web.
Locus is committed to achieving and maintaining the trust of our customers. Integral to this mission is providing a robust compliance program that carefully considers data protection matters across our cloud services and service uptime. After security, service uptime and multitenancy at Locus come as a standard and, for the last 25 years, have been the three most essential pillars for delivering our cloud software. Our real-time status monitoring (ran by an independent provider of web monitoring services) provides transparency around service availability and performance for Locus’ ESG and EHS compliance SaaS products. Earlier I discussed the importance of multitenancy in detail. In this article, I will cover the importance of service uptime as one measure to determine if the software vendor is running genuine multitenant software or not.
If your software vendor cannot share uptime statistics across all customers in real-time, they most likely do not run on a multitenant SaaS platform. One of the benefits of SaaS multitenancy (that is frequently overlooked during the customer software selection process) is that all customers are on the same instance and version of the software at all times. For that reason, there is no versioning of software applications. Did you ever see a version number for Google’s or Amazon’s software? Yet they serve millions of users simultaneously and constantly get upgraded. This is because multitenant software typically provides a rolling upgrade program: incremental and continuous improvements. It is an entirely new architectural approach to software delivery and maintenance model that frees customers from the tyranny of frequent and costly upgrades and upsell from greedy vendors. Companies have to develop applications from the ground up for multitenancy, and the good thing is that they cannot fake it. Let’s take a deeper dive into multitenancy.
An actual multitenant software provider can publish its software uptime across all customers in real-time. Locus, for example, has been publishing its service uptime in real-time across all customers since 2009. Locus’s track record speaks for itself: Locus Platform and EIM have a proven 99.9+ percent uptime record for years. To ensure maximum uptime and continuous availability, Locus provides redundant data protection and the most advanced facilities protection available, along with a complete data recovery plan. This is not possible with single-tenant applications as each customer has its software instance and probably a different version. One or a few customers may be down, others up, but one cannot generally aggregate software uptime in any meaningful way. The fastest way to find if the software vendor offers multitenant SaaS or is faking it is to check if they publish online, in real-time, their applications uptime, usually delivered via an independent third party.
Legacy client-server or single-tenant software cannot qualify for multitenancy, nor can it publish vendor’s uptime across all customers. Let’s take a look at definitions:
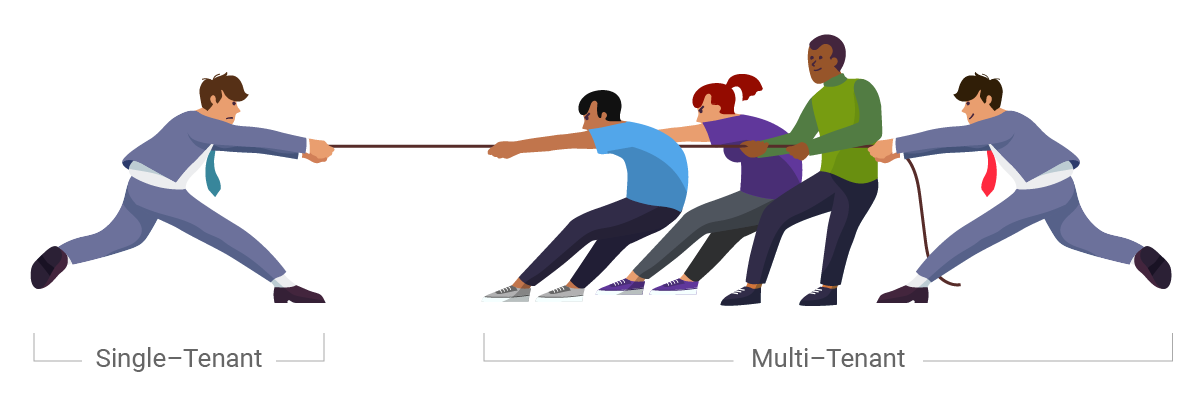
Single-Tenant – A single instance of the software and supporting infrastructure serves a single customer. With single-tenancy, each customer has their independent database and instance of the software. Essentially, there is no sharing happening with this option.
Multitenant – Multitenancy means that a single instance of the software and its supporting infrastructure serves multiple customers. Each customer shares the software application and also shares a single database. Each tenant’s data is isolated and remains invisible to other tenants.
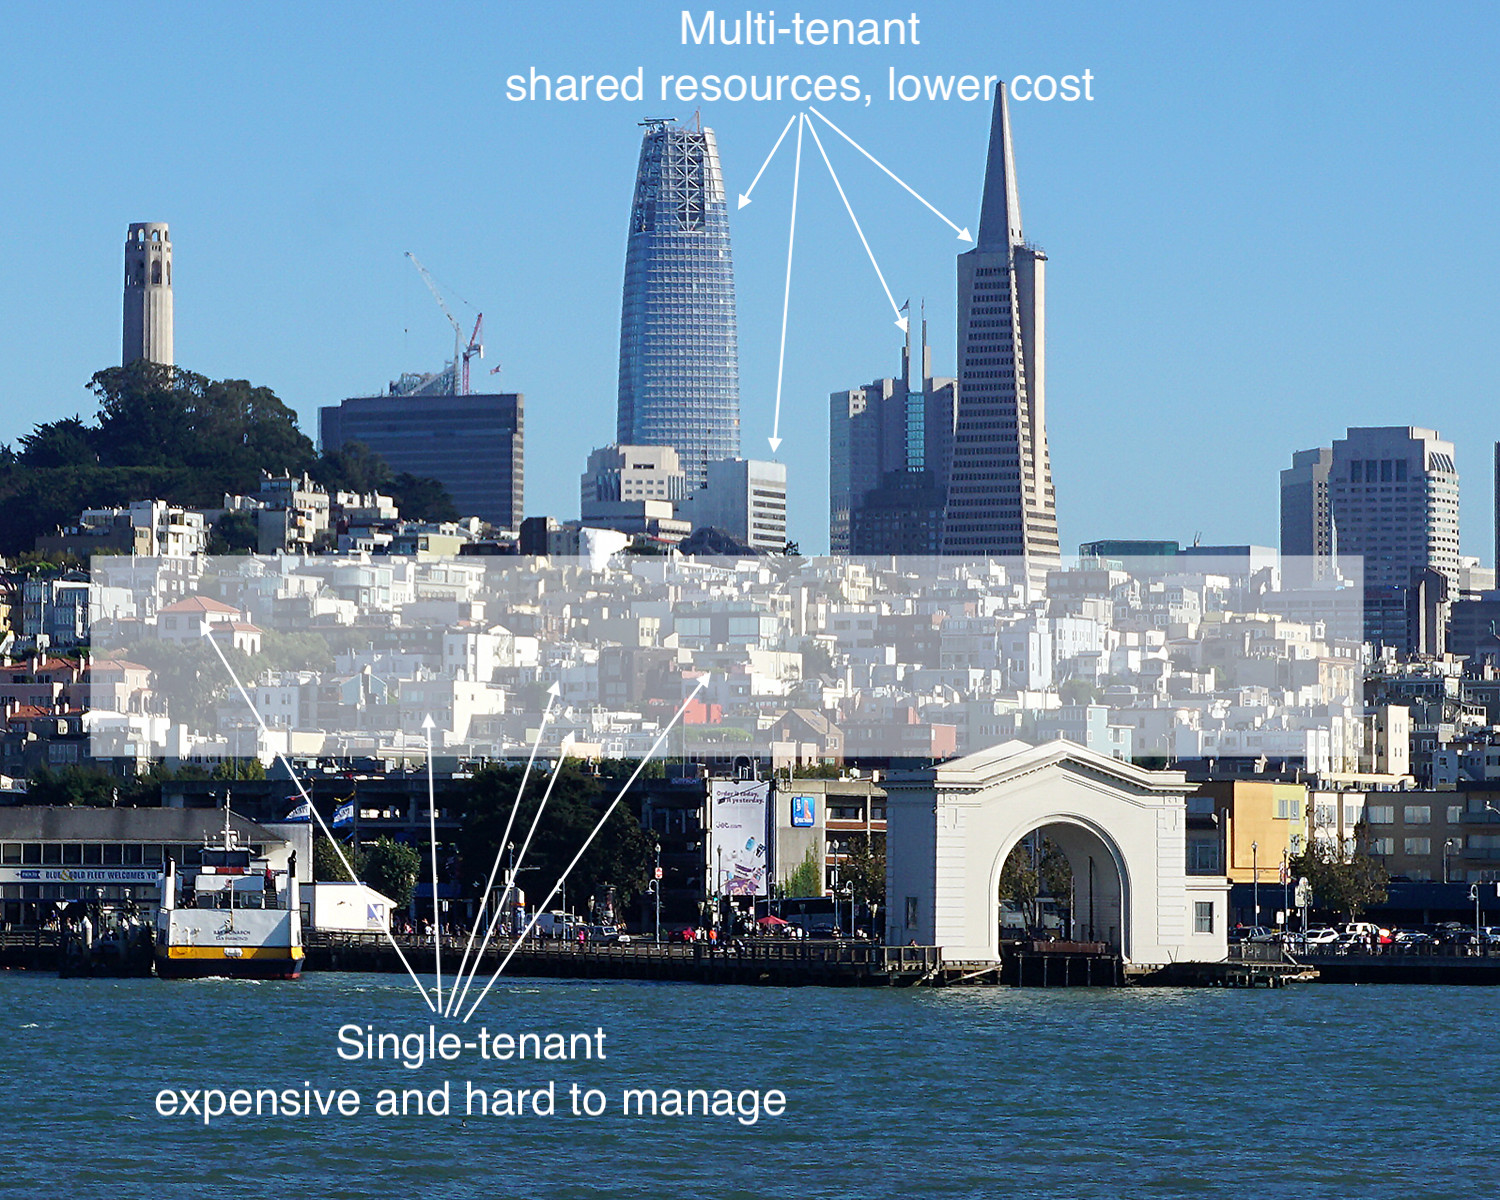
A multitenant SaaS provider’s resources are focused on maintaining a single, current (and only) version of the software platform rather than being spread out in an attempt to support multiple software versions for customers. If a provider isn’t using multitenancy, it may be hosting thousands of single-tenant customer implementations. Trying to maintain that is too costly for the vendor, and sooner or later, those costs become the customers’ costs.
A vendor invested in on-premise, hosted, and hybrid models cannot commit to providing all the benefits of an actual SaaS model due to conflicting revenue models. Their resources will be spread thin, supporting multiple software versions rather than driving SaaS innovation. Additionally, suppose the vendor makes most of their revenue selling on-premise software. In that case, it is difficult for them to fully commit to a proper SaaS solution since most of their resources support the on-premise software. In summary, a vendor is either multitenant or not – there is nothing in between. If they have a single application installed on-premise of customer or single-tenant cloud, they do not qualify to be called multitenant SaaS.
Before you engage future vendors for your enterprise ESG reporting or EHS compliance software, assuming you already decided to go with a SaaS solution, ask this simple question:
Can you share your software uptime across ALL your customers in real-time? If the answer is no, pass.
And if the vendor suddenly introduces a “multitenant” model (after selling an on-premises or single-tenant software version for 10+ years), who in the world would want to migrate to that experimental cloud without putting the contract out to bid to explore a switch to well established and market-tested actual multitenant providers? The first-mover advantage of multitenancy is a considerable advantage for any vendor. Still not convinced? Let me offer a simple analogy to drive home the point as to why service uptime and multitenancy matter: Tesla vs. Edison–War of Currents.
The War of Currents was a series of events surrounding the introduction of competing electric power transmission systems in the late 1880s and early 1890s that pitted companies against one another and involved a debate over the cost and convenience of electricity generation and distribution systems, electrical safety, and a media/propaganda campaign, with the leading players being the direct current (DC) based on the Thomas Edison Electric Light Company and the supporters of alternating current (AC) based on Nikola Tesla’s inventions backed by Westinghouse.
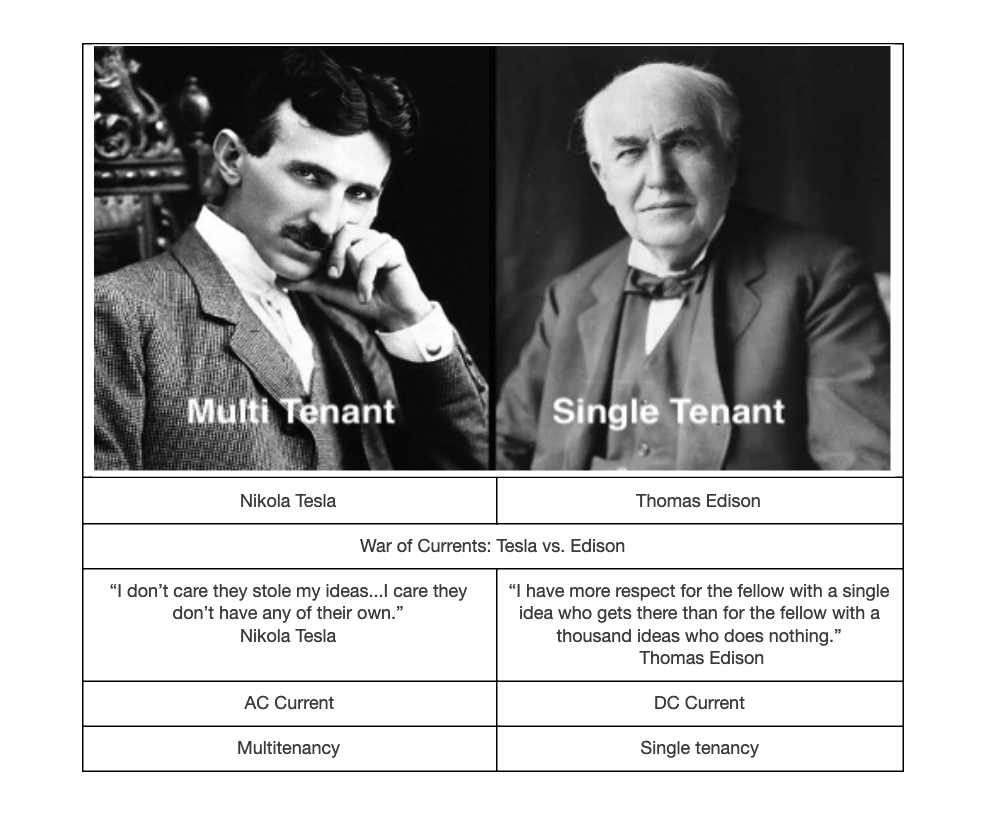
With electricity supplies in their infancy, much depended on choosing the right technology to power homes and businesses across the country. The Edison-led group argued for DC current that required a power generating station every few city blocks (single-tenant model). In contrast, the AC group advocated for a centralized generation with transmission lines that could move electricity great distances with minimal loss (multitenant model).
The lower cost of AC power distribution and fewer generating stations eventually prevailed. Multitenancy is equivalent to AC regarding cost, convenience, and network effect. You can read more about how this analogy relates to SaaS in the book by Nicholas Carr, “Big Switch.” It’s the best read so far about the significance of the shift to multitenant cloud computing. Unfortunately, the ESG/EHS software industry has lagged in adopting multitenancy.
Given these fundamental differences between different modes of delivering software as a service, it is clear that the future lies with the multitenant model.
Whether all customer data is in one or multiple databases is of no consequence to the customer. For those arguing against it, it is like an assertion that companies “do not want to put all their money into the same bank account as their competitors,” when what those companies are doing is putting their money into different accounts at the same bank.
When customers of a financial institution share what does not need to be partitioned—for example, the transactional logic and the database maintenance tools, security, and physical infrastructure and insurance offered by a major financial institution—then they enjoy advantages of security, capacity, consistency, and reliability that would not be affordably deliverable in isolated parallel systems.
Locus has implemented procedures designed to ensure that customer data is processed only as instructed by the customer throughout the entire chain of processing activities by Locus and its subprocessors. Amazon Web Services, Inc. (“AWS”) provides the infrastructure used by Locus to host or process customer data. Locus hosts its SaaS on AWS using a multitenant architecture designed to segregate and restrict customer data access based on business needs. The architecture provides an effective logical data separation for different customers via customer-specific “Organization IDs” and allows customer and user role-based access privileges. The customer interaction with Locus services is operated in an architecture providing logical data separation for different customers via customer-specific accounts. Additional data segregation ensures separate environments for various functions, especially testing and production.
Multitenancy yields a compelling combination of efficiency and capability in enterprise cloud applications and cloud application platforms without sacrificing flexibility or governance.
Locus has been preaching on the pitfalls of Excel for a long time. It’s no surprise that one of the worst imaginable errors in Excel that could’ve happened, did. Almost 16,000 COVID-19 cases in England went unreported because Public Health England hit the maximum row count in their version of Excel.
This is not the only example of Excel being misused or being the wrong tool entirely for the job. Excel is not in any way a data management system for complex or vital data. When it comes to sustainability reporting and environmental data management, the evils of the grid are a force to be reckoned with. We have highlighted a few examples that will have you shivering.
Take a look at this harmless-looking chart. It shows monthly electricity consumption for a facility set to report:
| Month | Monthly Electricity Consumption (MWh) |
| January 2019 | 133,500 |
| February 2019 | 122,400 |
| March 2019 | 138,900 |
| April 2019 | 141,600 |
| May 2019 | 141,601 |
| June 2019 | 141,602 |
| July 2019 | 141,603 |
| August 2019 | 141,604 |
| September 2019 | 141,605 |
| October 2019 | 141,606 |
| November 2019 | 141,607 |
| December 2019 | 141,608 |
During review, the auditor notices a distinct trend from April to December, indicating false data overwritten by a stray double-click. Eventually, the auditor required re-entering all invoice data for dozens of facilities to correct the issue. Where the original data went and how autofill went astray remains a mystery.
Imagine using a massive spreadsheet with lots of linked calculations for your annual sustainability report. One of the team engineers works on the file to input more data and get it ready for presentation. But in the final steps, they accidentally delete one of the formulas that sum up the indicators. The annual total looks great for the presentation since you’ve effectively removed a portion of your resource consumption, but afterwards you discover the conclusions were incorrectly calculated. How did that error get introduced? The spreadsheet has no auditing capabilities on the individual values, so you may never know.
Excel supports multiple users editing one document simultaneously, but not well. Multiple records are saved, edits are lost, and vital data vanishes, or at best is very hard to recover. The Track Changes feature is not infallible, and over reliance on it will cause hardship.
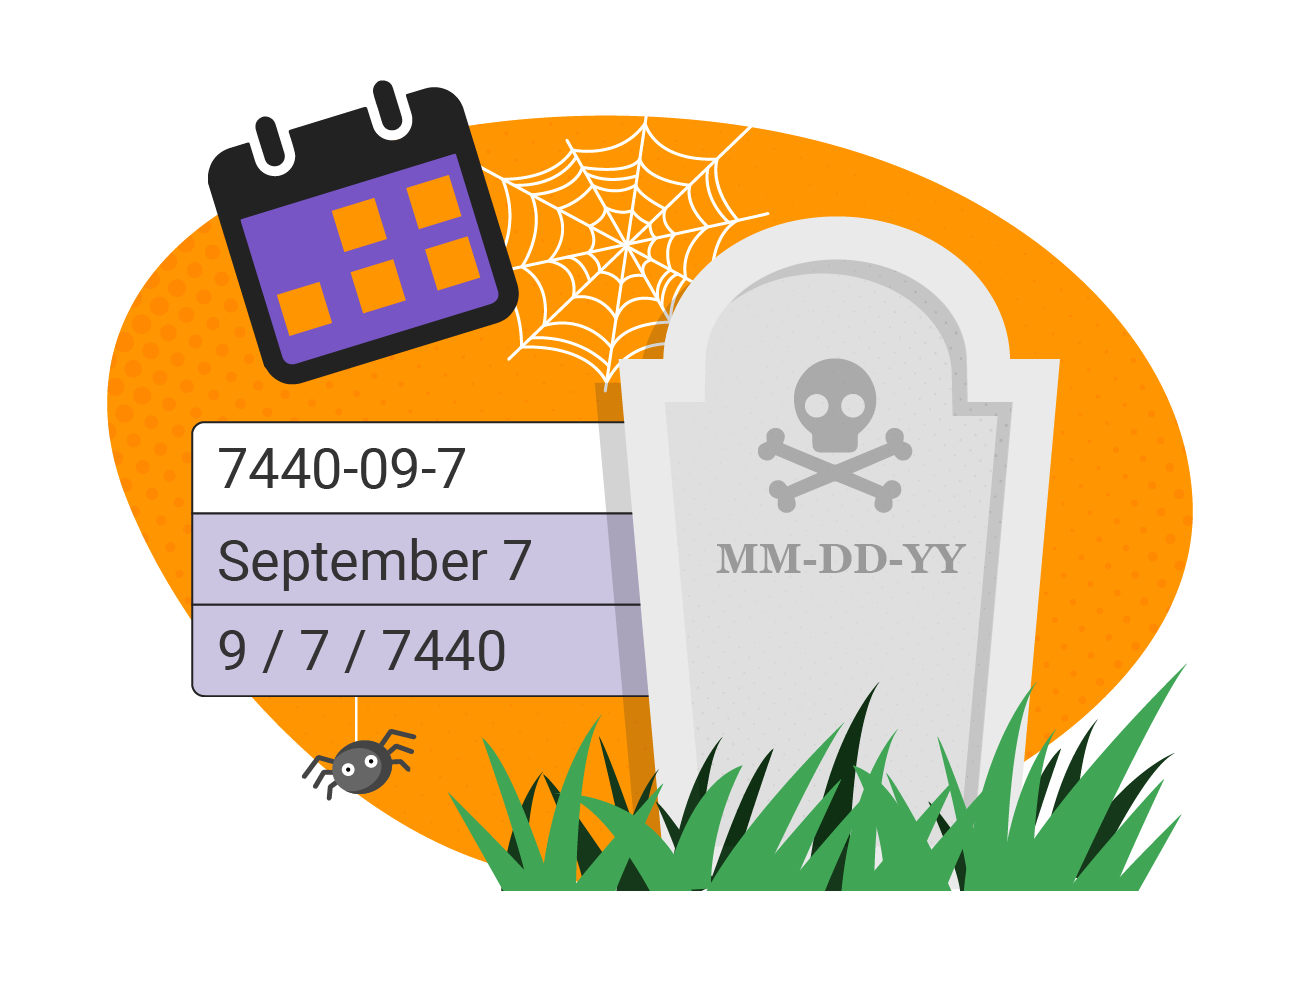
Excel has a frustrating insistence of changing CAS numbers into dates, even if they are something like “7440-09-7″ turning into September 7, 7400. If you’re not explicit in your cell formatting, Excel isn’t happy leaving values as they are.

You meant to type 1.5, but you typed “1..5” or “.1.5”. Does Excel reject these imposter numbers or let you know of a potential error? No, it’s stored in Text format. This can throw off any averages or sums you may be tracking. This minor identity theft can cause a real headache.
Other data quality issues with using Excel include, but are not limited to:
As you can see, the horrors of Excel are common, and terrifying. Without a proper system of record, auditing features, and the ability for data to vanish into the ephemera, Excel offers little in the way of data security and quality for organizations managing vital environmental and compliance data. Many are learning firsthand the superiority of database management systems over spreadsheets when it comes to managing data. Now is the time to examine the specific shortcomings of your current system and consider your options.
Locus provides multiple methods to populate EHS, ESG, or any environmental data, including the following:
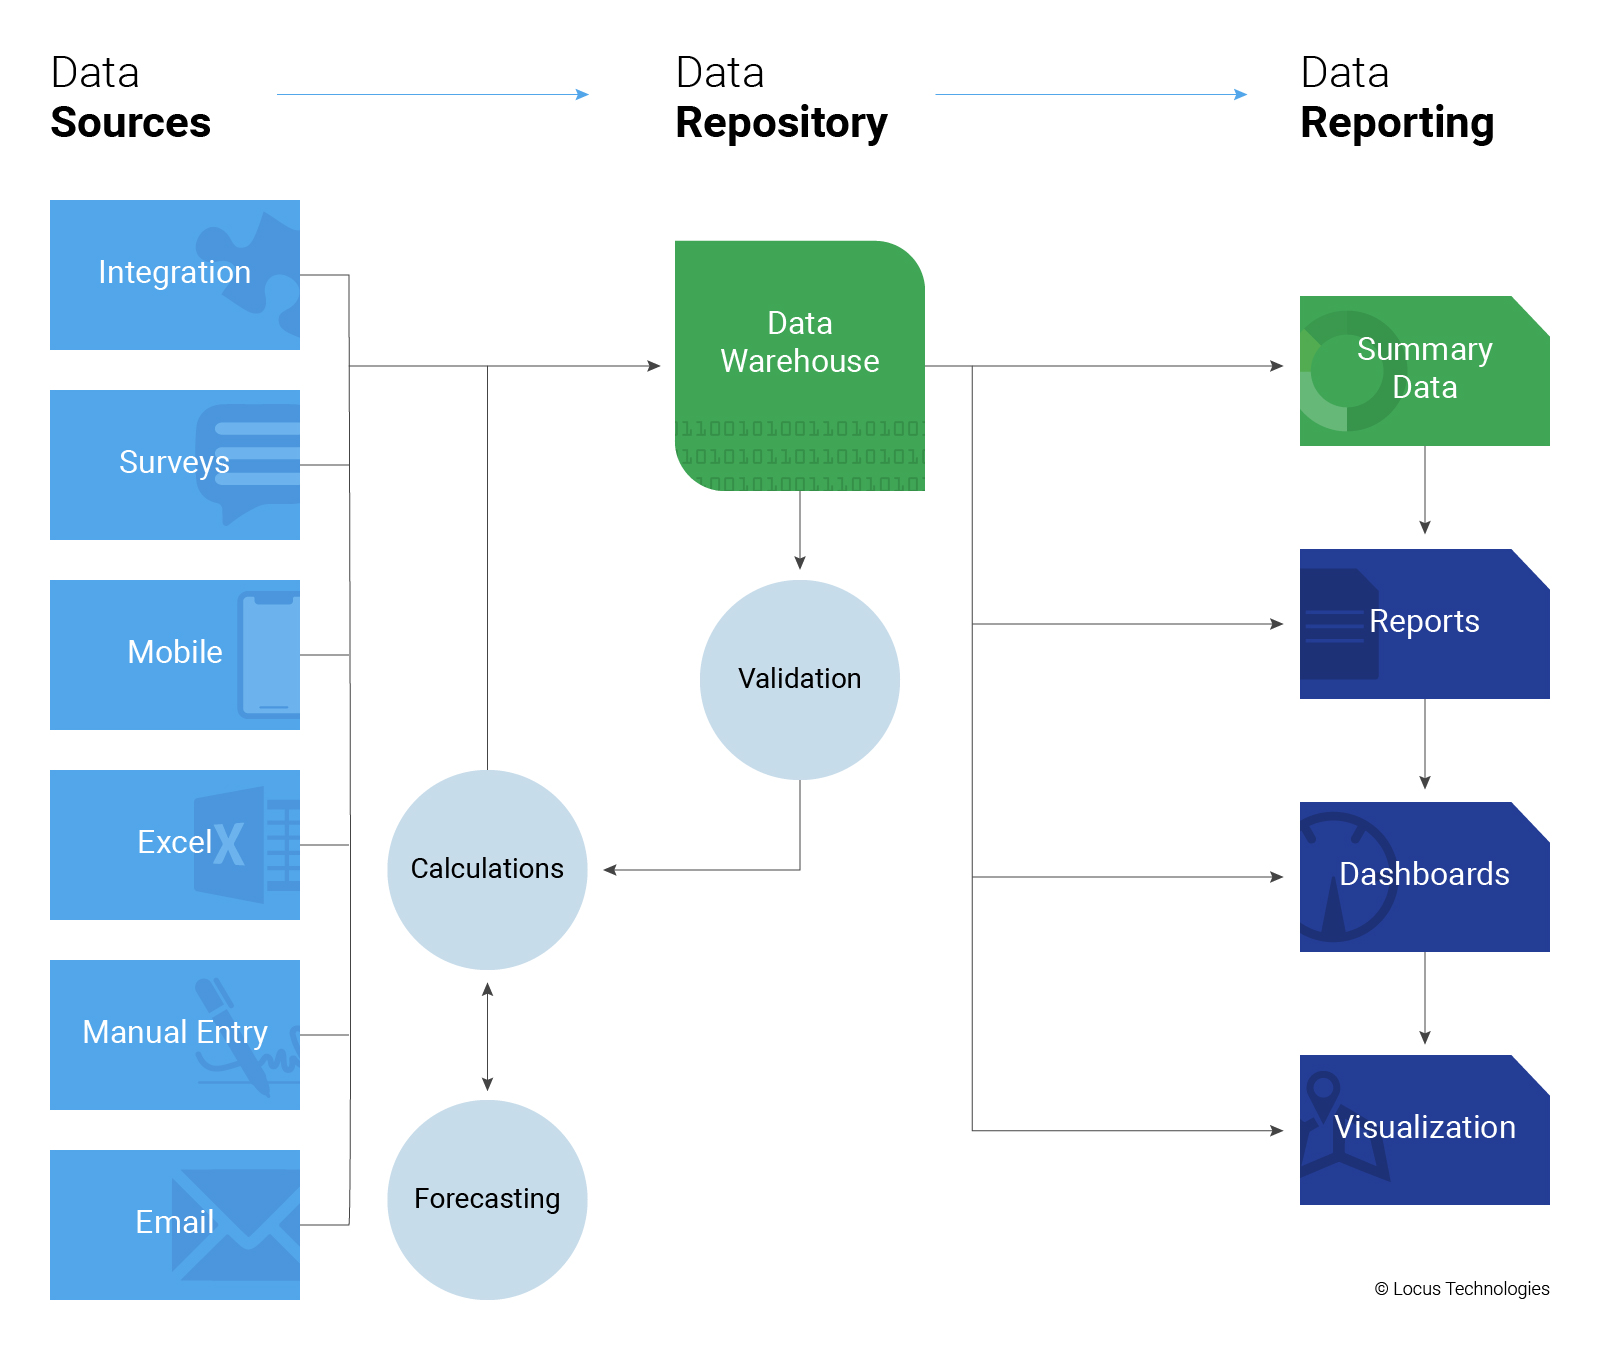
Locus provides a full suite of REST API’s, and SDK that can be used to populate data from external data sources. Typical uses include utility data, CEMS, meter data and IoT data.
Locus Survey tool enables you to issue survey questionnaires to people outside your organization, and enables them to securely and seamlessly respond directly into the survey form. Typical uses include supplier surveys, audits and customer questionnaires.
User input forms can be optimized for input on a phone or tablet, which allows quick uploads of photos and also geotags your data so you can ensure it was collected at the right location.
Locus provides a full suite of Excel upload tools that allow you to import data directly from Excel or CSV files. This option also allows you to work offline and re-sync your data later. Typical uses include laboratory data, periodic monitoring data and data migrations.
Like any system, Locus provides tools for users to directly enter data into the system. These include Locus sophisticated data validation tools which employs machine learning techniques to identify data entries which may be invalid, with visual indications of the expect range or ranges.
Locus can be configured to directly read email input (as text) and place it into the system. Typical uses include instances where external users initiate a conversation, which then may be responded to from within the system, such as an inquiry, issue, or an incident report.
One of the most frequent questions we get asked when it comes to ESG is, “Where do I begin?”. For many companies, the process of getting started with a new ESG program is the most difficult step. With nearly 1,700 frequently evolving ESG reporting protocols available, it can be daunting just to determine where to begin. This uncertainty associated with ESG reporting can unfortunately paralyze any progress for several organizations. The good news is that ESG doesn’t have to be an ‘all or nothing’ effort. In fact, getting started is a simple and straightforward process.

Regardless of what ESG reporting program you choose (or eventually choose), there are many common elements that can form the basis of your organization’s ESG program. Although social and governance KPIs have been undergoing rapid evolution recently, environmental KPIs have been comparatively stable. Environmental KPIs tend to be quantitative with established calculation methodologies, whereas the definitions and determinations as to what is important regarding societal and governance factors and how to measure them are still being evaluated globally. Considering this, many companies elect to start their ESG reporting program using monitoring and collecting environmental data.
Additionally, almost all reporting programs include the concept of a baseline, or a time period against which future ESG metrics are compared. Developing the baseline requires a good understanding of your organization’s current ESG performance, which of course requires a good set of data. Universal data that is required for any ESG reporting program includes data on greenhouse gas, water quality and consumption, waste, and energy consumption. The bedrock of an ESG program starts with the collection, management, and reporting of these data. This information can also help to inform further decisions for your ESG program, including which framework is most appropriate for your organization.

As part of this effort, you should make sure you are collecting and calculating your ESG metrics with software that supports the required complexity of environmental data. Often the companies who suggest a turnkey solution to ESG reporting are not only lacking in social and governance data, but are woefully underprepared and unequipped to handle environmental data as well. With over 25 years of experience in creating software for environmental reporting, Locus Technologies is equipped to help organizations collect and report ESG data in a way that others aren’t.
Greenwashing, or the presenting of misinformation to create a sustainable image, is common among organizations. While many consumers may not be aware with the term greenwashing, they are aware of how common it is. In fact, consumers are so aware of this trend that they’re overwhelmingly skeptical of all organizations presenting themselves as sustainable. Four out of every five consumers have expressed skepticism of organizations claiming to be sustainable. So, how does your company express your sincere desire to take steps that are sustainable for the environment? With accurate and transparent data.

With 2/3 of consumers seeking out companies that emphasize sustainable practices, the temptation to greenwash is certainly enticing. Sometimes it comes in the form of making irrelevant claims, like saying a product is free of something that is banned (like CFCs). Other times it comes in the form of half-truths, like saying that a product is sustainably sourced, despite the manufacture of the product being unsustainable or harmful to the environment. Any way you look at it, the demand for sustainable products is so high, as is the temptation to greenwash. The truest, and least disputable way to combat greenwashing is by collecting and reporting your data accurately.
Sustainability is now a broad umbrella term that encompasses not only environmental practices, but social and corporate governance as well, better known as ESG. This broadness reflects a change in consumer attitudes from generation to generation, perceiving more than environmental practices as important while holding environmental practices to the microscope. In fact, over 75% of Gen X consumers say that they have to trust a brand before purchasing from them, and over 85% of Millennial and Gen Z consumers say they same. This trust encompasses everything from the use of organic ingredients to company wellness practices, and is reinforced with buying practices. To do environmental, social, and corporate governance right, organizations have taken a data-first approach.
With Locus Technologies, you can take concrete steps towards achievable ESG goals. By taking a fully-digital approach, your organization can make the transformation by maintaining full visibility of raw sustainability data, calculations, and other factors, and also keeping data easily accessible and traceable. Reports are fully traceable back to the source, and are indisputable, allowing for increased trust from consumers or anyone else who has a stake in this information. Given that 7/10 consumers are willing to pay a premium to sustainable-minded companies who are fully transparent with their efforts, this move can provide a significant return on investment in the short term.
The benefits of data centralization also go beyond combatting greenwashing. A fully-digital and streamlined process will improve your ability to handle the data appropriately, and will ease any auditing and reporting responsibilities moving forward, making the entire process cheaper and faster.

With brand loyalty and purchasing decisions being reliant on sustainable decisions, the move to accurate and transparent data management is key. By implementing Locus Technologies ESG software, your organization can employ cutting-edge solutions to combat greenwashing by promoting your sustainability goals and actions transparently and accurately.
Locus EIM is the leading cloud-based application for managing and reporting environmental data. We have highlighted 5 key usability features that allow users to get the most out of their investment.
Sorry, no posts matched your criteria