Locus Technologies founder and CEO Neno Duplan provides a wealth of experience on water quality in the cloud. Neno began cloud-based data work before any of us knew what the cloud even was. He does a great job explaining the steps needed to undertake and the significant benefits of a cloud-based digital transformation, and much more!
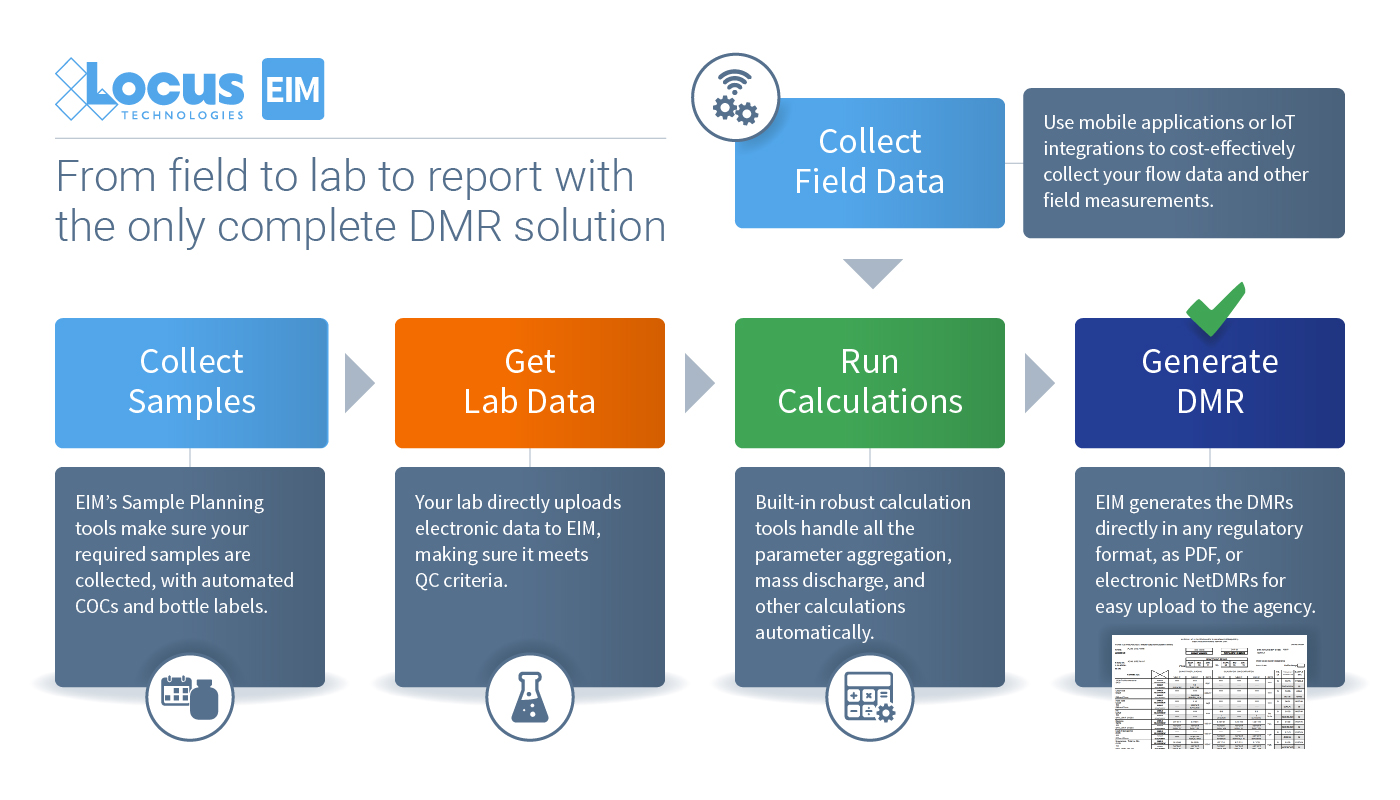
The DMR tool in Locus’ Environmental Information Management (EIM) software solves the problem of time-consuming, labor-intensive, and expensive manual report generation by automating the data assembly, calculations, and formatting of Discharge Monitoring Reports. Depending on the type of discharge and the regulatory jurisdiction, you may be required to report information such as analytical chemistry of pollutants, flow velocity, total maximum daily load, and other parameters. For companies that report on multiple facilities, producing a DMR also becomes a major expense.
Thanks to Locus’ DMR tool, companies can generate DMRs within minutes with validated data in approved formats, with all of the calculations completed according to regulatory requirements. Companies can set up EIM for its permitted facilities and realize immediate cost and time savings during each reporting period. Locus users have saved over $2,000,000 on DMR reporting.
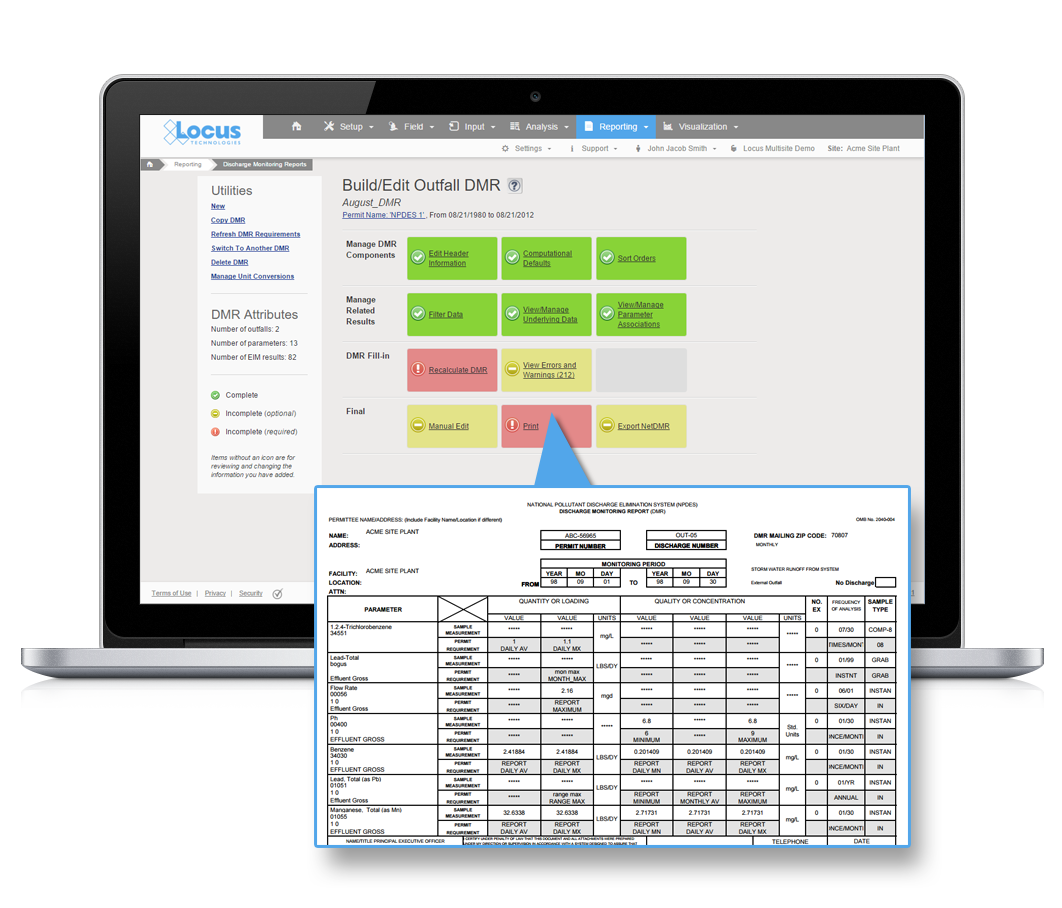
Locus continues to enhance the Discharge Monitoring Report (DMR) tool, recently implementing calculations needed to handle reporting of divalent metals. New formats, such as Florida DEP ezDMR, are regularly being added, so customers can meet their reporting requirements.
Contact us to see the DMR tool in action
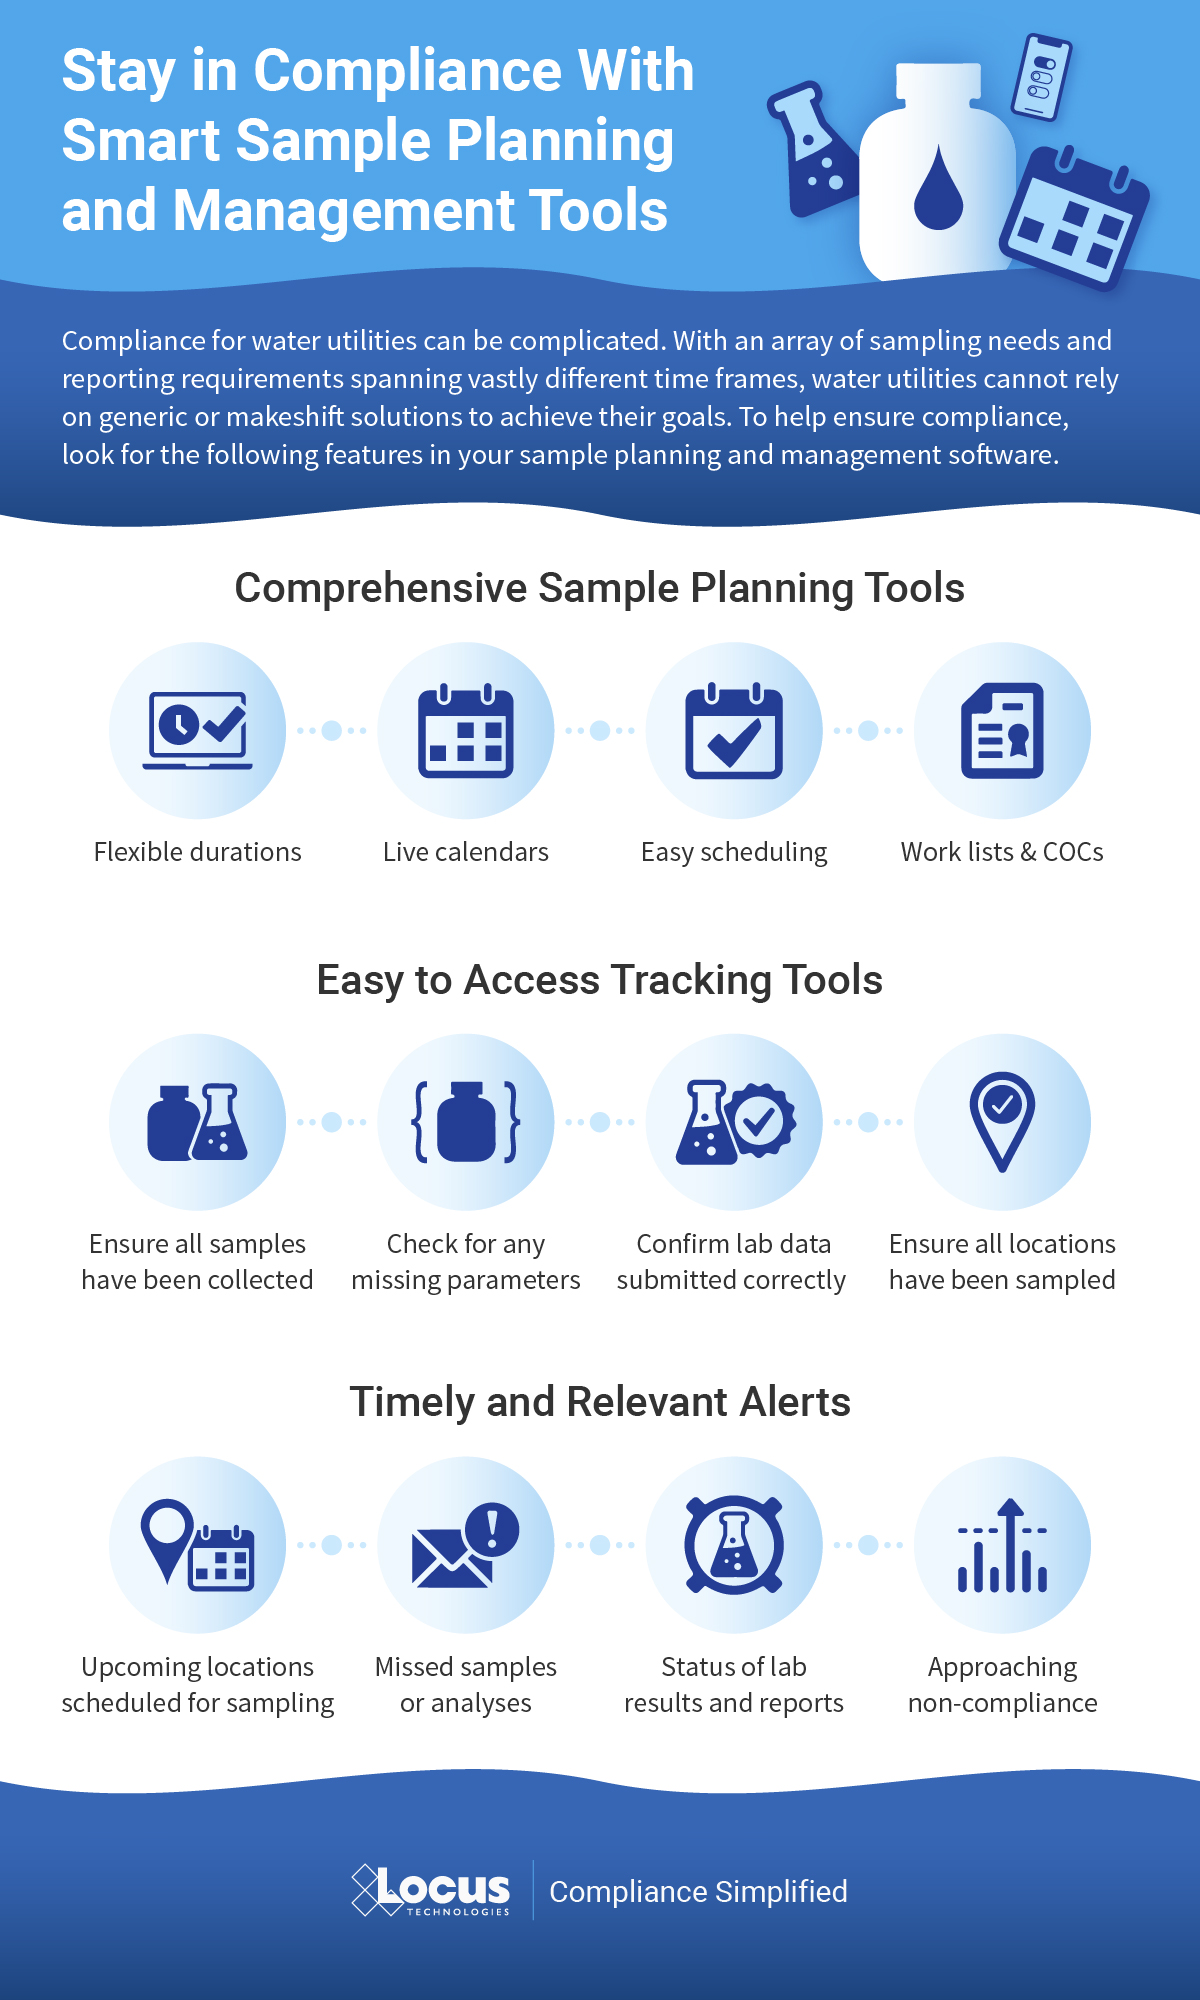
Imagine the time savings and the simplicity of having your regulatory requirements all lined out for the year without having to worry about missing required samples. For water utilities, this is especially valuable given the strict schedules and public health implications of missing sampling events. Locus sample planning streamlines repetitive sampling, such as required samples for drinking water or monitoring wells. Any sampling events can be planned and reused repeatedly, even with tweaks to the schedule for the samples to be collected. We’ve outlined some key features of Locus sample planning in this infographic.
Contact us to see Sample Planning in action
MOUNTAIN VIEW, Calif., 9 July 2019 — Locus Technologies, (Locus), the industry leader in water quality, EHS, sustainability, and compliance management software, is pleased to announce that the City of San Marcos, Texas Water/Wastewater Utility selected Locus Environmental Information Management (EIM) software to streamline water quality and wastewater management and compliance.
“With Locus’ water quality software we can streamline and modernize how we manage and report our critical water quality and wastewater data,” said Ron Riggins, San Marcos Water Quality Manager. “With an integrated mobile application, we will be able to access and react to field information faster than ever before.”
“By selecting Locus EIM water quality software, the City of San Marcos, Texas can simplify managing water and wastewater data and integrate with their existing GIS system. This will provide them a modern cloud solution with fully integrated mobile capabilities,” said Wes Hawthorne, President of Locus.
In most cities in the US, drinking water quality conforms with the norms of the Safe Drinking Water Act, which requires EPA to set Maximum Contaminant Levels (MCL) for potential pollutants. Besides, the EPA’s Consumer Confidence Rule (CCR) of 1998 requires most public water suppliers to provide consumer confidence reports, also known as annual water quality reports, to their customers.
PFAS stands for “perfluoroalkyl and polyfluoroalkyl substances,” with the most important thing to know that this large group of synthetic chemicals includes perfluorooctanoic acid (PFOA) and perfluorooctane sulfonate (PFOS).
Not Regulated by EPA
When it comes to drinking water from the tap in the US, the phrase that fits concerning PFOA and PFOS is “caveat emptor” (buyer beware). The EPA has not regulated these chemicals. There are no federal regulations for PFOA and PFOS in drinking water in the US.
In May 2016, the EPA established a drinking water “health advisory” of 70 parts per trillion (ppt) for the combined concentrations of PFOA and PFOS. While that was a start, there’s a big difference between a health advisory and a regulation that has teeth. Moreover, many scientists consider 70 ppt too high a limit. Reportedly, the EPA is considering turning its 70 ppt health advisory into regulation.
Meanwhile, some states have stepped up to the plate to protect their residents and visitors better. In April 2019, for instance, the New Jersey Department of Environmental Protection (DEP) proposed maximum contamination levels (MCLs) of 14 ppt for PFOA and 13 ppt for PFOS in the state’s drinking water.
As a water consumer, you should be aware of this crisis, as it has the potential to affect both your health and wealth.
What are PFOA and PFOS?
This toxic couple has contaminated the drinking water supply in areas surrounding some industrial sites and military bases. They’re the most studied of the PFAS group because they’re the ones that have been produced in the most significant quantities in the United States, according to the US Environmental Protection Agency (EPA).
PFOA and PFOS, which repel water and stains of various types, have been used as coatings on fabrics and leather and in the production of stain-repellent carpeting and are found in firefighting foams — which have been used extensively on US military bases for decades — among other products. Moreover, some related polyfluoroalkyl compounds can be transformed into these chemicals in the environment, per the National Institutes of Health (NIH), with the Environmental Working Group (EWG) stating that some perfluorinated chemicals not only break down into PFOA in the environment but also can do so in the human body.
While PFOA and PFOS are no longer made in the US, that hardly matters in our global economy. Both are still produced internationally, which means they end up in our country via imports of consumer goods such as carpet, apparel, textiles, and paper and packaging.
Why all the concern about PFOA and PFOS?
These chemicals — dubbed “forever chemicals” because they’re persistent in the environment and the human body — have been linked to cancer, thyroid disease, weakened the immune system and liver function, low infant birth weight, and other health problems, according to many sources.
And this is what the EPA says: “There is evidence that exposure to PFAS can lead to adverse health outcomes in humans. If humans, or animals, ingest PFAS…the PFAS are absorbed and can accumulate in the body. PFAS stay in the human body for long periods. As a result, as people get exposed to PFAS from different sources over time, the level of PFAS in their bodies may increase to the point where they suffer from adverse health effects.”
In most industrialized cities around the world, drinking water is readily available and safe. Safeguarding groundwater (aquifers), streams, rivers, reservoirs, and lakes is crucial to continue delivering clean water on the tap. So is testing and validated water quality data. There are several aspects of drinking water quality that is of concern in the United States, including Cryptosporidium, disinfection by-products, lead, perchlorates, and pharmaceutical substances.
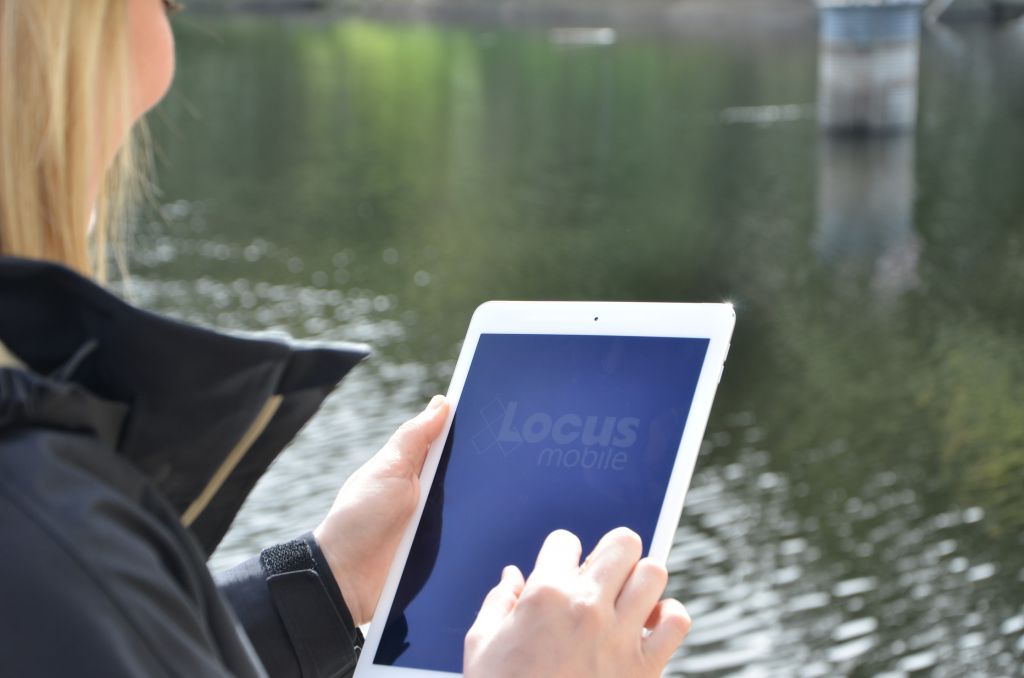
Recent headlines about water quality issues in cities like Flint, Pittsburgh, Asheville, or Rome and Capetown are motivating consumers to ask more questions about their water quality. Albuquerque’s groundwater is becoming seriously depleted; Fresno’s groundwater is highly susceptible to contamination; In Atlanta, Chicago, Detroit, Houston, Los Angeles, New Orleans, Newark, Philadelphia, Phoenix, San Diego and Washington, D.C., source water is threatened by runoff and industrial or sewage contamination; Water supplies in Baltimore, Fresno, Los Angeles, New Orleans, San Diego, and several other cities are vulnerable to agricultural pollution containing nitrogen, pesticides or sediment.
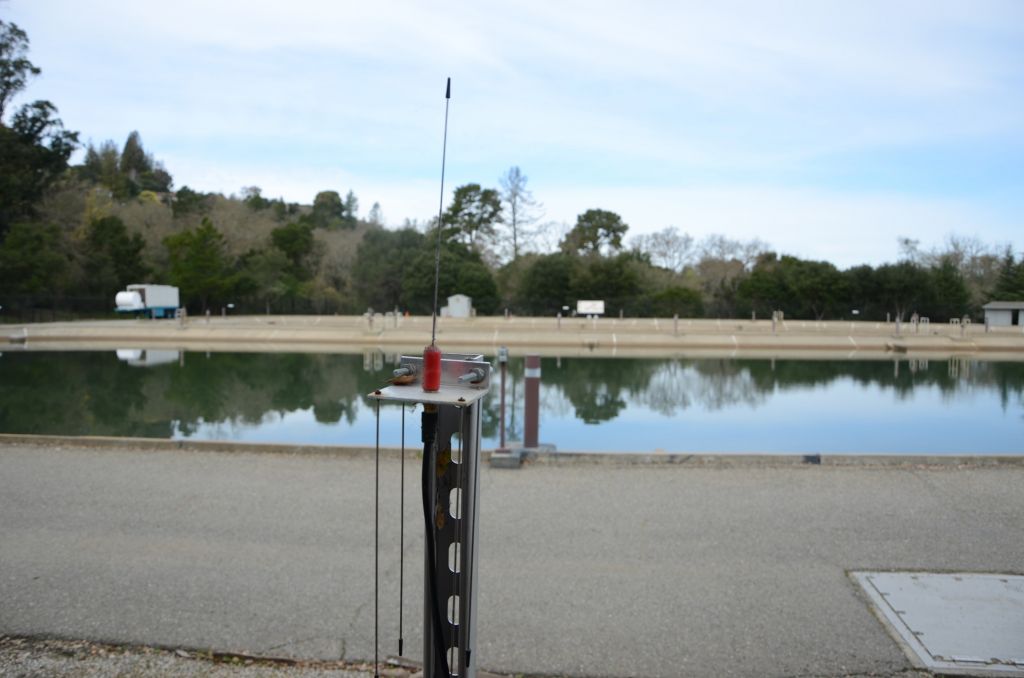
Locus Technologies IoT Monitoring. Connected at all times.
In most cities in the US, drinking water quality is in conformity with the norms of the Safe Drinking Water Act, which requires EPA to set Maximum Contaminant Levels (MCL) for potential pollutants. In addition, the EPA’s Consumer Confidence Report (CCR) Rule of 1998 requires most public water suppliers to provide consumer confidence reports, also known as annual water quality reports, to their customers. Each year by July 1 anyone connected to a public water system should receive in the mail an annual water quality report that tells where water in a specific locality comes from and what’s in it. Locus EIM automates this reporting and allows utilities to be transparent by publishing CCR online in real time so that consumers have access to their CCR at all times. Consumers can also find out about these local reports on a map provided by EPA.
Utilities must maintain good water quality records and manage them in a secure database with built-in alerts for any outliers so that responsible water quality managers can react quickly when there is exceedance of MCL or another regulatory limit.
[sc_button link=”https://www.locustec.com/applications/industry/water-utilities/” text=”Learn more about our water solutions” link_target=”_self” background_color=”52a6ea” centered=”1″]
Manage all those ops readings without spreadsheets or paper forms
I am constantly reminded by the number of calls we receive, that no matter how robust a SCADA and HMI system is, there is always a requirement for in-field O&M verification and documentation. It’s almost universal, and spans a myriad of industries, large and small, the need to monitor and record thousands of periodic (daily/per shift/weekly, etc.) routine readings/recordings at a prescribed frequency often recorded on pen to paper field forms. The same processes sometimes use “template” spreadsheets for data collection that are then emailed/placed on shared file servers or otherwise sent to some central location for review and post processing. These processes are antiquated and subject to data quality and record keeping challenges.
It’s time for an upgrade!
Why simple form builders are not a good software solution for ops data
Electronic forms are great for collecting data and almost every business entity has built such forms in spreadsheets, word processing or simple databases to collect the information. In addition, there is a software category of form builders and they can certainly build forms. The question becomes is it a good fit so solve your business process issues?
Most customers have more sophisticated needs than simply collecting information on one or more custom forms – they want to do something with all the information collected far beyond what simple form builder tools can provide. Even customers with sophisticated spreadsheet forms, can’t manage them as they multiply exponentially or their Excel gurus retire.
Here are some examples of where you may require software tools beyond a simple form builder:
- Collecting equipment readings on each shift at multiple locations and report the data to centralized management, who review the data, look for trends/ issues.
- Verifying and validating data at the point of data entry to eliminate data entry errors.
- Automatically visualizing (charts or tables) information in near real time to make operations decisions.
- Sharing the information with others.
- Scheduling activities related to periodic or infrequent data collection events.
- Receiving notifications when actions are due.
- Automatically creating regulatory reports in prescribed formats.
- Creating complex work flows and audited approval processes.
- Creating intelligent forms with calculations based on past data or other criteria
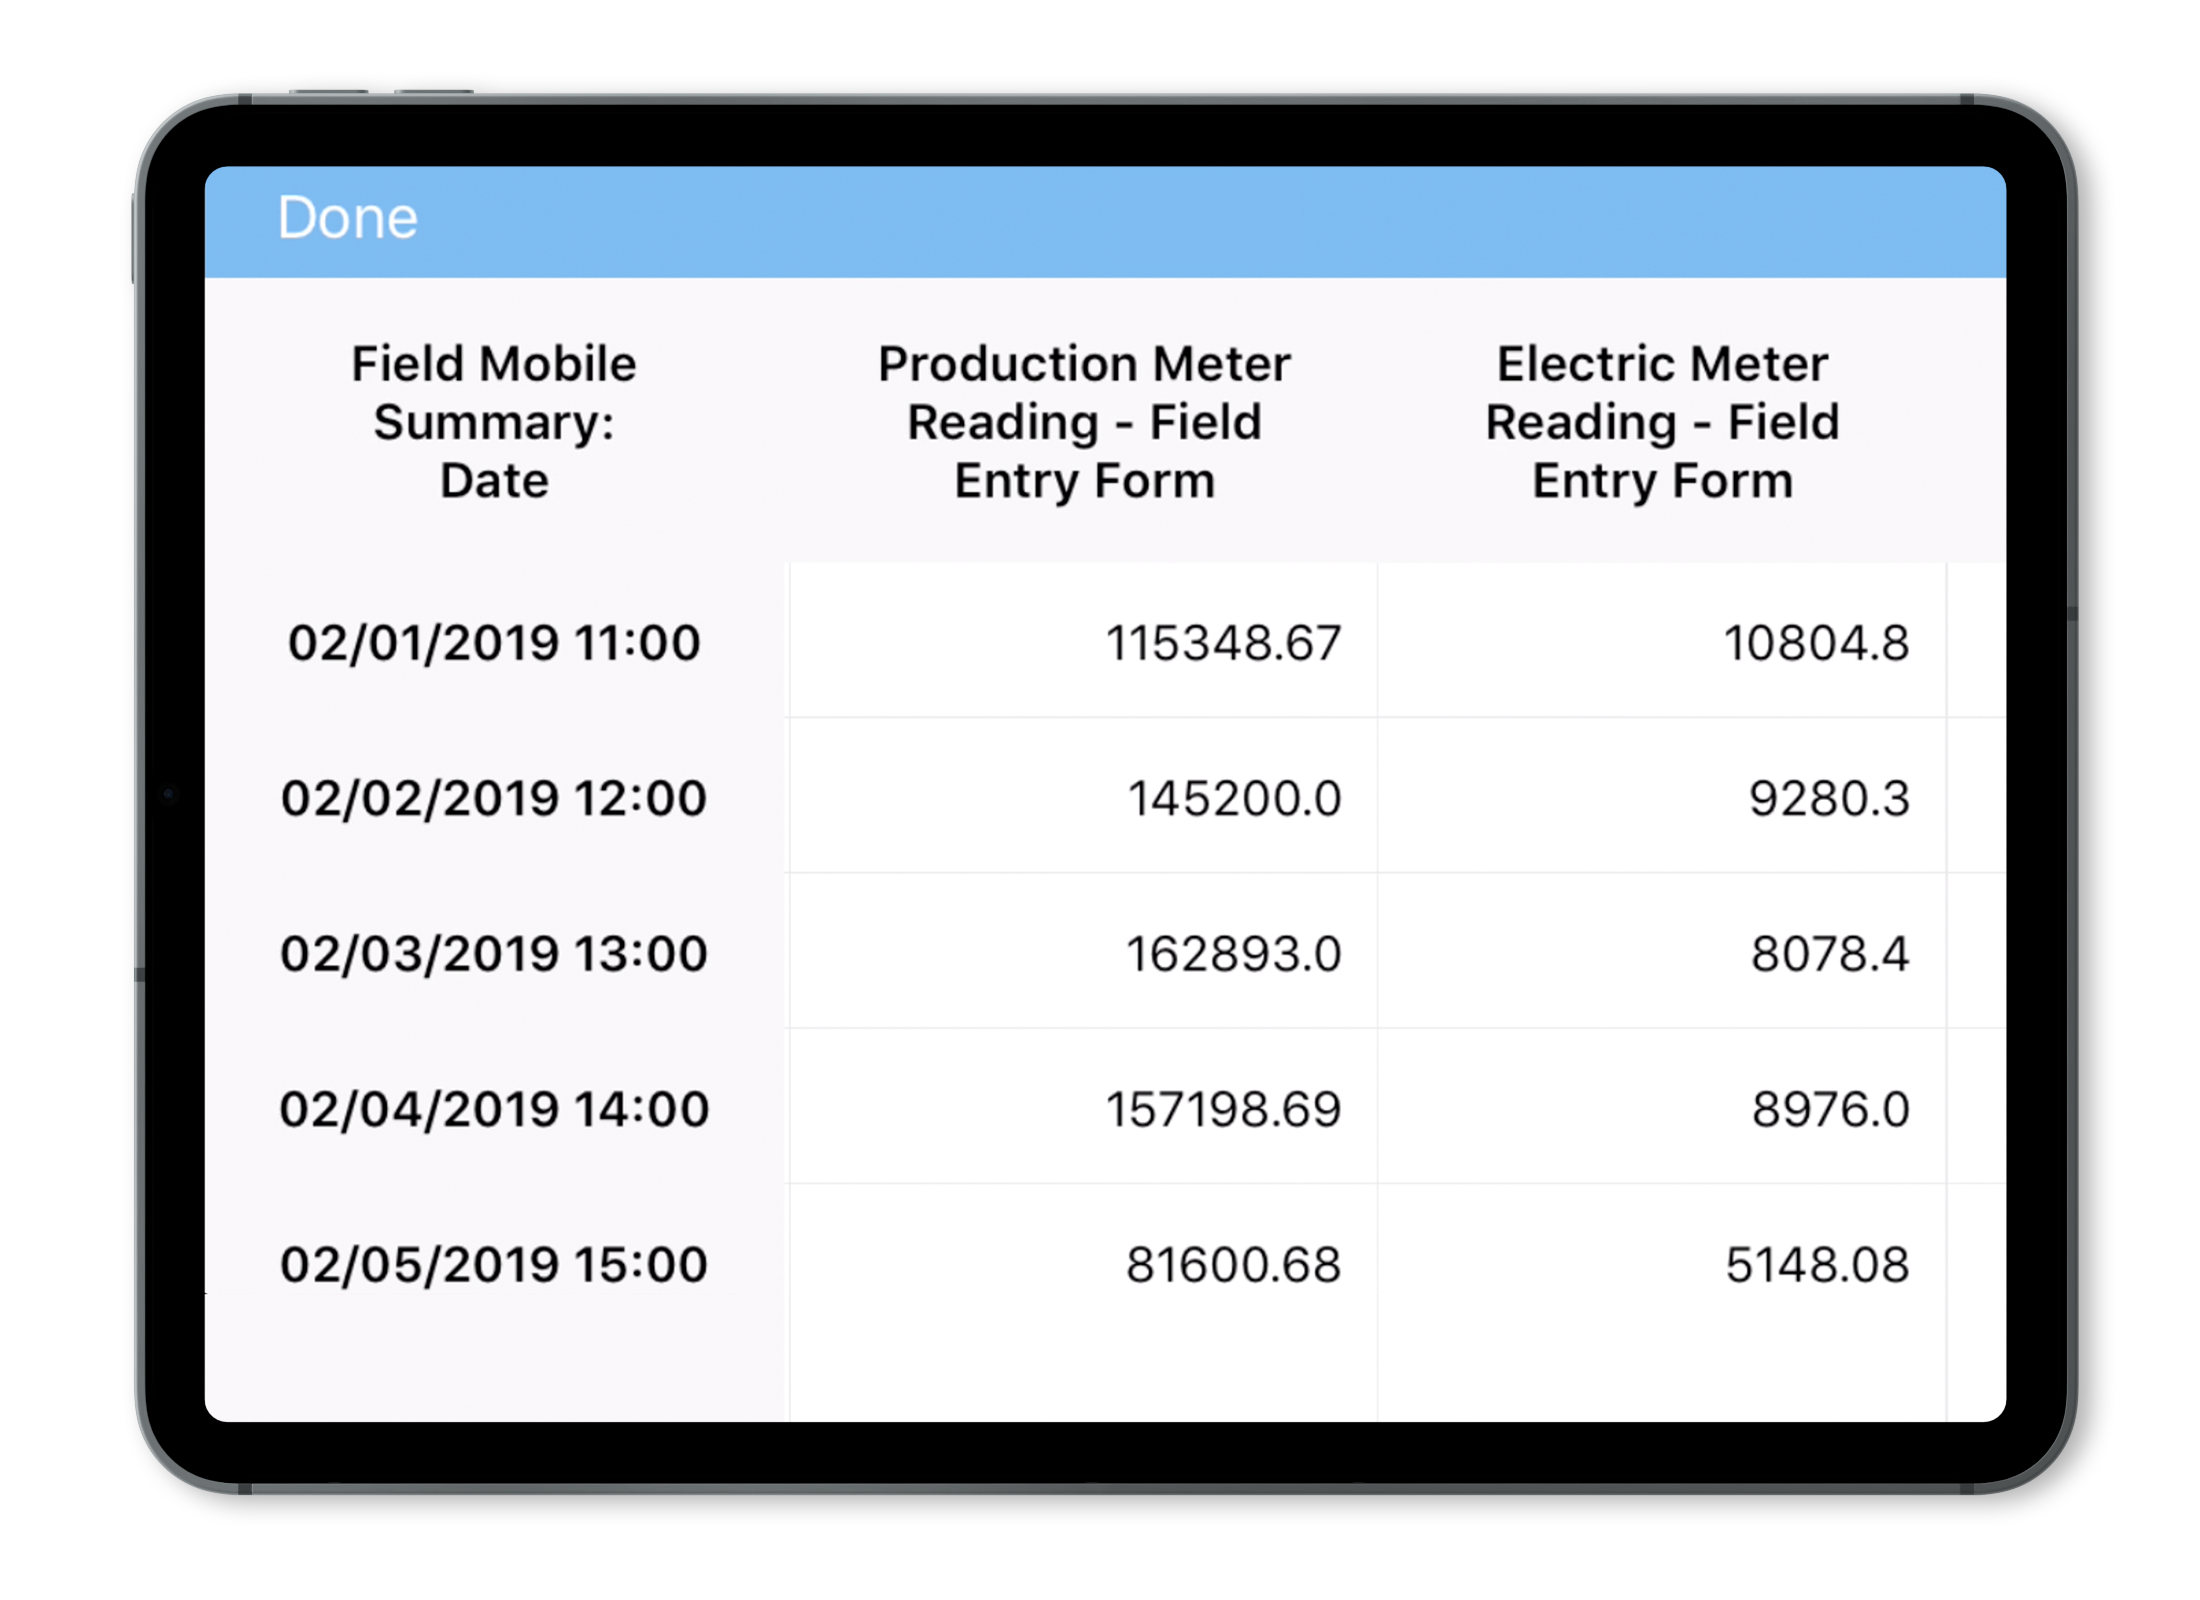
Forms with Benefits
Locus Platform is a configurable platform with standard applications that are easy to configure to customers unique requirements. One of its many strengths is its powerful form builder capable of creating simple or complex forms with simple or sophisticated logic. So for customers looking to move from paper and spreadsheet templates, it’s an excellent option to consider, especially if you require more than a simple “fill in the blank” form for transmittal using mobile devices. Best of all, the data are securely stored in a database structure for reporting and alternative business uses and analyses, compared to the almost impossible management of hundreds of spreadsheets or paper forms.
Here are some examples where sophisticated forms are integrated with a flexible database:
- Water Utilities – Tracking chlorination and aerobic digestion processes with daily inputs/outputs with a monthly summary and chart, and tracking well production across well fields.
- Water Utilities – Tracking periodic sewer discharges and water samples for permit compliance.
- Agriculture – Monitoring food processing equipment for compliance with optimum equipment operating parameters for air permits.
- Pharmaceutical/Chemical Manufacturing Facilities- Tracking EHS daily, weekly, monthly, etc. investigations and in-house audits.
- Universities – tracking chemical inventories.
- Facility Engineering – Documenting O&M activities for groundwater treatment systems.
- Electric Utilities – Monitoring water/energy/gas usage from old style meters for sustainability reporting with data entry validation.
- Refineries and Terminals – Collecting O&M, usage and wastewater data.
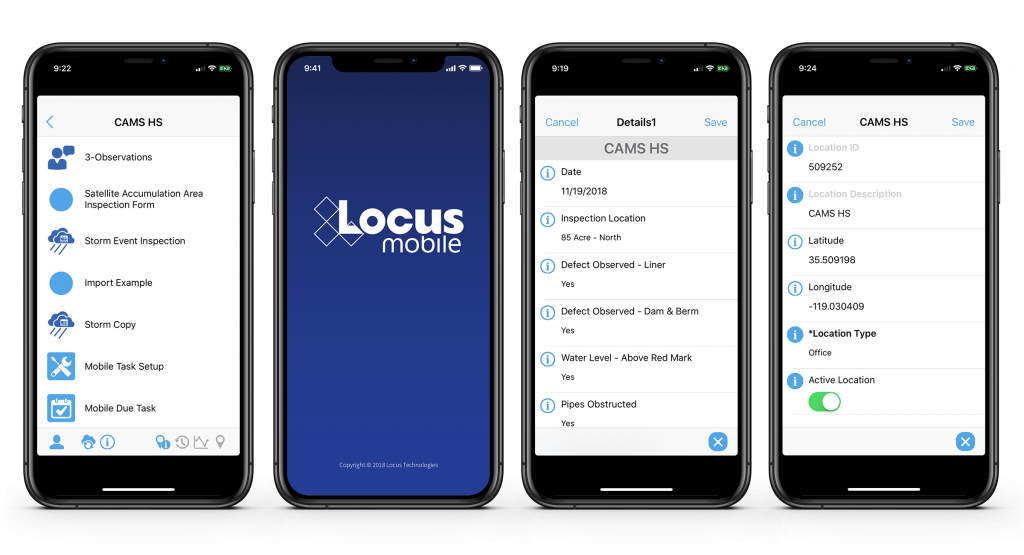
If you still rely on paper forms and template spreadsheets and are ready to streamline your process and enhance the value of your data, give us a call and we can show you a range of options that will retire the paper forms for good!
Contact us to learn more about Locus Platform
You can turbocharge your water data management by including a geographical information system (GIS) in your toolkit! Your data analysis efficiency also gets a huge boost if your data management system includes a GIS system “out of the box” because you won’t have to manually transfer data to your GIS. All your data is seamlessly available in both systems.
Not all GIS packages are created equal, though. Here are some tips to consider when looking at mapping applications for your environmental data:
1) Confirm that integration is built-in and thorough
Mapping is easy when properly integrated with your environmental database. You should not need extra filters or add-on programs to visualize your data. Look for built-in availability of features, such as “click to map”, that take the guesswork and frustration out of mapping for meaningful results.
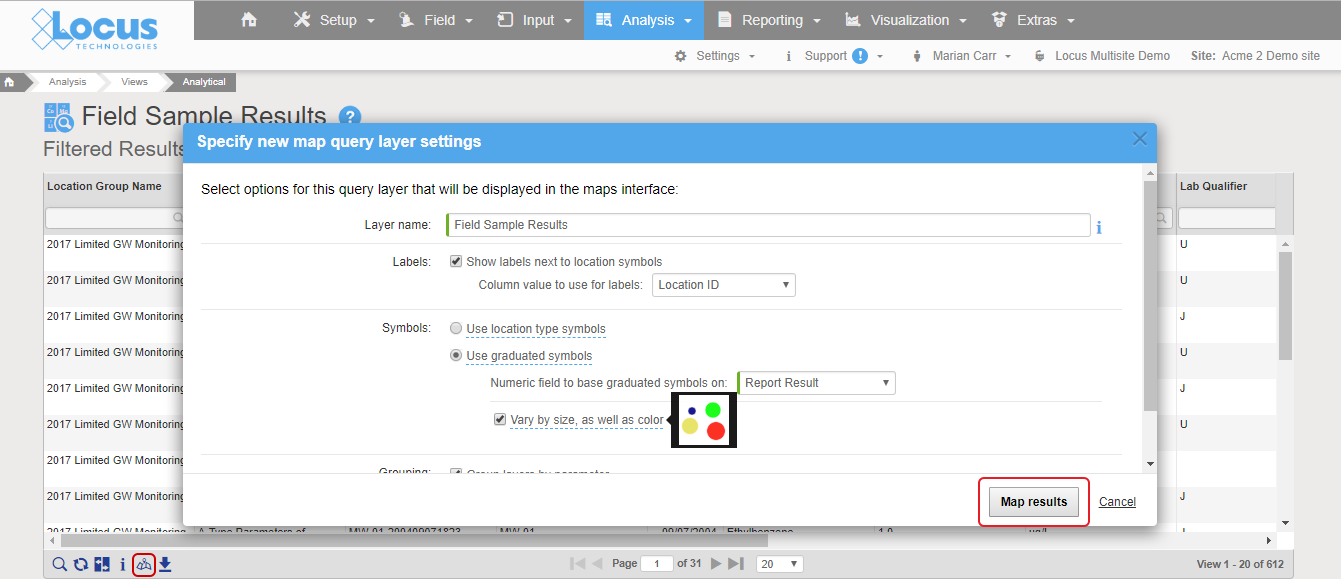
Good integration means mapping is as easy as clicking a “show on map” button. In Locus EIM, you can run a data query and click “Show results on map” icon, change the default settings if desired, and instantly launch a detailed map with a range of query layers to review all chemicals at the locations of interest.
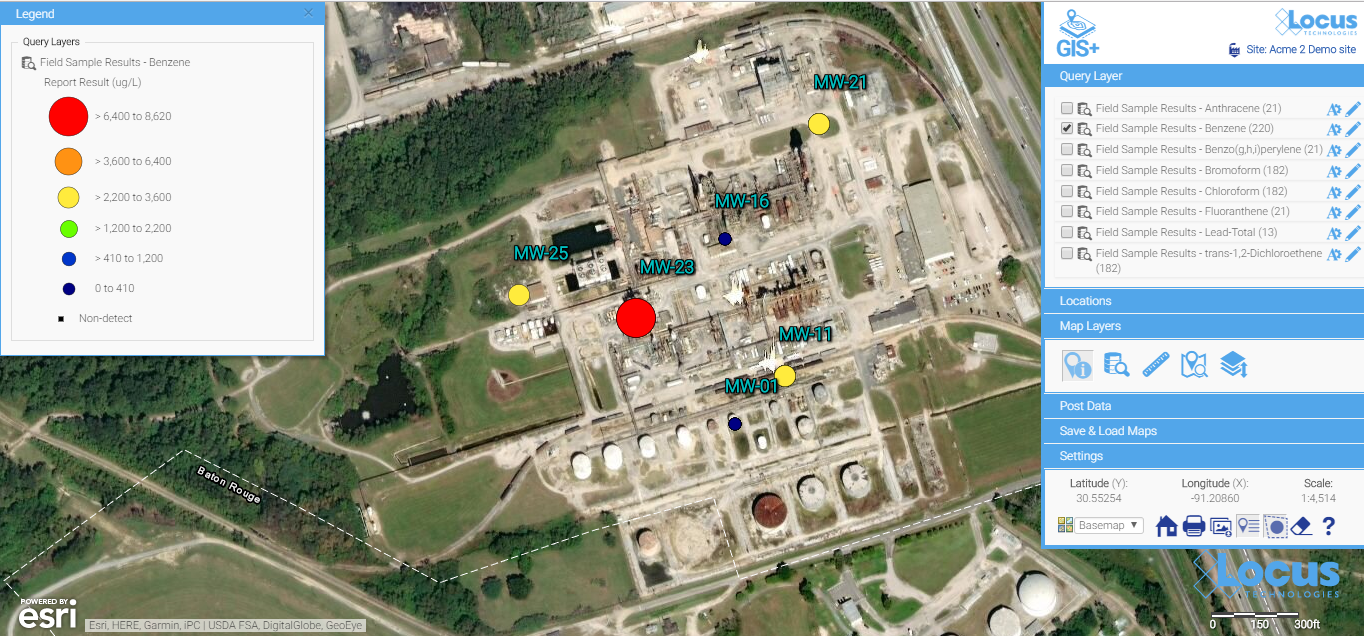
All the query results are presented as query layers, so you can review the results in detail. This map was created with the easy “show results on map” functionality, which anyone can use with no training.
2) Check for formatting customization options
Look for easy editing tools to change the label colors, sizes, fonts, positioning, and symbols. Some map backgrounds make the default label styles hard to read and diminish the utility of the map, or if you’re displaying a large quantity of data, you’ll almost certainly need to tweak some display options to make these labels more readable.
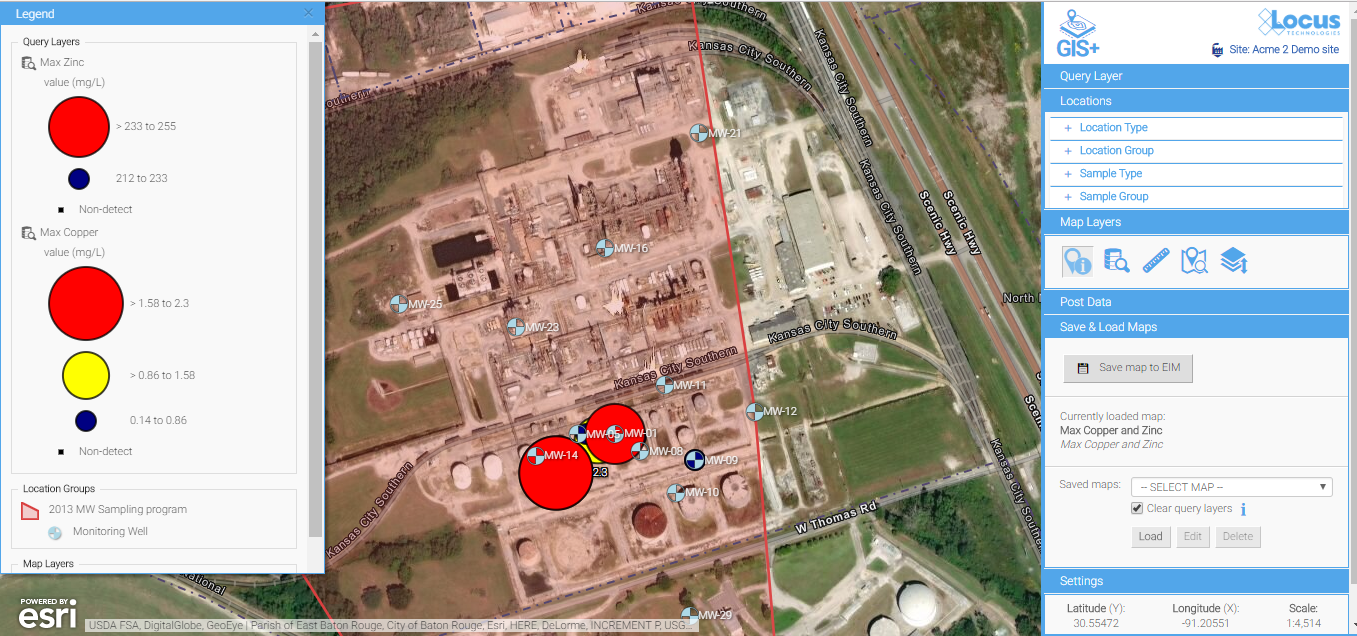
Default label styles are legible on this background, but they are a bit hard to read.
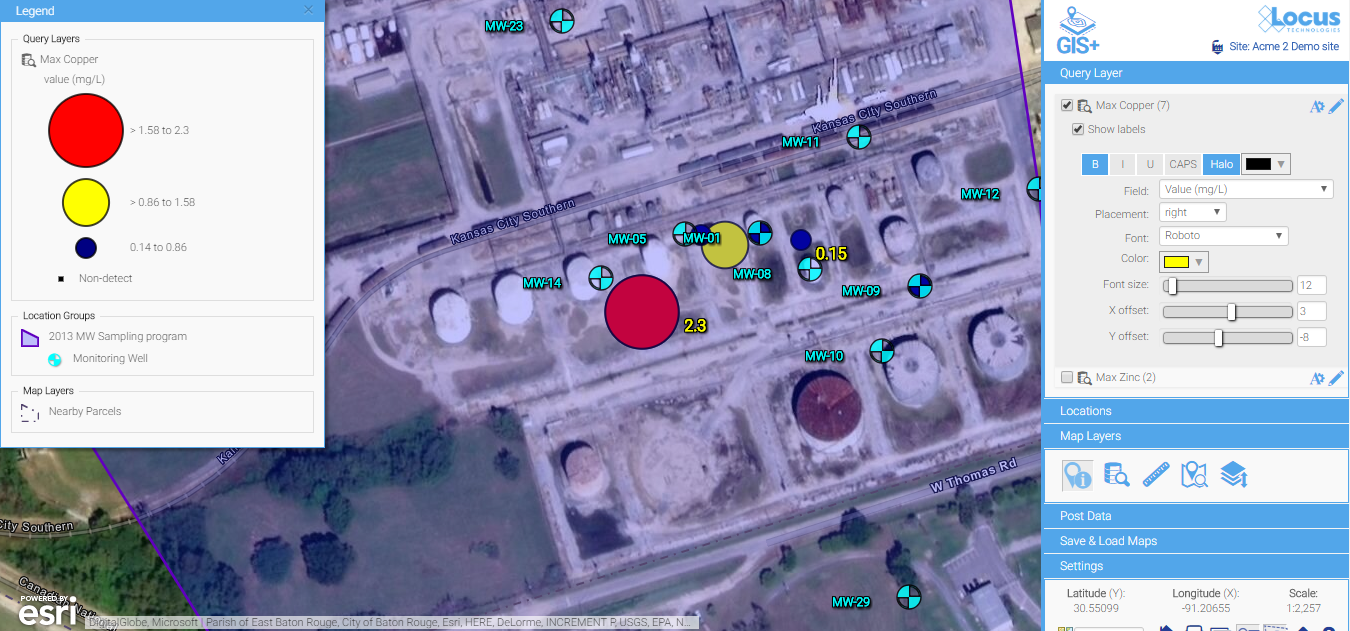
A few simple updates to the font color, font sizes, label offset, and background color make for much easier reading. Changes are made via easy-to-use menus and are instantly updated on the map, so you have total control to make a perfectly labeled map.
3) Look for built-in contouring for quick assessment of the extent of the spatial impact
Contours can be a great way to visually interpret the movement of contaminants in groundwater and is a powerful visualization tool. In the example below, you can clearly see the direction the plume is heading and the source of the problem. An integrated GIS with a contouring engine lets you go straight from a data query to a contour map—without export to external contouring or mapping packages. This is great for quick assessments for your project team.
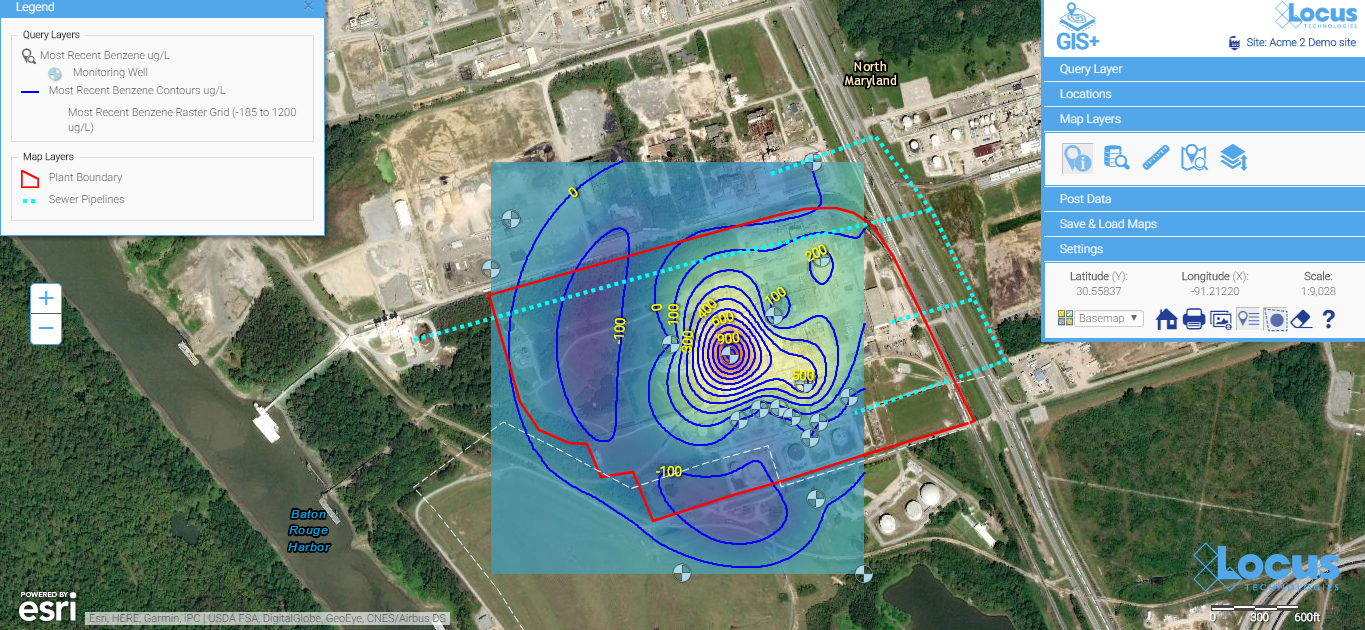
Contour maps make it easy to visualize the source and extent of the plumes. They can be easily created with environmental database management systems that include basic contouring functionality.
4) Look for something easy to use that doesn’t require staff with specialized mapping knowledge
Many companies use sophisticated and expensive mapping software for their needs. But the people running those systems are highly trained and often don’t have easy access to your environmental data. For routine data review and analysis, simple is better. Save the expensive, stand-alone GIS for wall-sized maps and complex regulatory reports.
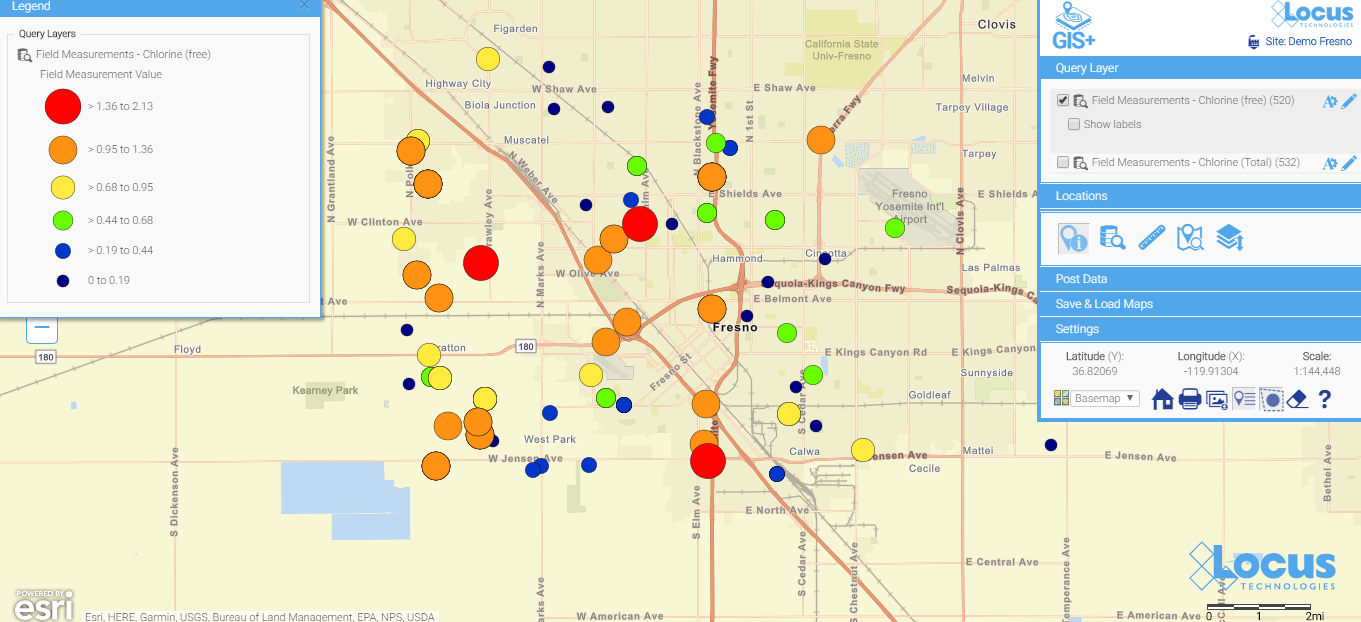
Here is a simple map (which is saved, so anyone can run it) showing today’s chlorine data in a water distribution system. You don’t have to wait for the GIS department to create a map when you use a GIS that’s integrated with your environmental database system. When data are updated daily from field readings, these maps can be incredibly helpful for operational personnel.
 See your data in new ways with Locus GIS for environmental management.
Locus offers integrated GIS/environmental data management solutions for organizations in many industries.
Find out more >
Get a demo of Locus GIS
Error: Contact form not found.
Taking the next steps
After viewing some of the many visualization possibilities in this blog, the next step is make some maps happen!
- Make sure your environmental data system has integrated mapping options.
- Make sure your sampling/evaluation/monitoring locations have a consistent set of coordinates. If you have a mixed bag of coordinate systems, you will need to standardize. Otherwise, your maps will not be meaningful. Here are some options to try, as well as some good resource sites:
- https://epsg.io/ (transformations)
- http://www.earthpoint.us/Convert.aspx (transformations)
- Start with a few easy maps—and build from there.
Happy mapping!
SAN FRANCISCO, Calif., 24 October 2017 — Locus Technologies (Locus), the industry leader in multi-tenant SaaS EHS and water quality management software, is pleased to announce that Carollo Engineers (Carollo), one of the largest firms in the country focused exclusively on water projects, selected Locus EIM SaaS as its water quality management software. Carollo also subscribed to the Locus Platform SaaS for mobile-enabled asset management.
“Managing water quality data is critical to our clients’ projects,” said Justin Sutherland, Manager of Carollo’s Water Applied Research Center (Water ARC). “Water ARC is a new service provided by Carollo that integrates and enhances our capabilities to collect this data through field analytical, pilot testing, and laboratory-based treatability testing services. Key parts of this new service will be our improved management of field analytical and pilot testing equipment, nationwide, with Locus Platform and streamlined collection and analysis of various data sources with Locus EIM. Incorporating these innovative tools in our project work will help us achieve a higher level of efficiency in managing quality data for our clients.”
Locus EIM is a comprehensive water quality management software, designed to manage mission-critical water quality and related subsurface and surface data by helping organizations gather, organize, manage, report, and visualize sampling, analytical, and subsurface data for compliance and assurance reporting. Locus’ software serves a variety of vertical markets including water, oil and gas, power-generating utilities, and food and beverage. Locus EIM and Locus Mobile pair together to create a viable modern cloud platform that is particularly well suited for water markets.
“Our mission is to help organizations like Carollo achieve their water quality management and environmental stewardship goals, by providing them the centralized software and tools to control and manage data and complex workflow process for water-related projects,” said Wes Hawthorne, President of Locus. “Our EIM cloud-based software for water quality management provides our customers with a highly scalable and a feature-rich application. It gives water companies strong analytical power, streamlined field sampling capabilities, and mobile collection tools, as well as compliance management and reporting. We are pleased Carollo will be utilizing EIM, Locus Mobile, and Locus Platform to ensure that their customers are provided with the highest quality water projects possible.”
“Corporations today want to invest into one environmental and sustainability solution that offers scalability, system flexibility, and user friendliness, while at the same time, achieve operational cost reductions and improve their environmental stewardship,” said Jennifer Peterson, Vice President of Commercial Accounts at Locus. “Our mission is to help organizations like Carollo advance their innovative technology desires for streamlining data collection and reporting goals by providing them with the software tools that help control overall environmental compliance activities and yet provide efficient, easy-to-use, scalable solutions that will grow with Carollo.”
ABOUT CAROLLO ENGINEERS
At Carollo Engineers, water is our focus, our business, and our passion. For more than 80 years, Carollo has provided a full range of innovative planning, design, and construction management services to meet the water and wastewater needs of municipalities, public agencies, private developers, and industrial firms. To learn more about how Carollo is “Working Wonders With Water®,” visit www.carollo.com.
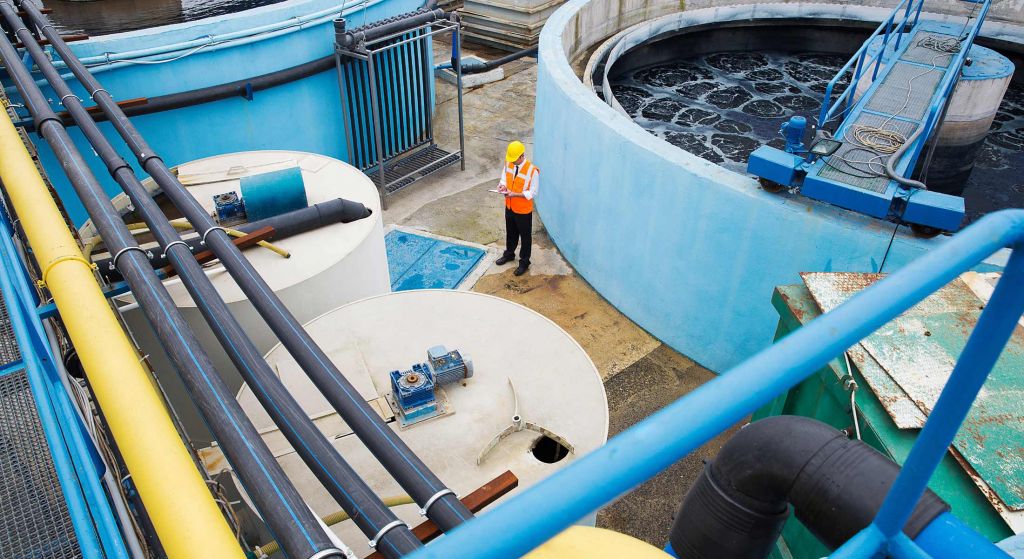
Improved wastewater distribution and treatment technologies have largely eradicated once-common waterborne diseases.
Water supply and distribution were ranked as the fourth greatest engineering achievement of the 20th century by the National Academy of Engineering (NAE), and rightfully so.
Developments in water management have drastically improved public health and safety. In the early 1900s, for example, dysentery and diarrhea, both waterborne diseases, were the third largest cause of death in the United States (Wulf, 2000).
Currently, incidences of waterborne diseases in the United States are minimal, thanks in large measure to improved water distribution and treatment technologies. Additionally, cities are now less susceptible to flooding due to the development and implementation of storm drain systems. The current paradigm in urban water management entails a centralized drinking water plant, connected to individual households through an underground network of pipes, and a sewer that carries the wastewater to a centralized treatment plant for further discharge into a natural water stream. This system has permitted significant progress in our society.
Our clean water supply and sanitation systems may be endangered
NAE also says that providing access to clean water is the fifth greatest challenge that we will face this century. Despite all its positive qualities, the urban water management paradigm has some serious limitations that are likely to get worse in the future due to increasing urban population, expansion of paved areas, scarcity of water, and climate change:
- Reliance on large quantities of water
Centralized systems depend heavily on large quantities of water— an already scarce resource that will likely become even more so, with increasing population and climate change. Population growth also requires increasing the capacity of the water treatment plants and expanding the already-complex network of water lines. - More runoff
Fast-growing cities mean larger paved areas and, therefore, higher runoff during rain events. Runoff, which carries pollutants from the street surface, is difficult and expensive to contain and treat. Many cities— including some cities here in the San Francisco Bay Area— discharge their storm water runoff directly to the sea, with minimal treatment. If you live in the San Francisco Bay area, you may have noticed blue signs posted next to storm drains, which read “Drains to the Bay”. Runoff is expected to become an even bigger issue due to the variability in rainfall caused by climate change. - Expensive operation and maintenance
Extensive underground pipe networks for drinking and wastewater are expensive to operate and maintain. They make urban planning more difficult because pipe locations are not always known, and multiple independent agencies and companies run pipes and cables underground. Furthermore, the lead poisoning in Flint, Michigan, shows us that poorly maintained old pipes can present a serious public health issue. - Leaky pipes
An estimated 10 – 40% of the global urban water supply is lost due to leaky pipes, which are difficult and costly to repair (Larsen et al., 2016).. - Lost nutrients
Centralized water systems are not particularly efficient in recovering the nutrients that wastewater offers (i.e., nitrogen and phosphorous).
In search of a more sustainable solution
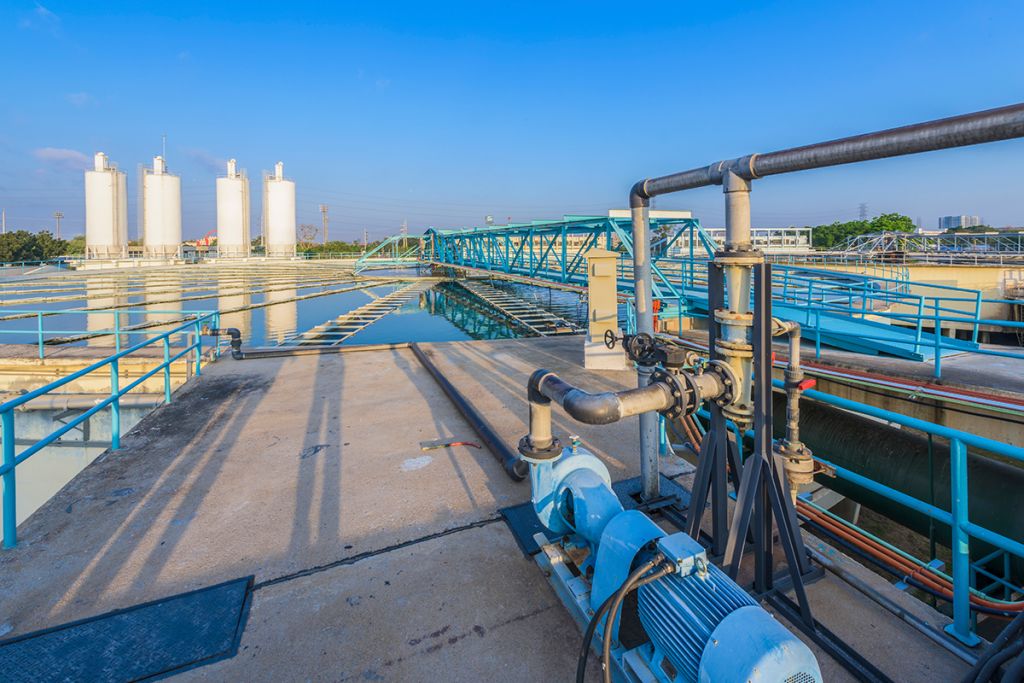
Centralized treatment plants have vastly improved public health, but perhaps a more decentralized urban water management system would address some of their shortcomings.
Across the country and the world, innovative teams have proposed and implemented multiple improvements and alternatives to the current urban water management paradigm. But there is still no widely-accepted solution to the current and future challenges in urban water management.
A real, sustainable solution would involve a combination of measures adapted to local needs. One promising approach to replace or supplement our current systems is to decentralize the management of urban water. This means treating the wastewater close to the source in small-scale treatment systems, instead of transporting it through a complex network of pipes to a centralized treatment plant. Decentralization offers a series of advantages— such as less reliance on pipes, easier coverage expansion in rapidly growing cities, lower variability in the loading of the treatment systems, and efficient utilization of the wastewater as a resource.
Decentralized systems, for example, offer the opportunity to separate blackwater (urine, faeces, flushwater), brownwater (faeces and flushwater), and greywater (water from washing food, clothes, and dishware, and from bathing)— which would be very complicated in a centralized system, due to the need to install separate pipelines for each.
Separating these sources makes wastewater treatment more efficient, as each of them require different extents of treatment. It also opens the possibility of water reuse. For example, greywater can easily be treated at a local scale and reused, therefore saving water and energy. Source separation also provides the opportunity to recover nutrients from human waste more efficiently. Urine, for example, contains a high concentration of nitrogen, which is lost as nitrogen gas in most centralized treatment plants. By separating the urine in a decentralized system, nitrogen could be recovered.
Nevertheless, decentralized systems have their own challenges. These include the complexity of operating, maintaining, and inspecting a network of treatment systems; the development of reliable and robust small-scale systems; and public acceptance. Decentralized urban water management is still in its early development, but it’s an idea that certainly deserves further consideration.
Why now?
Historically, major innovations in urban water management have been triggered by crises: the overpopulation of Ancient Rome led to the development of large scale water distribution systems; the cholera and typhoid fever outbreaks in Europe led to the development of disinfection; and the severe pollution of water stream led to development and implementation of wastewater treatment (Sedlak, 2014). With increasing world population, rapid urbanization, climate change, and a growing scarcity of resources, our current urban water management systems will be under increasingly significant stress. It is crucial to our health, our safety, and the overall well-being of our society that we anticipate the challenges and start innovating now.
—
References
Hansen, R. D. (n.d.). Water and Wastewater Systems in Imperial Rome. [online] <Accessed 16 December 2016>
Larsen, T. A., Hoffmann, S., Lüthi, C., Truffer, B., Maurer, M. (2016). Emerging solutions to the water challenges of an urbanizing world. Science, 352 (6288), pp. 928-933.
National Academy of Engineering. (2008). Grand Challenges for Engineering. National Academy of Science.
San Francisco Public Utilities Commission. (n.d.). Only Drain Down the Rain. [online] <Accessed on 16 December 2016>
Sedlak, D. (2014). Water 4.0: The Past, Present, and Future of the World’s Most Vital Resource. Yale University Press.
Tilley, E., Ulrich, L., Lüthi, C., Reymond, P., Schertenleib, R., Zurbrügg C. (2014). Compendium of Sanitation Systems and Technologies, 2nd Revised Edition. Swiss Federal Institute of Aquatic Science and Technology (Eawag), Dübendorf.
Wulf, W. A. (2000). Great Achievements and Grand Challenges. The Bridge, 30 (3&4), pp. 5-10.
—
Still looking for the right EHS software to revolutionize your environmental and compliance initiatives? Book a demo with us today!

About guest blogger— Victor Huanambal, Locus Technologies
Victor Huanambal has been working at Locus for close to two years as an environmental engineer. He graduated from the University of California, Berkeley, in 2014.
At Locus, he is mostly involved in projects related to groundwater remediation, environmental compliance, and greenhouse gases verification.
Locus Technologies
299 Fairchild Drive
Mountain View, CA 94043
P: +1 (650) 960-1640
F: +1 (415) 360-5889
Locus Technologies provides cloud-based environmental software and mobile solutions for EHS, sustainability management, GHG reporting, water quality management, risk management, and analytical, geologic, and ecologic environmental data management.

