Executive Summary
In the late 1980s, environmental engineers faced an overwhelming “data explosion” at contaminated sites, collecting millions of data points with little to show in actual cleanups. Visionaries like Neno Duplan and Gregory Buckle anticipated that emerging technologies, such as artificial intelligence (AI), machine learning (ML), expert systems (ES), automation, and advanced databases, would be key to transforming this raw data into real-time decision-making tools. In their pioneering 1989 article, “Hazardous Data Explosion,” they predicted that “expert systems… employ methods of artificial intelligence for interpreting and processing large bodies of information,” enabling on-site engineers to make immediate, informed decisions about sampling needs and testing redundancy. By 1992, in “Taming Environmental Data,” they showcased an early realization of this vision: an integrated Environmental Database Management System that automated data handling from field to lab to report generation.
Over three decades later, many of those bold predictions have proven remarkably accurate. Environmental data practices have evolved from paper printouts and siloed spreadsheets to cloud-based platforms that handle tens of millions of records in real-time. Early adoption of AI-like tools and automation in the 1990s—such as the IT Corporation’s ITEMS system—paved the way for today’s sophisticated environmental information management systems. Modern platforms [exemplified by Locus Technologies (Locus) EIM] now harness big data and cloud computing not only to store and visualize environmental data and automate compliance submittals but also to train AI models for predictive analytics. These models can identify pollution hotspots, forecast the spread of contamination, and even flag potential health risk clusters from anonymized, georeferenced datasets that span numerous sites and years of monitoring.
Ref: Civil Engineering Magazine, ASCE, 1989
Ref: Civil Engineering Magazine, ASCE, 1992
The human and environmental stakes underscore why getting this right is so important. High-profile environmental tragedies, dramatically depicted in films like Dark Waters, Erin Brockovich, and A Civil Action, reveal the cost of mismanaging or ignoring environmental data. They remind us that behind every dataset of toxins or emissions are real communities and ecosystems at risk. Similarly, the recent film Oppenheimer serves as a poignant cultural reminder of the immense responsibility scientists and engineers carry, especially when handling data that could determine life-or-death outcomes.
This article reviews the prescient forecasts from 1989 and 1992, examines how environmental data management and compliance evolved in the intervening years, and analyzes how those early concepts are manifest in today’s technology. Accessible language and clear examples, from the Rocky Mountain Arsenal to the Fresh Kills Landfill to Los Alamos National Laboratory, illustrate the journey from vision to reality. In doing so, we highlight the importance of responsible data stewardship and how companies like Locus Technologies have led with foresight, ensuring that past mistakes are not repeated and that environmental data truly leads to environmental protection.
Visionary Predictions in the Late 1980s
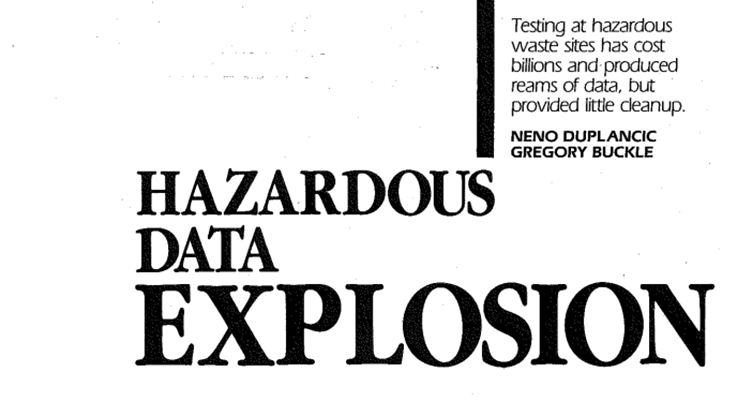
In December 1989, Civil Engineering magazine published an article titled “Hazardous Data Explosion” by Neno Duplan and Gregory Buckle. It painted a vivid picture of a new challenge confronting environmental engineers: massive volumes of data pouring out of hazardous waste site investigations, to the point of overwhelming the people and processes attempting to make sense of it. The authors noted that throughout the 1980s, billions of dollars had been spent on testing at toxic waste sites, producing “reams of data, but provided little cleanup.” In other words, gathering data had become easier than interpreting it effectively, and thus, contaminated sites languished without remediation, despite the extensive information collected.
Why was this happening? Duplan and Buckle explained that hazardous waste site characterization differed fundamentally from traditional civil engineering investigations. Instead of a straightforward set of soil borings and lab tests to design a foundation, environmental projects had to address dozens (sometimes hundreds) of chemical contaminants, involve multidisciplinary experts (such as chemists, biologists, geologists, and hydrologists), and satisfy stringent regulations and legal scrutiny. A single Superfund site could generate data on geology, hydrology, soil chemistry, groundwater contamination plumes, air quality, toxicology, and more. By the late 1980s, this “dizzying amount of data” had become one of the most distinctive features – and problems – of the hazardous waste cleanup industry.
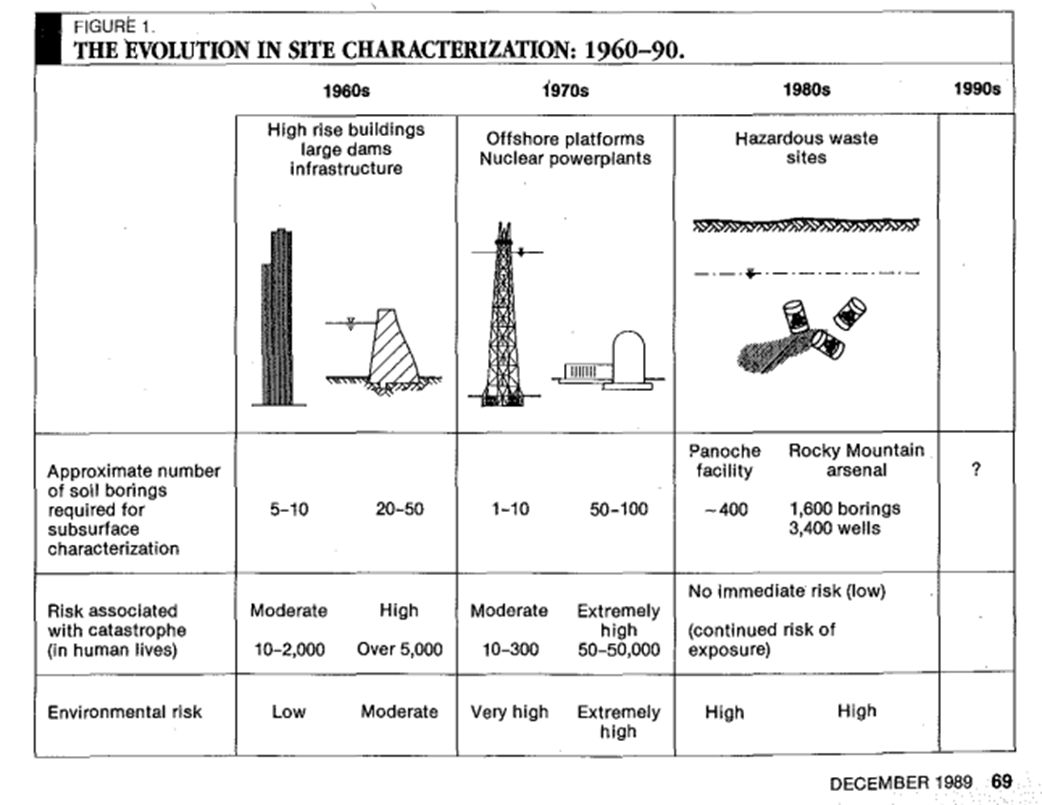
Figure 1: The Figure illustrating data growth in the site characterization process, 1989
Rather than simply lamenting the problem, the 1989 article offered a visionary solution: expert systems and automation. The authors looked to other technical fields where “expert systems” (early AI-driven software) were already helping to interpret large datasets. They predicted that applying similar AI methods to environmental data could revolutionize site investigations. In a particularly forward-looking statement, they wrote that “expert systems… employ methods of artificial intelligence for interpreting and processing large bodies of information”. By using AI to automate the site characterization process, decisions about how many samples to collect and which tests to run can be made in real-time, while work proceeds at the site. In essence, Duplan and Buckle envisioned an intelligent computer system that would sift through incoming field and lab data in real-time, instantly recognize patterns or thresholds, and guide engineers to focus on the most relevant information. This would ensure that sampling became more efficient, avoiding the knee-jerk approach of studying everything endlessly, and that overworked humans wouldn’t miss critical signals in the data.
Such ideas were truly visionary for 1989. This was an era when desktop computers were primitive by modern standards, and “artificial intelligence” primarily referred to rule-based expert systems or research projects led by Carnegie Mellon, rather than the machine learning we are familiar with today. Yet, these authors foresaw that the only way to keep up with the coming data deluge was to leverage AI techniques. They believed that by the 1990s, many of the hurdles engineers faced in reviewing site data would be eliminated with the implementation of expert systems. They even predicted the ultimate payoff: “In short, automation could help ensure that the mistakes of the 1980s will not be repeated in the ’90s: namely, that the dollars spent and piles of data collected will translate into more cleaned-up sites.” This call to action, to turn data into decisions and decisions into actual cleanup, encapsulated a crucial insight that resonates to this day in environmental management.
Evolution of Environmental Data Management (1989–1992)
Between 1989 and 1992, the data problem in environmental projects worsened, but the seeds of a solution also began to sprout. It is illuminating to compare two high-profile projects discussed in the 1989 and 1992 articles: the U.S. Army’s Rocky Mountain Arsenal near Denver and New York’s Fresh Kills Landfill on Staten Island. These examples demonstrate not only the increasing volume of environmental data but also the adoption of new tools to manage this growth.
Rocky Mountain Arsenal: Data Overload in the 1980s
Rocky Mountain Arsenal (RMA) was one of the most notorious hazardous waste sites in the country by the late 1980s: a 27-square-mile area contaminated by decades of chemical weapons production and waste disposal. Duplan and Buckle highlighted RMA as “a striking example of the data explosion in action.” By 1989, an astonishing 3,400 soil borings had been drilled and 1,600 monitoring wells installed at RMA to characterize the contamination. This extensive field investigation yielded an enormous number of samples. The authors broke down a simple estimate: if each boring produced 10 soil samples and at least one water sample was taken from each well, and if those samples were tested for around five geotechnical properties and 125 chemical parameters each (not unusual, as the EPA’s priority pollutant list alone was 127 chemicals long), the result would be about 2.5 million data points from the initial round of sampling. This was an unprecedented volume of environmental data for a single site. It underlined their point that traditional methods were being pushed to the breaking point. Even after all that data collection, additional investigations were still being planned at RMA – illustrating the paradox of “more data ≠ , more clarity” at the time.
Such a massive dataset was incredibly challenging to manage with the technology of the late 1980s. Data from labs might come back in printed reports or basic digital files, which then had to be manually entered into spreadsheets or databases. Engineers would sift through printouts to find, for example, all results above a certain threshold, or laboriously plot trends on graph paper. In summary, Rocky Mountain Arsenal showcased the late-80s scenario: critical environmental decisions needed to be made (how far had the groundwater plume spread? Was the contamination getting worse or stabilizing?), but the sheer quantity of data made timely analysis a nightmare. The 1989 article used RMA to argue that this situation was untenable without new approaches.
Fresh Kills Landfill: Toward Data Taming in the Early 1990s
By August 1992, when Duplan and Buckle wrote “Taming Environmental Data,” the state of the art had advanced. They reported on a project at Fresh Kills Landfill in New York, then the world’s largest landfill, which demonstrated how improved data management tools were being applied to a complex environmental challenge. The Fresh Kills investigations involved an even broader scope of monitoring: engineers had to analyze 288 different parameters (contaminants and water quality indicators) in samples from approximately 180 groundwater wells, 17 surface water stations, and roughly 200 soil borings every quarter. In short, each quarter resulted in the addition of hundreds of new samples and thousands of new measurements, ranging from heavy metals and organic chemicals to pH and other indicators, all of which needed to be stored, validated, compared, and reported.
What made Fresh Kills different from RMA was the use of a new Integrated Environmental Data System to handle this flood of information. Duplan and Buckle described the IT Corporation’s Environmental Database Management System (ITEMS), which they developed and used to centrally store and manage “all of the analytical data, boring data, and well construction data” for the project from a single database. Instead of data being scattered across separate files and formats, everything, from well logs to lab chemistry results, was consolidated into a single unified database. Just a few years after the RMA experience, this was a significant evolution. It meant that an engineer or scientist could query a single system to retrieve exactly the data needed, for example, pulling up the complete history of benzene measurements in a particular well, or generating a map of lead concentrations across the site, without manually collating information from dozens of reports.
The comparison between RMA and Fresh Kills highlights a significant shift between the late 1980s and early 1990s in environmental data practice:
- Data Volume: Both projects generated vast amounts of data; however, by 1992, the volume was not only huge but also multidimensional, encompassing hundreds of parameters, various media, and multiple locations over time. The complexity was growing.
- Tools: In 1989, data management was ad-hoc; by 1992, custom database systems were in place to streamline data handling.
- Mindset: There was a growing recognition that collecting data was not enough — one had to manage it effectively. The very title “Taming Environmental Data” suggests a new focus on harnessing data for insight, rather than being overwhelmed by it.
It’s worth noting that the Fresh Kills Landfill project and similar efforts in the early ’90s were early precursors to what we now call “big data” in environmental science. The groundwork was being laid to handle enormous datasets systematically for their time. The evolution between 1989 and 1992 can be summarized as a shift from data-rich and information-poor to data-rich but with improved tools for extracting information. In the next section, we will delve into the specifics of one of those early tools, the ITEMS system, which exemplified how AI and automation were being integrated with environmental databases.
Neno Duplan
Founder & CEO
As Founder and CEO of Locus Technologies, Dr. Duplan spent his career combining his understanding of environmental science with a vision of how to gather, aggregate, organize, and analyze environmental data to help organizations better manage and report their environmental and sustainability footprints. During the 1980’s, while conducting research as a graduate student at Carnegie Mellon, Dr. Duplan developed the first prototype system for an environmental information management database. This discovery eventually lead to the formation of Locus Technologies in 1997.
As technology evolved and new guidelines for environmental stewardship expanded, so has the vision Dr. Duplan has held for Locus. With the company’s deployment of the world’s first commercial Software-as-Service (SaaS) product for environmental information management in 1999 to the Locus Mobile solution in 2014, today Dr. Duplan continues to lead and challenge his team to be the leading provider of cloud-based EH&S and sustainability software.
Dr. Duplan holds a Ph.D. in Civil Engineering from the University of Zagreb, Croatia, an M.S. in Civil Engineering from Carnegie-Mellon, and a B.S. in Civil Engineering from the University of Split, Croatia. He also attended advanced Management Training at Stanford University.
Locus is the only self-funded water, air, soil, biological, energy, and waste EHS software company that is still owned and managed by its founder. The brightest minds in environmental science, embodied carbon, CO2 emissions, refrigerants, and PFAS hang their hats at Locus, and they’ve helped us to become a market leader in EHS software. Every client-facing employee at Locus has an advanced degree in science or professional EHS experience, and they incubate new ideas every day – such as how machine learning, AI, blockchain, and the Internet of Things will up the ante for EHS software, ESG, and sustainability.