The Past, Present, and Future of EHS & ESG

To celebrate a milestone 25 years of success in EHS and ESG software development, we sat down with Locus President, Wes Hawthorne for a brief discussion. In this post, we ask him a series of questions highlighting the past, present and future of EHS and ESG.

1. What are the greatest challenges that environmental professionals are facing?

One of the persistent challenges we’ve seen for the past 25 years is that the responsibilities of environmental professionals are continually expanding. Previously, almost all environmental work was localized, with facility-level permits for air, water, waste, etc. That has expanded over the years to include new regulations and reporting requirements for sustainability, social metrics, and other new compliance areas, while the old facility-level programs still continue. This has led to more pressure on environmental managers to keep up with these programs, and increased reliance on tools to manage that information. That’s where Locus has always focused our effort, to make that ever-expanding workload more manageable with modern solutions.

2. What are the most interesting trends in EHS and ESG?

The current flood of interest in ESG is certainly notable as far as bringing corporate attention to the environmental field, as well as having requirements originate from the SEC here in the US. We have become accustomed to managing oversight from multiple regulatory bodies at the local, state, and federal level, but SEC would be a newcomer in our line of work. Their involvement will be accompanied by a range of new requirements that are common for the financial world, but would be unfamiliar to environmental staff.

Across other EHS fields, we are seeing increased demand for transparency in EHS functions. Overall, this is a positive move, as it brings more attention to EHS issues and develops a better EHS culture within organizations. But this also drives the need for better tools to make EHS information readily available across all levels of the organization.

3. What are the most disruptive technologies available today?

As far as technologies, the ones most likely to have significant impact in the environmental field are ones that don’t require a significant capital investment. Although there are definitely some practical advantages to installing smart monitoring devices and other new technologies, procuring the funding for those purchases is often difficult for environmental professionals. Fortunately, there are still many technologies that have already been implemented successfully in other fields, but only need to be adapted for environmental purposes. Even simple changes like using web-based software in place of spreadsheets can have a huge impact on efficiency. And we haven’t yet seen the full impact of the proliferation of mobile devices on EHS functions. We are still working on new ways to take advantage of mobile devices for data collection, analysis, and communication purposes.

4. What do you think are the biggest innovations of the last 25 years in our field?

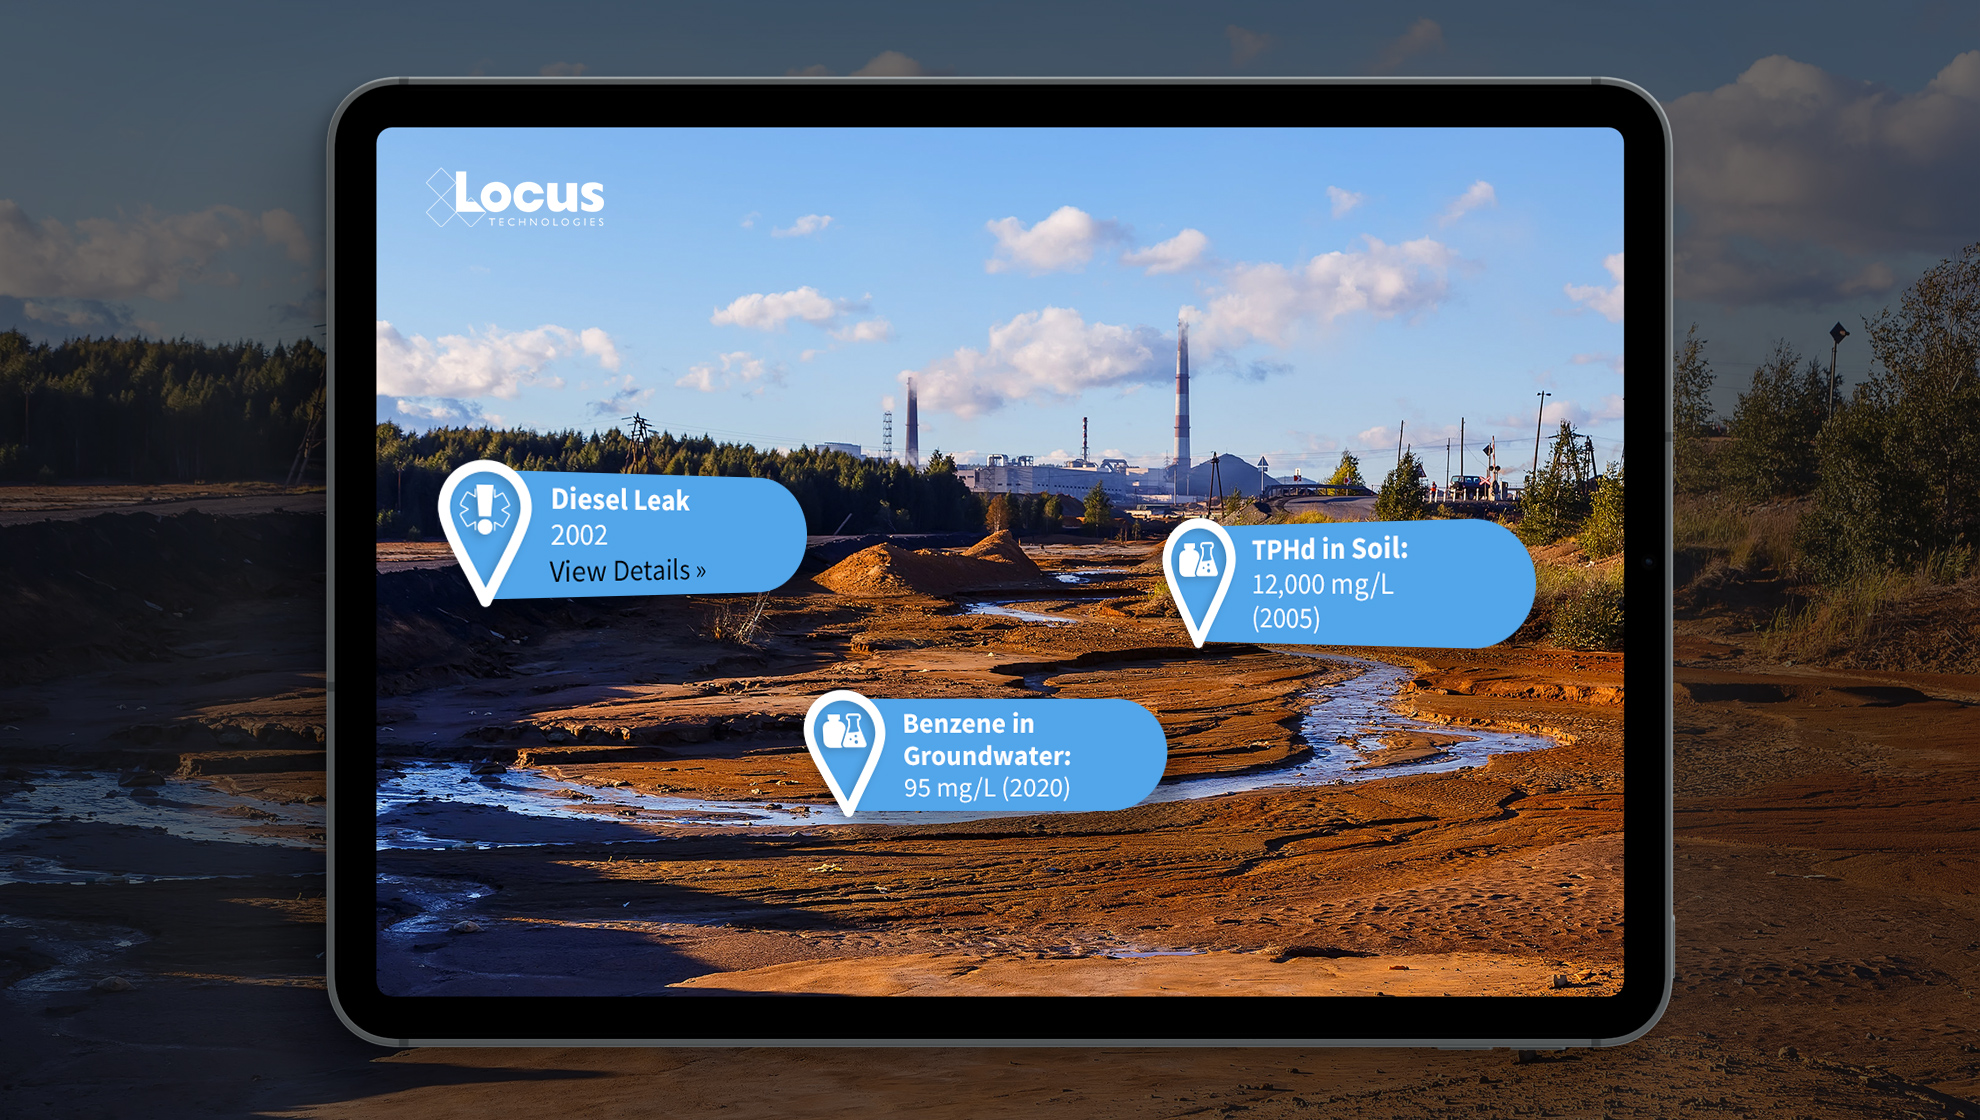
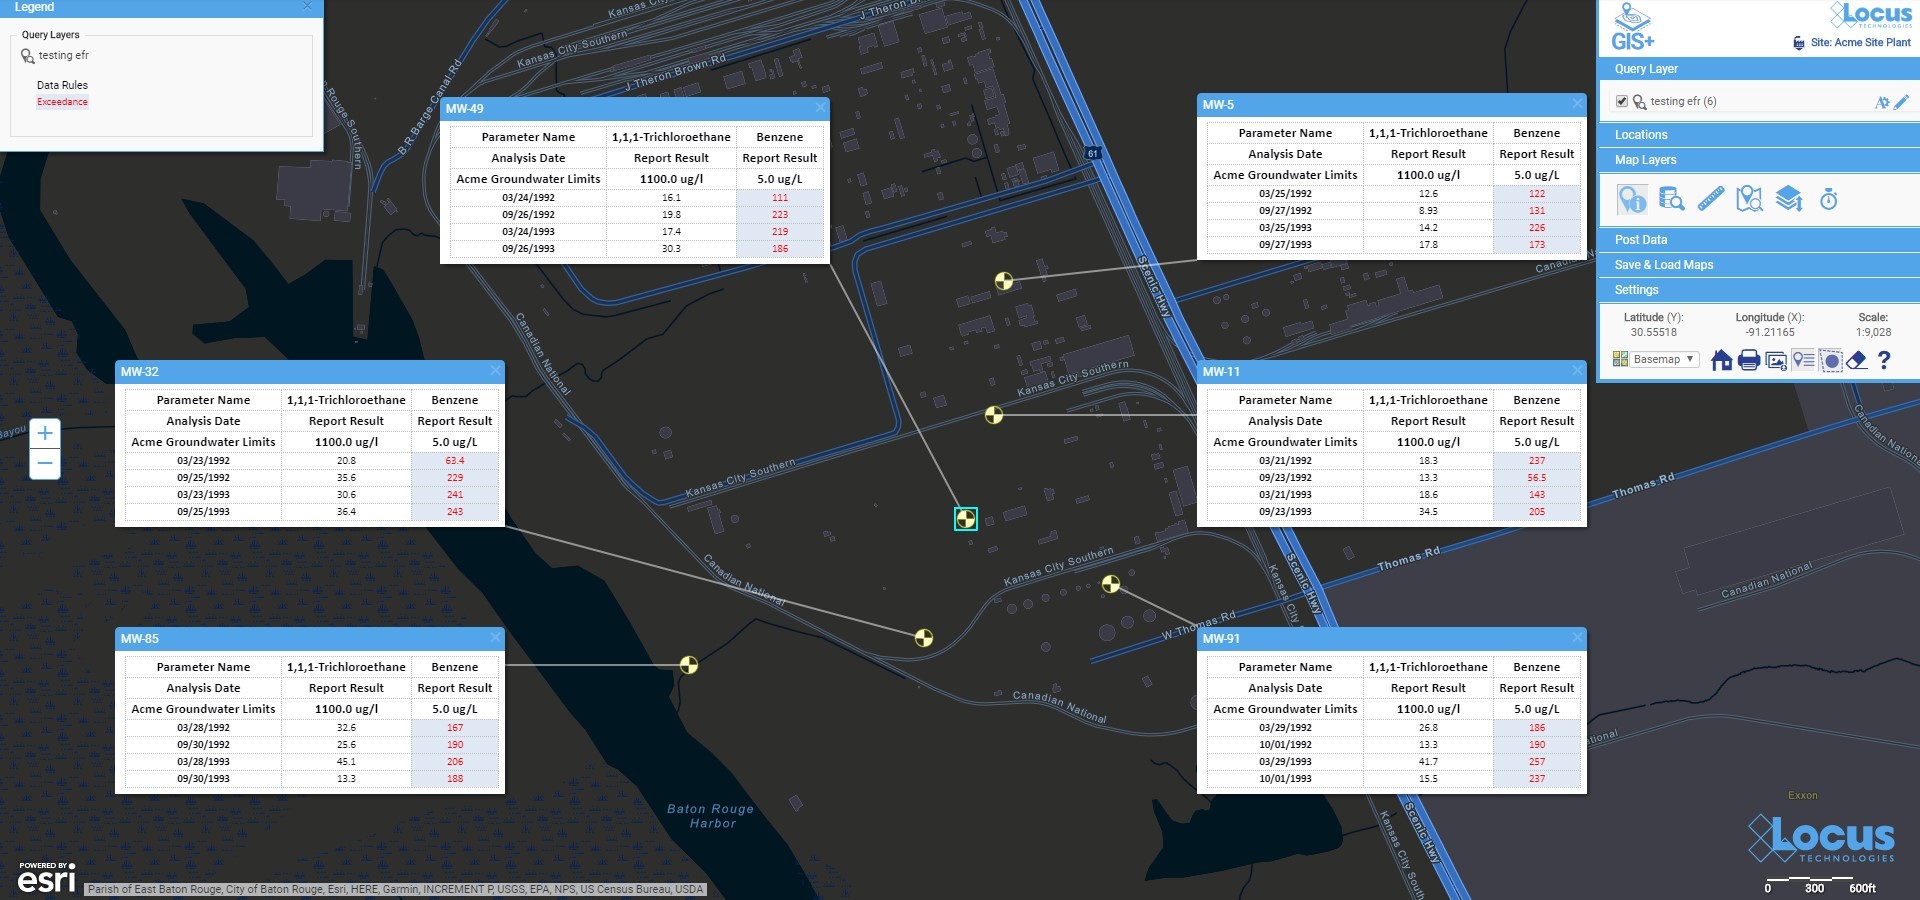
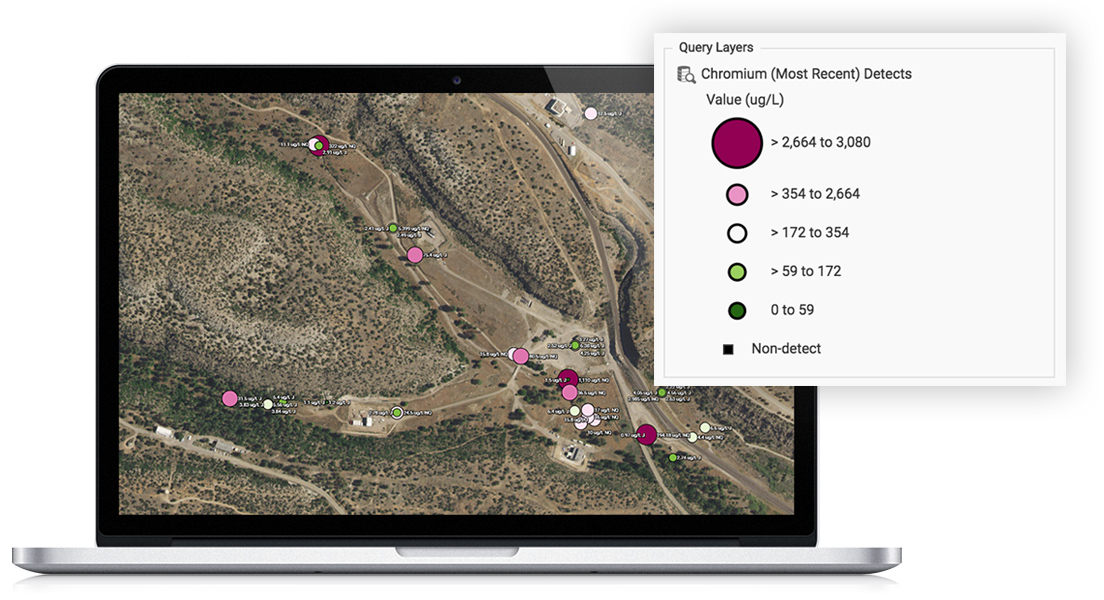
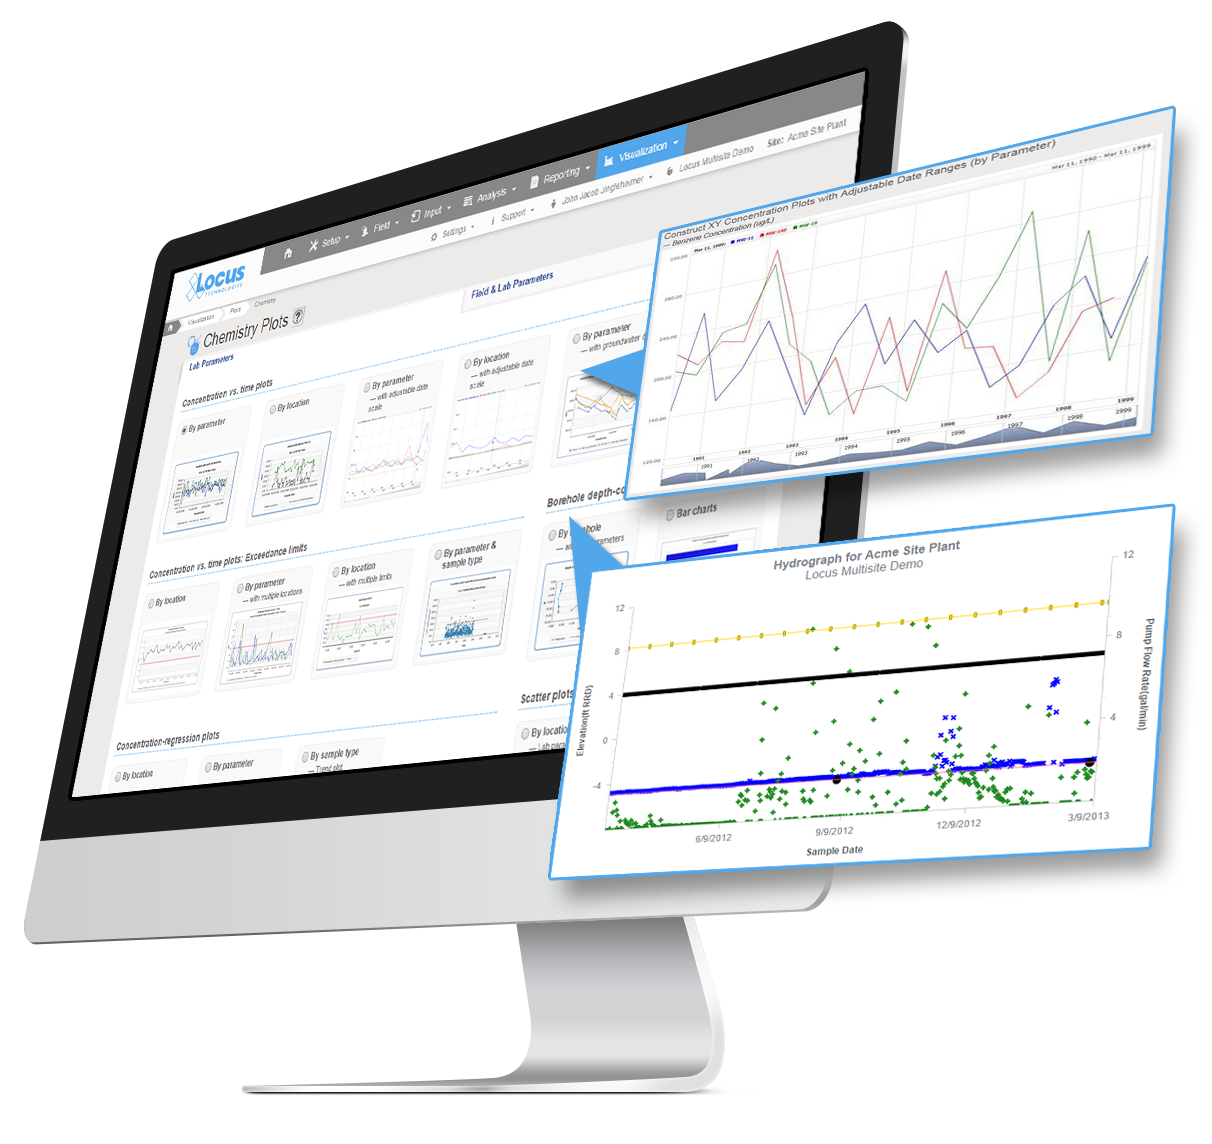
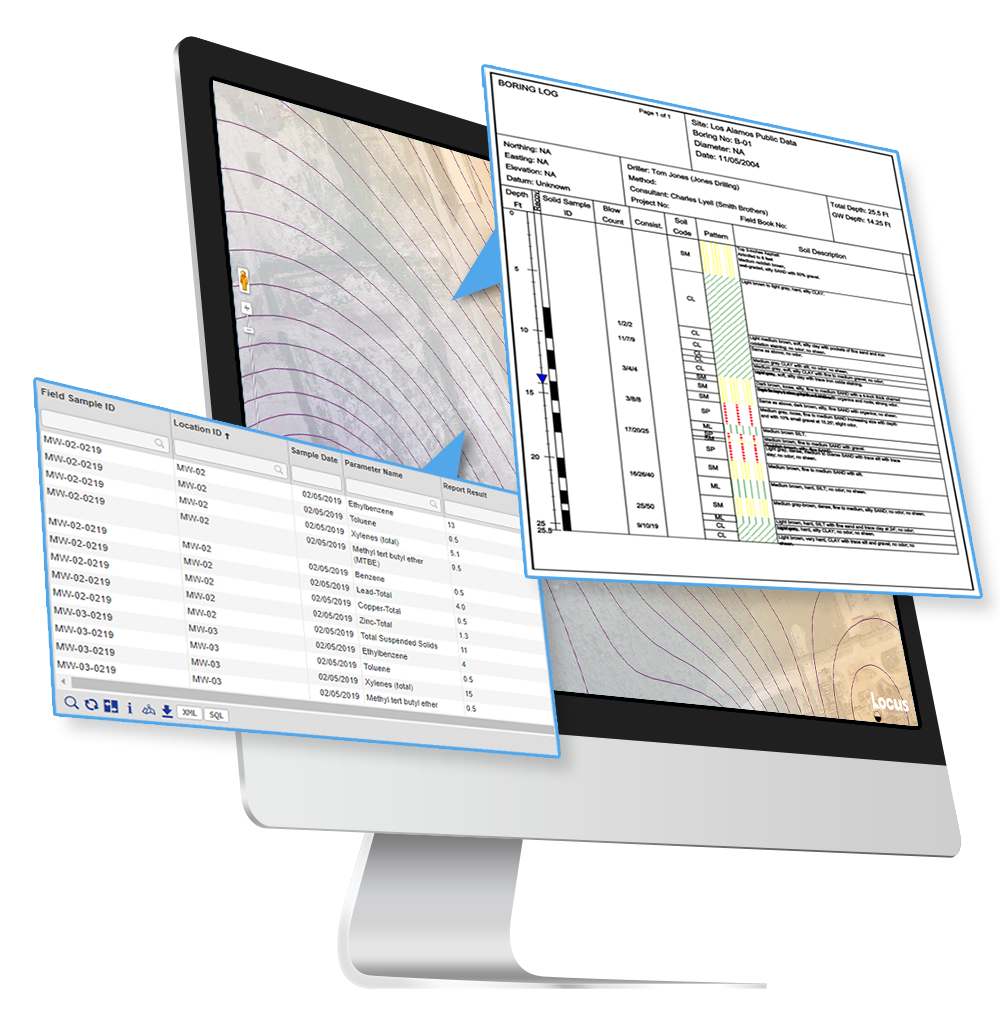
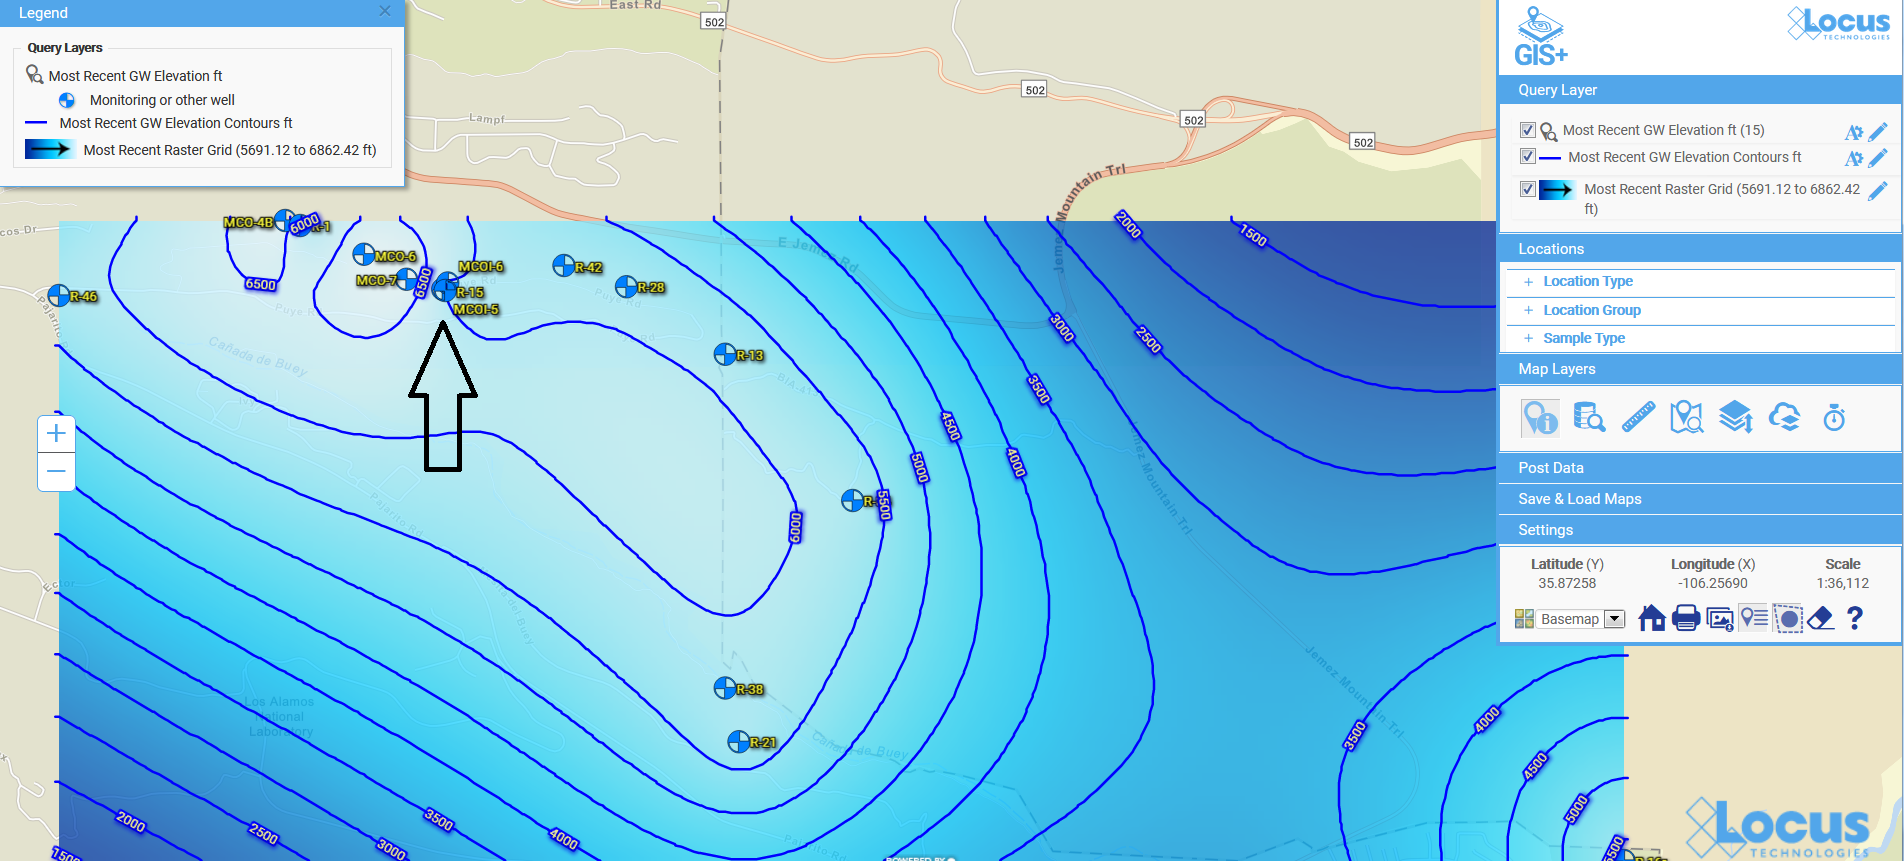
We’ve seen a number of innovation milestones in the past 25 years, and while we didn’t invent SaaS, we’ve been largely responsible for adapting it and perfecting it for environmental purposes. One of the major innovations we’ve integrated into our products include online GIS tools where users can easily visualize their environmental data on maps without expensive desktop software. Another one was our fully configurable software platform with built-in form, workflow, and report builders tailored for environmental purposes, which allows anyone to build and deploy environmental software applications that exactly match their needs. There have been many other innovations we’ve incorporated into our software, but these two stand out as the most impactful.

5. Where do you see Environmental and ESG reporting in the future?

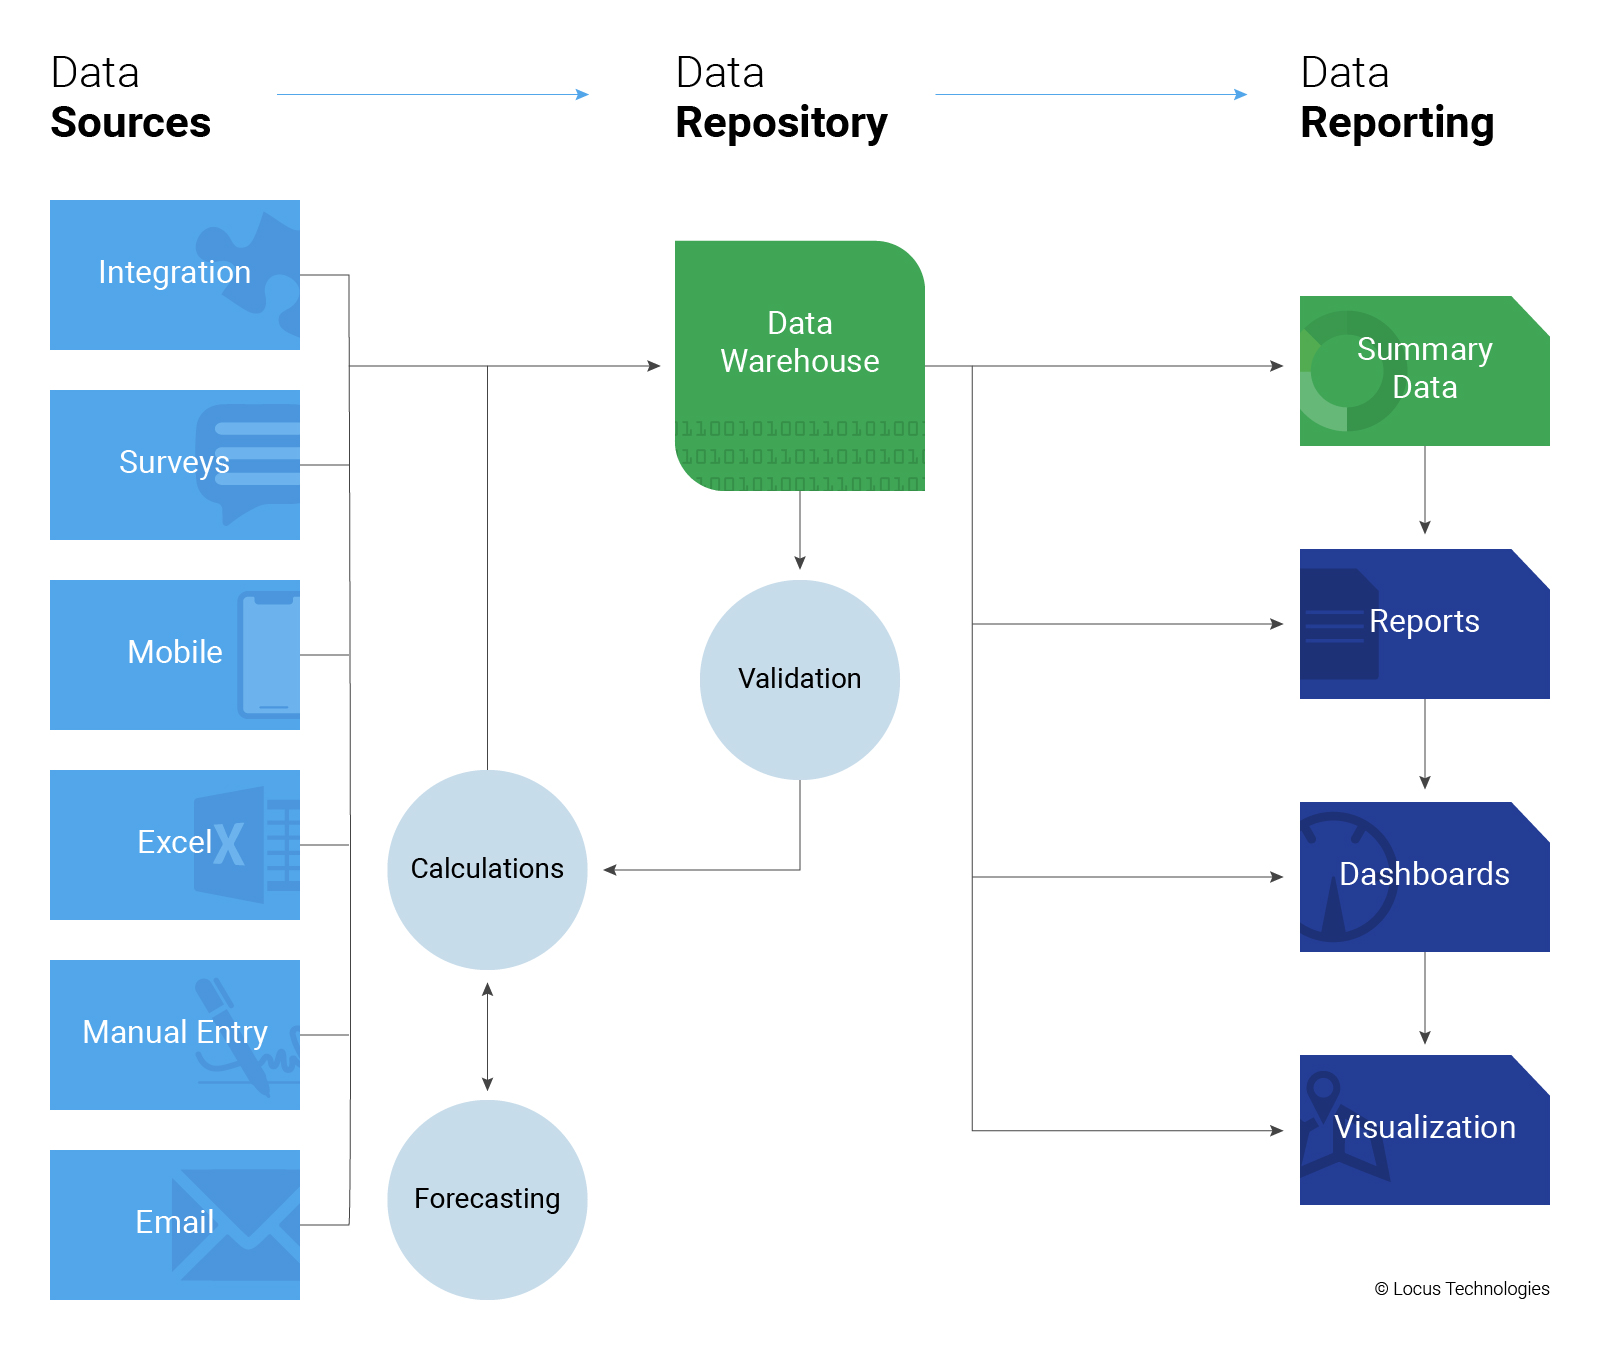
More and more, we are seeing all types of reporting being converted into pure data exchanges. Reports that used to include regulatory forms and text interpretations are being replaced with text or XML file submittals. This transition is being driven largely by availability of technology for EHS professionals to generate and read these files, but it is also promoted by regulatory agencies and other stakeholders receiving these reports. Stakeholders have less time to read volumes of interpretive text, and are becoming more skeptical of potential bias in how facts are presented in text. These are driving the need for more pure data exchanges, with increasing emphasis on quantifiable metrics. These types of reports are also more readily compared against regulatory or industry standards. For reporters, lengthy corporate reports with volumes of text and graphics are becoming less common, and the success of an organization’s programs will be increasingly reliant on robust data sets, since ultimately only the data will be reported.

6. What has been the key reason for Locus’ success for the past 25 years?

There are actually a few that immediately come to mind. One reason is the nature of our continually evolving products. By providing our solutions as SaaS, our software adapts with new environmental requirements, and with new technologies. If our software was still the same as it was 25 years ago, it simply wouldn’t be sufficient for today’s requirements. Since our software is updated multiple times each year, it is difficult to notice the incremental changes, but they can be readily seen if you compare today’s software with the original in 1997. And we’re committed to continuing the development of our products as environmental needs change.

The other primary reason for our success is our excellent staff and the environmental expertise we bring to our customers. We simply could not provide the same level of support without our team of environmental engineers, scientists, geologists, chemists, and an array of others. Having that real-world understanding of environmental topics is how we’ve maintained customer relationships for multiple decades. And our software only has value because it is maintained and operated by staff who appreciate the complexity and importance of environmental work.


Locus President Wes Hawthorne meets with Locus Platform dev team 2016Mr. Hawthorne has been with Locus since 1999, working on development and implementation of services and solutions in the areas of environmental compliance, remediation, and sustainability. As President, he currently leads the overall product development and operations of the company. As a seasoned environmental and engineering executive, Hawthorne incorporates innovative analytical tools and methods to develop strategies for customers for portfolio analysis, project implementation, and management. His comprehensive knowledge of technical and environmental compliance best practices and laws enable him to create customized, cost-effective and customer-focused solutions for the specialized needs of each customer.

Mr. Hawthorne holds an M.S. in Environmental Engineering from Stanford University and B.S. degrees in Geology and Geological Engineering from Purdue University. He is registered both as a Professional Engineer and Professional Geologist, and is also accredited as Lead Verifier for the Greenhouse Gas Emissions and Low Carbon Fuel Standard programs by the California Air Resources Board.

Want to discuss EHS and ESG solutions with our product specialists? Contact us today!

    Name

    Company Email

    Phone

    Tell us about your company's needs

    Locus is committed to preserving your privacy.

    Streamlined sampling process supports N3B’s environmental cleanup at LANL

    Joint Press Release with N3B Los Alamos

    MOUNTAIN VIEW, CA and LOS ALAMOS, N.M., 21 April 2022 —

    A significant software improvement is driving enhanced decision-making on N3B Los Alamos’ environmental cleanup at Los Alamos National Laboratory (LANL).

    Samples collected of soil, sediment, water and other parts of the environment potentially contaminated by historical LANL operations now receive faster and more comprehensive validation due to software tool improvements made by N3B and leading environmental software provider Locus Technologies.

    The improved software functionality is part of a database containing all data associated with environmental cleanup at LANL. N3B implements the legacy portion of that cleanup on behalf of the U.S. Department of Energy’s Environmental Management Los Alamos Field Office. Legacy cleanup involves the remediation of contamination from Manhattan Project and Cold War era weapons development and government-sponsored nuclear research.

    The software improvement ensures more thorough validation of results from third-party analytical laboratories that analyze collected samples for various contaminants, which may include metals, radionuclides, high explosives, and human-made chemicals used in industrial solvents, known as volatile organic compounds.

    The types of contaminants potentially found in these samples, along with levels of contamination, guide N3B’s cleanup.

    “Decisions on legacy environmental cleanup are based on the validity and quality of this analytical data, including the nature and extent of contamination, how much we clean up, and how well the interim remediation measure is working to mitigate migration of the hexavalent chromium groundwater plume,” said Sean Sandborgh, sample and data management director at N3B. “If you have lapses in the quality of analytical data, that could have negative effects on our program’s decision-making capacity.”

    Once N3B personnel collect samples from potentially contaminated sites, they send them to a third-party laboratory for analysis. When N3B receives the results of those samples, they perform a validation process to demonstrate data is sufficient in quality and supports defensible decision-making.

    “Validation consists of determining the data quality and the extent to which external analytical laboratories accurately and completely reported all sample and quality control results,” Sandborgh said.

    The process can catch data quality issues that may result from incorrect calibration of equipment in a laboratory or issues inherent in the samples, such as improper preservation or temperature control, that mask detection of contaminants.

    With the improved functionality, more of the validation process is automated, instead of manually conducted, which means a lower likelihood of errors.

    Another crucial improvement is the ability to evaluate sample results containing radioactive material at lower activity concentrations, which provides quick information on the potential for low levels of radionuclide activity.

    The improved functionality is also being used by LANL’s management and operating contractor, Triad, and will soon be used by the New Mexico Environment Department Oversight Bureau.

    The software improvement saved N3B 265 hours of labor and more than $25,000 in taxpayer dollars since its launch nearly one year ago.

    “As we’ve done for the past 25 years, Locus is committed to continually improving our solutions for the often costly and complex data review process,” said Locus Technologies President Wes Hawthorne. “We are proud to enable a data-forward approach with a focus on accuracy that results in confident and correct decisions.”

    “The quality and defensibility of environmental data generated from sampling activities is a key component of an effective remediation process,” said Sandborgh. “When the automated data review is used in conjunction with manual examination of sample data packages, we meet and exceed our data quality requirements.”


    ABOUT N3B Los Alamos
    N3B manages the 10-year, $1.4 billion Los Alamos Legacy Cleanup Contract for the U.S. Department of Energy Environmental Management’s Los Alamos Field Office. N3B is responsible for cleaning up contamination that resulted from LANL operations before 1999. N3B personnel also package and ship radioactive and hazardous waste off-site for permanent disposal.

    Artificial Intelligence & Blockchain Applied to Water & Energy


    There are two promising technologies that are about to change how we aggregate and manage EHS+S data: artificial intelligence (AI) and blockchain. When it comes to technology, history has consistently shown that the cost will always decrease, and its impact will increase over time. We still lack access to enough global information to allow AI to make a significant dent in global greenhouse gas (GHG) emissions by merely providing better tools for emissions management. For example, the vast majority of energy consumption is wasted on water treatment and movement. AI can help optimize both. Along the way, water quality management becomes an add-on app.

    AI is a collective term for technologies that can sense their environment, think, learn, and act in response to what they’re detecting and their objectives. Possible applications include (1) Automation of routine tasks like sampling and analyses of water samples, (2) Segregation of waste disposal streams based on the waste containers content, (3) Augmentation of human decision-making, and (4) Automation of water treatment systems. AI systems can greatly aid the process of discovery – processing and analyzing vast amounts of data for the purposes of spotting and acting on patterns, skills that are difficult for humans to match. AI can be harnessed in a wide range of EHS compliance activities and situations to contribute to managing environmental impacts and climate change. Some examples of applications include permit interpretation and response to regulatory agencies, precision sampling, predicting natural attenuation of chemicals in water or air, managing sustainable supply chains, automating environmental monitoring and enforcement, and enhanced sampling and analysis based on real-time weather forecasts. Applying AI in water resource prediction, management, and monitoring can help to ameliorate the global water crisis by reducing or eliminating waste, as well as lowering costs and lessening environmental impacts. A similar analogy holds for air emissions management.

    The onset of blockchain technology will have an even bigger impact. It will first liberate data and, second, it will decentralize monitoring while simultaneously centralizing emissions management. It may sound contradictory, but we need to decentralize in order to centralize management and aggregate relevant data across corporations and governmental organizations without jeopardizing anyone’s privacy. That is the power of blockchain technology. Blockchain technology will eliminate the need for costly synchronization among stakeholders: corporations, regulators, consultants, labs, and the public. What we need is secure and easy access to any data with infinite scalability. It is inevitable that blockchain technology will become more accessible with reduced infrastructure over the next few decades. My use of reduced architecture here refers to a replacement of massive centralized databases controlled by one of the big four internet companies using the hub-and-spoke model concept with a device-to-device communication with no intermediaries.


    This post was originally published in Environmental Business Journal in June of 2020.

    Locus Technologies Celebrates 25 Years of Innovative EHS & ESG Software

    Locus looks back on the last 25 years of pioneering EHS, ESG, and water quality software.

    MOUNTAIN VIEW, Calif., 11 April 2022Locus Technologies, the leading EHS Compliance and ESG software provider, today celebrates the 25th anniversary of its founding, and with it, a quarter-century of customer success. Locus looks back on its founding as a Silicon Valley leader in EHS & ESG software with pride in its leadership through expertise, stability, and innovation. 

    Locus was founded in 1997 with a revolutionary vision that set the framework for what is now widely known as environmental, social, and corporate governance (ESG) and environmental, health, and safety (EHS). Locus envisioned a simplified and data-driven approach, offering software in the cloud, on mobile devices, and as a service. The company pioneered SaaS (Software as a Service) model in EHS, ESG, and water quality management spaces in 1999 and never installed its software on customers’ premises. 

    Over 25 years, Locus has pioneered cloud environmental solutions, online and mobile GIS (Geographic Information System) services, has revolutionized environmental information management, and AI and IoT technologies for organizations ranging from Fortune 500 companies to forward-facing municipalities and the US Government. 

    Locus recently broke new ground by releasing the first Visual Calculation Engine for ESG Reporting. Locus’s visual calculation engine helps companies quickly set up and view their entire ESG data collection and reporting program, enabling full transparency and financial-grade auditability throughout the entire process. 

    As the industry continues to evolve, competitors merge and disappear. New markets emerge and grow. Locus remains a constant in the environmental space, an innovative and independent pioneer. 

    “For 25 years now, Locus has brought together industry-leading experts in EHS, sustainability, and technology. Although regulations and requirements have changed over the years, that combination remains at the core of what Locus does, as demonstrated by our stability and long-term customer partners. We look forward to continuing our path of growth using those same values for the next 25 years.” said Wes Hawthorne, Locus President.  

    Locus Founder and CEO, Neno Duplan is proud to look back on the growth of Locus over the last 25 years. He said, “Locus did not start in the clouds, but back in 1997, we had a rather good view. Locus’s vision for better global environmental stewardship has not changed since its inception. We focus on empowering organizations to track better and mitigate the environmental impact of their activities. That vision has come to fruition through the Locus software services used by some of the world’s largest companies and government organizations. Locus’ SaaS has been ahead of the curve in helping private and public organizations in not only managing their water quality, EHS compliance or ESG reporting but also turning their environmental information into a competitive advantage in their operating models.” 

    Locus Technologies Receives 16th Consecutive EBJ Award for Information Technology in ESG

    Environmental Business Journal (EBJ) recognized Locus for ESG software growth and innovation.

    MOUNTAIN VIEW, Calif., 24 February 2022 — Locus Technologies, the leading EHS Compliance and ESG software provider, was awarded a 16th consecutive award from Environmental Business Journal (EBJ) for growth and innovation in the field of Information Technology in the environmental software with particular focus on ESG.

    EBJ is a business research publication providing strategic business intelligence to the environmental industry. Locus received the 2021 EBJ Award for Information Technology by growing and innovating its unified EHS compliance and ESG software platform.

    In 2021 Locus took a leading market position in the fast-growing space of ESG software. Locus’s ESG SaaS covers carbon data aggregation via a powerful visual calculation engine, investor-grade emissions calculations audit capabilities, reporting to multiple standards from a single data set, integration APIs, dashboards, and carbon reduction goal setting and tracking. This separates Locus from competitors as customers demand integrated net-zero ESG software that supports investor-grade data in disclosure rules such as the EU’s corporate sustainability reporting directive, mandatory TCFD reporting, and anticipated SEC action on climate disclosures.

    In 2021 Locus continued to expand its ESG SaaS to include built-in business intelligence tools allowing for interactive, actionable insights into EHS and ESG data, forecasting tools to predict future ESG reporting, APIs linking to utility meters, and interfaces with other Locus and third-party systems that house ESG data. Locus’s ESG application is focused on “enter once, report many times.” The gold standard for multinational enterprises with many locations worldwide is to have a system configured to report to multiple organizations and many standards from a single dataset. Essential built-in reporting in the Locus ESG app includes state or federal regulations, internal CSR, and ESG based on whatever standard their organization adheres to, such as CDP, GRI, SASB, TCDF, or more recent World Economic Forum (WEF) attempt to standardize many voluntary standards.

    Locus also expanded its ESG consulting expertise by becoming the first and only software provider to offer accreditation services under new Oregon DEQ guidelines requiring third-party verification for GHG and CFP programs.

    Besides strong growth in ESG space, Locus also continues to lead the software for water quality management market with the addition of new SaaS customers in 2021, such as the City of Hillsboro, Oregon for water quality management and Westinghouse Electric Company for control of environmental and radionuclides data, cementing Locus’s market leader position in the space of nuclear facilities.

    “Locus’s investment in integrated carbon management software and EHS compliance is paying off. As one of the early SaaS leaders in net-zero digital solutions for ESG reporting, Locus continues to provide value to companies that want to be credible with their carbon reporting and sustainability software.,” said Grant Ferrier, president of Environmental Business International Inc. (EBI), publisher of Environmental Business Journal.

    “We would like to thank EBJ for recognizing Locus for a 16th consecutive year and for taking note of our industry-leading ESG software. We aim to continue expanding our software offerings to customers in 2022,” said Wes Hawthorne, President of Locus Technologies.

    5 Major Signs That You Need to Replace Your Water Data Management Software

    In providing water quality data management software to organizations serving millions of customers a day, our experts have found some common red flags in alternative solutions. Many alternatives to Locus are more prohibitive than helpful, leading to more issues than they should. Your organization deserves to reduce the stress of data entry, regulatory and voluntary reporting, and more. Here are the top 5 signs that your organization is using outdated water quality software:

    1. You’re transcribing data more than once or still using paper forms.

    In order to ensure the highest level of data quality, you should not be risking human error at multiple levels. Enter your data once, and have it audit-ready, set to go on regulatory and voluntary reports, which are created directly from Locus Software.

    2. Product support is not helmed by specialists who support you adequately after implementation.

    Support doesn’t end after implementation. What we often hear from our customers when they switch from other providers is that they are delighted with the level of support that Locus brings with our software. Locus is proud to have the expertise and experience to back our software, and if there is anything you need, you can be sure that Locus support can get it done smoothly.

    3. Your software has regular or unexpected downtimes.

    You need reliability. Your software should be available to you on-demand. Locus is proud to be the only environmental software developer to publicly share our uptime, which is over 99.9%. If you are experiencing downtimes at inconvenient times or for long periods, you should switch.

    4. It’s not mobile-enabled.

    Field collection is key for most organizations managing water quality data. You should be able to enter that data into your system once, and from anywhere, reducing errors and extra time doing the same work twice (or more!). Also, being able to access historical data at your fingertips can help you solve problems on the fly.

    5. It doesn’t provide actionable insights.

    Sure, you may have all of your data collected, but what are you doing with it? If your software is not giving you meaningful findings from analyzing your data, then you are always going to be playing catch-up. Having the tools to help your organization look forward is essential in selecting water data management software.

    Want to learn more about our Water Data Management Solution? Reach out to our product specialists today!

      Name

      Company Email

      Phone

      Tell us about your company's needs

      Locus is committed to preserving your privacy.

      The Convergence of Augmented Reality and GIS

      Today is GIS Day, a day started in 1999 to showcase the many uses of geographical information systems (GIS). Earlier blog posts by Locus Technologies for GIS day have shown how GIS supports cutting-edge visualization of objects in space and over time. This year’s post explains how GIS supports augmented reality.

      Augmented reality (AR) is a technology that enhances how we experience the real world by overlaying your surroundings with computer-generated objects. It differs from virtual reality (VR) because in VR, everything you see is computer generated, but in AR, the majority of what you see is real – your experience of reality is enhanced (augmented) but not totally replaced.

      You are probably familiar with one AR application already if you watch American football. The ‘virtual’ first down line that appears on field before each play is projected there by computer and is not really painted on the field. If you follow soccer (or football to the rest of the world), AR is used by a Video Assistant Referee (VAR) to objectively determine tight offsides decisions. Digital lines are drawn across the field to show whether or not attackers are illegally past the last defender or not. Another AR example is the popular game Pokémon Go that shows cute virtual creatures in your living room or your front yard.

      To experience AR, you need something to project the non-real objects onto your view of the world. Many AR applications use mobile phones or other devices. An AR application uses the camera view to show you the world around you and then overlays virtual objects onto the view. Other devices such as head mounted displays, ‘smart glasses’, or even ‘bionic contact lenses’ can use AR, but have not been as popular as phones or other mobile devices. In contrast to AR, VR cannot be fully supported with just a mobile device and usually requires headsets to immerse you in a virtual world. Because of this need, AR is much less intrusive than VR is.

      Countless other examples of AR already exist in many fields. A few selected applications include:

      • Online shoppers at some e-commerce sites can use smart devices to project furniture into their home to see how the pieces look before making a purchase.
      • Some clothing stores can project clothing onto shoppers’ bodies to check appearance without having to change clothes. These applications require the user to be in a special dressing booth with full body scanning capabilities.
      • Urban planners use AR to display how planned buildings, cell towers, wind turbines, and other structures would look in the existing space. Planners can walk the streets and view how proposed projects would alter the existing cityscape.
      • AR is used in manufacturing to display operation and safety instructions in a worker’s field of vision using head mounted displays, which circumvents the need to refer to bulky paper manuals.
      • Utility managers can see underground pipelines, water lines, sewer pipes, electrical lines, and other infrastructure projected below their feet.

      So how does GIS relate to AR? There are three main uses of GIS in AR:

      • Location: Any AR application must know where the user is and where to place virtual objects. In most cases, full GIS capabilities are not needed; instead, the application accesses a GPS (global positioning system) to find locations. Consider the Pokémon Go application mentioned before. The game knows where the various Pokémon need to appear. When a user plays the game, it uses GPS to find the user, and then shows any Pokémon that are near the user based on their locations.
      • Layers: An AR application may need to show features that are not visible to the user, such as underground electrical lines, earthquake fault lines, property lines, or planned buildings. All these features can be stored as GIS map layers in the cloud and then displayed in the AR application as virtual overlays projected on the real world. Furthermore, a user could select a displayed item and view related attribute information in the GIS layer. For example, a user could view the condition, age, and repair status of a selected water pipeline.
      • Navigation: An AR application may also need to help a user get from point A to point B, for example in a crowded airport or in a large warehouse. Such navigation could be facilitated by showing virtual route markers and arrows on the real world.

      Locus has been exploring environmental uses of AR and GIS by adding AR to Locus Mobile, which is the Locus app for collecting field data, completing EHS audits, tracking waste containers, and completing other tasks requiring users to gather data out of the office. Locus Mobile now features an AR mode to assist users when taking field samples. When the user activates AR mode, the app uses the camera to show the user’s immediate area. The app then puts multiple virtual markers on the display corresponding to sampling points located in that direction. As the user moves or rotates the phone to change the viewing area, the markers change to reflect the locations in the user’s line of sight. Clicking a marker provides more information including the location name and the distance from the user.

      Locus Mobile uses all three ways to combine GIS with AR:

      • By using GPS to find the user’s location and the locations of nearby sampling points.
      • By using GIS to display the layer of sampling points.
      • By using GIS to assist with navigation to sampling points by showing distance and direction.

      Here is a sample image from Locus Mobile showing three nearby sampling locations along with information about past events or measurements at the locations. The three blue banners are the augmented reality displayed on top of the view of the nearby surroundings.

      Locus Augmented Reality

      By using GIS and AR to assist users in finding sampling points, Locus Mobile makes field personnel more productive. Samplers can find field locations quickly and can easily pull up related information. Locus continues to explore using AR to expand the functionality of its environmental applications.


      Interested in Locus’ GIS solutions?

      Locus GIS+ features all of the functionality you love in EIM’s classic Google Maps GIS for environmental management—integrated with the powerful cartography, interoperability, & smart-mapping features of Esri’s ArcGIS platform!

      [sc_button link=”https://www.locustec.com/applications/gis-mapping/” text=”Learn more about Locus’ GIS solutions” link_target=”_self” color=”#ffffff” background_color=”#52a6ea” centered=”1″]


      [sc_image width=”150″ height=”150″ src=”16303″ style=”11″ position=”centered” disable_lightbox=”1″ alt=”Dr. Todd Pierce”]

      About the Author—Dr. Todd Pierce, Locus Technologies

      Dr. Pierce manages a team of programmers tasked with development and implementation of Locus’ EIM application, which lets users manage their environmental data in the cloud using Software-as-a-Service technology. Dr. Pierce is also directly responsible for research and development of Locus’ GIS (geographic information systems) and visualization tools for mapping analytical and subsurface data. Dr. Pierce earned his GIS Professional (GISP) certification in 2010.

      The Horrors of Excel for Data Management

      Locus has been preaching on the pitfalls of Excel for a long time. It’s no surprise that one of the worst imaginable errors in Excel that could’ve happened, did. Almost 16,000 COVID-19 cases in England went unreported because Public Health England hit the maximum row count in their version of Excel.

      This is not the only example of Excel being misused or being the wrong tool entirely for the job. Excel is not in any way a data management system for complex or vital data. When it comes to sustainability reporting and environmental data management, the evils of the grid are a force to be reckoned with. We have highlighted a few examples that will have you shivering.

      Excel Horrors - Evils of Autofill

      Case 1: The Evils of Autofill

      Take a look at this harmless-looking chart. It shows monthly electricity consumption for a facility set to report:

      Month  Monthly Electricity Consumption (MWh) 
      January 2019  133,500 
      February 2019  122,400 
      March 2019  138,900 
      April 2019  141,600 
      May 2019  141,601 
      June 2019  141,602 
      July 2019  141,603 
      August 2019  141,604 
      September 2019  141,605 
      October 2019  141,606 
      November 2019  141,607 
      December 2019  141,608 

      During review, the auditor notices a distinct trend from April to December, indicating false data overwritten by a stray double-click. Eventually, the auditor required re-entering all invoice data for dozens of facilities to correct the issue. Where the original data went and how autofill went astray remains a mystery.


      Excel Horrors - Phantom File Editor

      Case 2: The Phantom File Editor

      Imagine using a massive spreadsheet with lots of linked calculations for your annual sustainability report. One of the team engineers works on the file to input more data and get it ready for presentation. But in the final steps, they accidentally delete one of the formulas that sum up the indicators. The annual total looks great for the presentation since you’ve effectively removed a portion of your resource consumption, but afterwards you discover the conclusions were incorrectly calculated.  How did that error get introduced?  The spreadsheet has no auditing capabilities on the individual values, so you may never know.

      Excel supports multiple users editing one document simultaneously, but not well.  Multiple records are saved, edits are lost, and vital data vanishes, or at best is very hard to recover. The Track Changes feature is not infallible, and over reliance on it will cause hardship.

      Excel Horrors - Date of the Dead

      Case 3: Date of the Dead

      Excel has a frustrating insistence of changing CAS numbers into dates, even if they are something like “7440-09-7″ turning into September 7, 7400. If you’re not explicit in your cell formatting, Excel isn’t happy leaving values as they are.


      Excel Horrors - Imposter Numbers

      Case 4: Imposter Numerical Values

      You meant to type 1.5, but you typed “1..5” or “.1.5”. Does Excel reject these imposter numbers or let you know of a potential error? No, it’s stored in Text format. This can throw off any averages or sums you may be tracking. This minor identity theft can cause a real headache.


      Other Significant Cases:

      Other data quality issues with using Excel include, but are not limited to:

      • Locations with multiple variations of the same ID/name (e.g., MW-1, MW-01, MW 1, MW1, etc.)
      • Use of multiple codes for the same entity (e.g., SW and SURFW for surface water samples)
      • Loss of significant figures for numeric data
      • Special characters (such as commas) that may cause cells to break unintentionally over rows when moving data into another application
      • Bogus dates like “November 31” in columns that do not have date formats applied to them
      • Loss of leading zeros associated with cost codes and projects numbers (e.g., “005241”) that have only numbers in them but must be stored as text fields
      • The inability to enforce uniqueness, leading to duplicate entries
      • Null values in key fields (because entries cannot be marked as required)
      • Hidden rows and/or columns that can cause data to be shifted unintentionally or modified erroneously
      • Inconsistent use of lab qualifiers— in some cases, these appear concatenated in the same Excel column (e.g., “10U, <5”) while in other cases they appear in separate columns

      As you can see, the horrors of Excel are common, and terrifying. Without a proper system of record, auditing features, and the ability for data to vanish into the ephemera, Excel offers little in the way of data security and quality for organizations managing vital environmental and compliance data. Many are learning firsthand the superiority of database management systems over spreadsheets when it comes to managing data. Now is the time to examine the specific shortcomings of your current system and consider your options.

      Contact us today to learn how Locus makes complex data management a little less spooky!

        Name

        Company Email

        Phone

        Tell us about your company's needs

        Locus is committed to preserving your privacy.

        7 Useful Visualization Tools for Environmental Management

        The ability to visualize your field and analytical data across maps, logs, and charts is a crucial part of managing environmental information. Locus makes it easy to visually display and export data for sharing in reports and presentations. We’ve compiled 7 of the most useful visualization tools in our environmental information management software.

        Data Callouts

        View your data in easy-to-read text boxes right on your maps. These are location-specific crosstab reports listing analytical, groundwater, or field readings. A user first creates a data callout template using a drag-and-drop interface in the EIM enhanced formatted reports module. The template can include rules to control data formatting (for example, action limit exceedances can be shown in red text). When the user runs the template for a specific set of locations, EIM displays the callouts in the GIS+ as a set of draggable boxes. The user can finalize the callouts in the GIS+ print view and then send the resulting map to a printer or export the map to a PDF file.

        Locus GIS Data Callouts


        Graduated Symbols

        Locus GIS features high-quality and industry specific graduated symbols so that you can compare relative quantitative data on customizable maps. Choose graduated symbol intervals, sizes, and colors from a large selection of color ramps and create multiple layers for data analysis. It also features a location clustering option, ideal for large sites, a historical challenge for mapping.

        Intellus GIS+ maps


        Charting

        Multiple charts can be created in EIM at one time. Charts can then be formatted using the Format tab. Formatting can include the ability to add milestone lines and shaded date ranges for specific dates on the x axis. The user can also change font, legend location, line colors, marker sizes and types, date formats, legend text, axis labels, grid line intervals or background colors. In addition, users can choose to display lab qualifiers next to non-detects, show non-detects as white filled points, show results next to data points, add footnotes, change the y-axis to log scale, and more. All of the format options can be saved as a chart style set and applied to sets of charts when they are created.

        Screenshots of EIM chemistry plots menu with two sample plots


        Time Sliders

        Locus has adopted animation in its GIS+ solution, which lets a user use a “time slider” to animate chemical concentrations over time. When a user displays EIM data on the GIS+ map, the user can decide to create “time slices” based on a selected date field. The slices can be by century, decade, year, month, week or day, and show the maximum concentration over that time period. Once the slices are created, the user can step through them manually or run them in movie mode.

        GIS+ time slider in action


        Augmented Reality

        Locate and identify inspection and/or monitoring locations on your mobile device. View real-time and historical environmental data to quickly find areas of interest for your chemical and subsurface data. Use your camera to get precise geotagged information for spills, safety incidents, historical chemical sources, subsurface utilities, or any other type of EHS data.

        Locus Augmented Reality


        Boring Logs

        Create and display clickable boring logs of your sample data—using custom style formats and cross-sections. Show depth ranges, lithology patterns, aquifer information, and detailed descriptions for your samples.

        Locus GIS+ boring logs on groundwater contour lines


        Contours

        Create and visualize custom contours using multiple algorithms. Because visualizations let you chunk items together, you can look at the ‘big picture” and not get lost in tables of data results. Your working memory stays within its capacity, your analysis of the information becomes more efficient, and you can gain new insights into your data.

        Contour map for groundwater in Locus GIS+


        Contact us to see more

        Send us your contact information and a Locus representative will be in touch to discuss your organization’s environmental data management needs and provide an estimate, or set up a free demo of our enterprise environmental software solutions.

          Name

          Company Email

          Phone

          Tell us about your company's needs

          Locus is committed to preserving your privacy.

          6 Ways To Get Data Into Your EHS System

          Locus provides multiple methods to populate EHS, ESG, or any environmental data, including the following:

          6 Ways to Input Data


          Integrations

          Locus provides a full suite of REST API’s, and SDK that can be used to populate data from external data sources. Typical uses include utility data, CEMS, meter data and IoT data.


          Surveys

          Locus Survey tool enables you to issue survey questionnaires to people outside your organization, and enables them to securely and seamlessly respond directly into the survey form. Typical uses include supplier surveys, audits and customer questionnaires.


          Mobile

          User input forms can be optimized for input on a phone or tablet, which allows quick uploads of photos and also geotags your data so you can ensure it was collected at the right location.


          Excel and Text Files

          Locus provides a full suite of Excel upload tools that allow you to import data directly from Excel or CSV files. This option also allows you to work offline and re-sync your data later. Typical uses include laboratory data, periodic monitoring data and data migrations.


          Manual Data

          Like any system, Locus provides tools for users to directly enter data into the system. These include Locus sophisticated data validation tools which employs machine learning techniques to identify data entries which may be invalid, with visual indications of the expect range or ranges.


          Email

          Locus can be configured to directly read email input (as text) and place it into the system. Typical uses include instances where external users initiate a conversation, which then may be responded to from within the system, such as an inquiry, issue, or an incident report.

          Contact us to learn more

          Send us your contact information and a Locus representative will be in touch to discuss your organization’s environmental data management needs and provide an estimate, or set up a free demo of our enterprise environmental software solutions.

            Name

            Company Email

            Phone

            Tell us about your company's needs

            Locus is committed to preserving your privacy.