Utilizing the Uniqueness of GIS for Better Environmental Data Analysis
Today is GIS Day, a day started in 1999 to showcase the many uses of geographical information systems (GIS). Earlier Locus blog posts have shown how GIS supports cutting-edge visualization of objects in space and over time. This post is going to go “back to basics” and discuss what makes GIS unique and how environmental data analysis benefits from that uniqueness.
Spatial vs Non-Spatial Relationships
So, what makes GIS unique? It’s the ability of GIS to handle spatial relationships, which goes beyond just putting “dots on a map”. You are probably familiar with non-spatial relationships such as greater than, less than, or equal to, and you probably use them every day. For example, suppose you want to buy the latest gaming console (PS5, anyone?). You need to compare the price of the console to your bank account. If the console price is greater than your savings, then you cannot buy the console.
Or can you? With credit cards, you can pay later, so you go charge the console. At the time of the transaction, some software evaluates a non-spatial relationship and checks if the console price plus your current debt is less than your credit limit. If so, you can buy the console; if not, your purchase is denied.
The key point about this example is that spatial relations play no part. It doesn’t matter where you are located or where the game console is sold from. (OK, there may be things like state taxes and shipping, but that just contributes to the price.) Now, if you were trying to find all gaming consoles for sale within a certain distance of you, that is a spatial relationship. There are multiple types of spatial relationship, but the most common are inside, contains, crosses, overlaps, and within a distance of. Standard relational database software does not handle these sorts of relations, but GIS can.
As an illustration, let’s consider two current events: the 2020 US presidential election and the COVID-19 pandemic. With non-spatial relationships, you can answer various questions such as “did Biden get more votes than Clinton?” or “is the number of positive COVID tests increasing?”. But with spatial relations, you can answer more interesting questions such as “did areas with COVID hot spots vote more predominantly for Biden or Trump?”. For this question you must see if voters lie inside a COVID hot spot; a GIS can perform this analysis and then map the results. While many votes are still being counted, as of this blog post, it appears Trump performed better in COVID hot spots.
Spatial Relationships in Environmental Data
Let’s look at some example of spatial relations in environmental data. Assume you have a database of tritium sampling results in water, along with various map layers of natural and manmade features. What kind of spatial relationships can you explore with GIS?
To answer that, we’ll make some maps with the Locus GIS+ package in EIM, Locus’s cloud-based, software-as-a-service application for environmental data management. All maps shown here display wells with tritium samples, with the wells represented as colored circles. The color scale goes from blue through yellow to red, to indicate increasing tritium results.
Figure 1 shows an example of an inside spatial relationship. The map answers the question “what wells with tritium results are inside the Mortandad Canyon watershed?”. The watershed is highlighted in blue on the map, and you can easily see the wells inside the watershed.
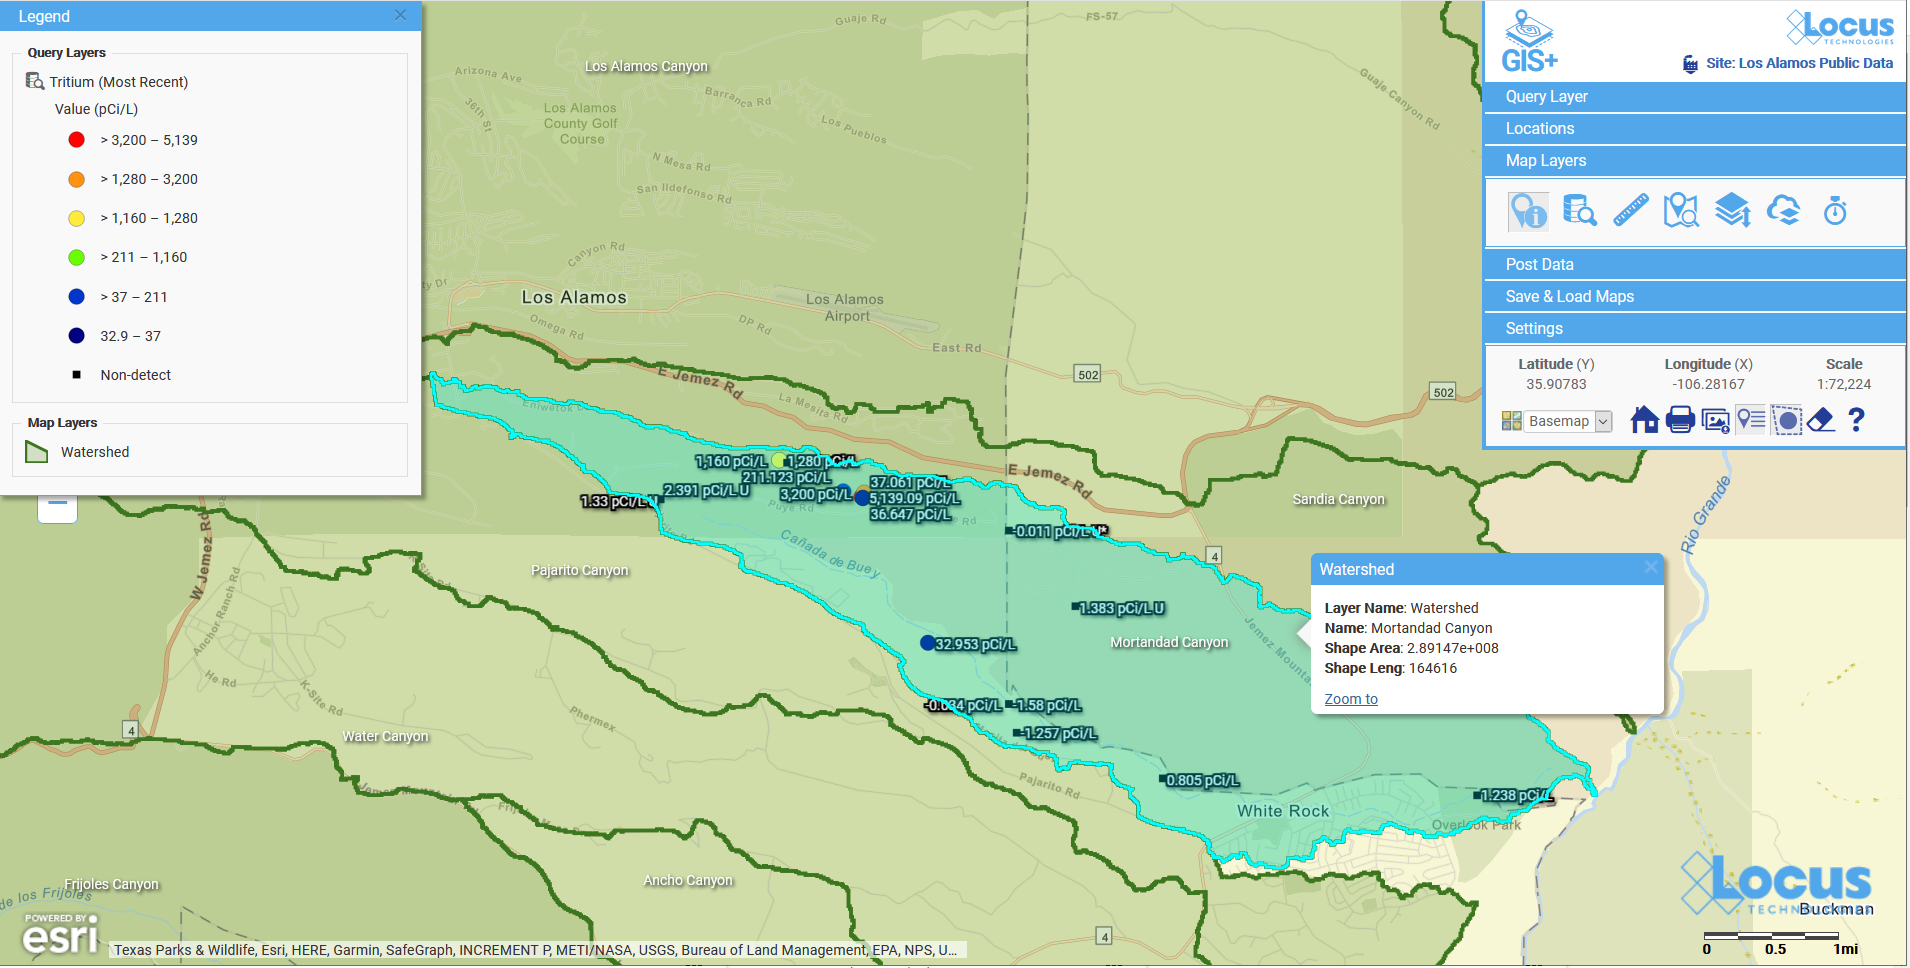
Figure 1: Wells with tritium within a watershed
Figure 2 shows wells with tritium results that are within a distance of a river. The map answers the question “what wells with tritium results are within 500 ft of the river?”. The river, highlighted in light blue, has a 500 ft buffer shown as a dotted blue line. The wells with tritium that lie within the buffer are shown on the map, so you can check if any high tritium results are close to the waterway.
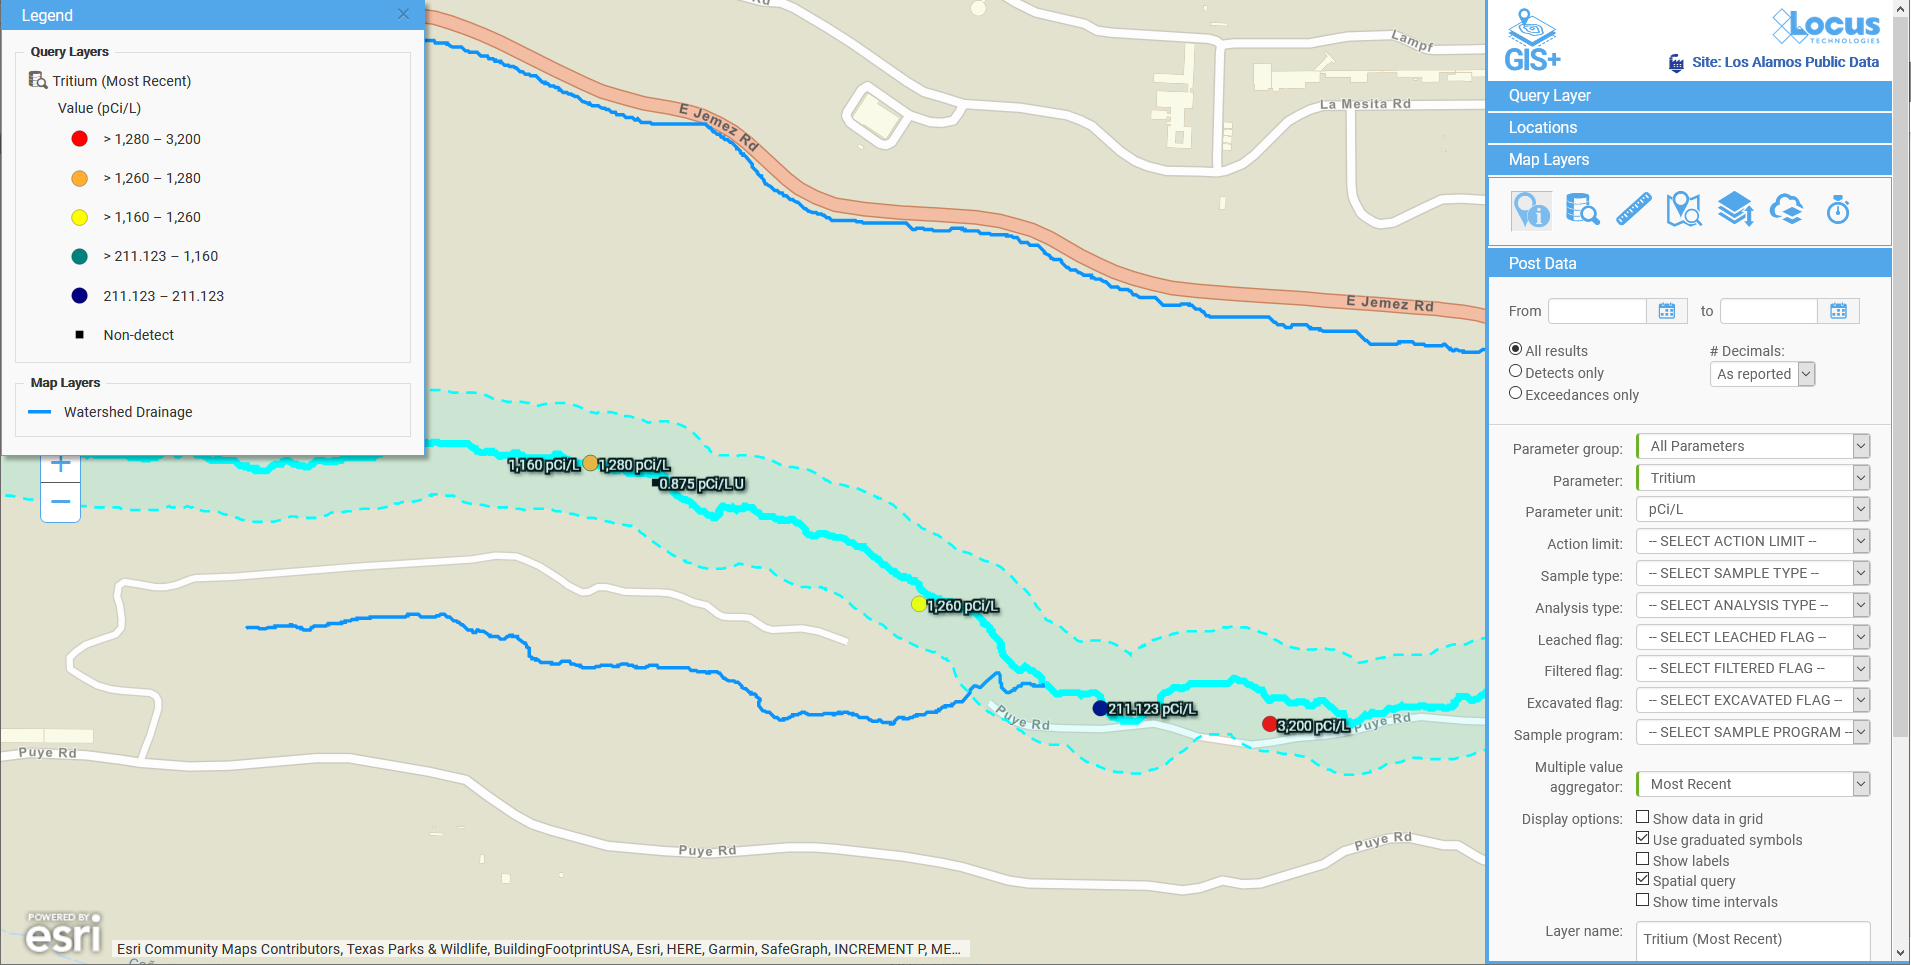
Figure 2: Wells with tritium within a specified distance of a river
Figure 3 shows another example of within a distance of. Here, the map answers the question “what wells with tritium results are within two miles of a middle school?”. The two-mile radius is shown as a shaded blue circle centered on the school. You can see the wells are confined to the area southeast of the school.
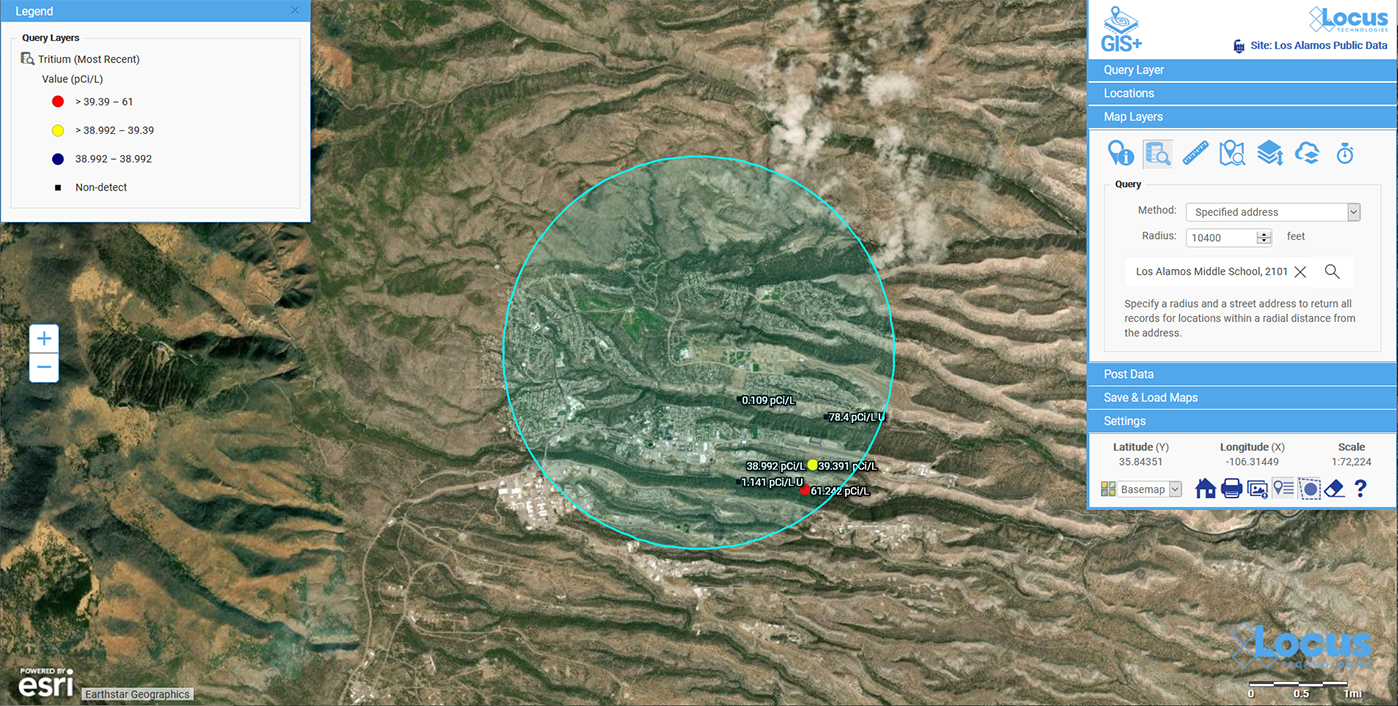
Figure 3: Wells with tritium within a specified distance of a school
These three examples are just a small subset of what can be done with GIS and environmental data. Here are some other questions illustrating the kind of spatial analysis that GIS supports.
- Have any spill incidents at my site been within a specified distance of a waterway?
- Do any pipelines at my site cross protected waterways?
- Do any remediation areas at my site contain wells that have recorded high chemical levels in water?
- Does the underground plume from a chemical release overlap any aquifers?
All these examples illustrate the power of GIS for analyzing spatial relationships, and these examples are just the beginning. GIS can also perform more sophisticated analyses that look at spatial relationships in different ways to answer questions such as:
- How confident can we be in the results of the spatial relationship analysis?
- Do all data records follow the spatial relationship, or are any outliers that fall outside the norms?
- Has this spatial relationship changed over time? Has the relation grown stronger or weaker?
- Can we predict the future of the spatial relationships?
Locus continues to bring new analysis tools to our Locus GIS+ system for environmental applications. These applications let you take advantage of the unique ability of GIS to analyze spatial relationships in your environmental data.
Acknowledgments: All the data in EIM used in the examples was obtained from the publicly available chemical datasets online at Intellus New Mexico.
Interested in Locus’ GIS solutions?
Locus GIS+ features all of the functionality you love in EIM’s classic Google Maps GIS for environmental management—integrated with the powerful cartography, interoperability, & smart-mapping features of Esri’s ArcGIS platform!
Learn more about Locus’ GIS solutions.
About the Author—Dr. Todd Pierce, Locus Technologies
Dr. Pierce manages a team of programmers tasked with development and implementation of Locus’ EIM application, which lets users manage their environmental data in the cloud using Software-as-a-Service technology. Dr. Pierce is also directly responsible for research and development of Locus’ GIS (geographic information systems) and visualization tools for mapping analytical and subsurface data. Dr. Pierce earned his GIS Professional (GISP) certification in 2010.