Blockchain: aggregate emissions reporting
Blockchain: aggregate emissions reporting
In the next few years, an opportunity exists to make significant advances in how we monitor and manage environmental emissions to the air, soil, and water, potentially resulting in significant disruptions in current approaches. Currently, industries and commercial establishments monitor their emissions and submit reports on a regular basis, often as frequently as quarterly, to federal and state agencies to demonstrate they are meeting regulatory requirements. However, no one on the generating or receiving end of these data dumps and reports is aggregating these emissions to create a more composite, inclusive picture of emissions across sources or media.
The reason is this: emissions of different types and to different media are reported to separate regulatory entities that, in general, do not interact or talk to one another. And although there are significant potential benefits to both generators and regulators in reviewing integrated environmental data sets, our traditional methods of storing and sharing this information make such integrations a hugely difficult effort.
Only by integrating all available data can we begin to
- assess local, regional, and ultimately the global impacts of these emissions, and
- identify net improvements to our environmental practices that are only apparent when looking at the combined, interconnected body of collected data.
Blockchain enables the integration of these data sets for quick, yet comprehensive “big picture” assessments.
Blockchain technology is a highly disruptive technology that offers an efficient way of storing records (called blocks) which are linked using cryptography. While still in its infancy, blockchain promises to change the world as we know it, much like the internet did after its introduction in 1991. Today, the technology is most widely associated with digital currencies and money transfers. In time, however, blockchain technology will not only shift the way we use the internet, but it will also revolutionize the global economy and almost all transactional business that relies on an intermediary.
One Environment, Health, and Safety and Sustainability (EHS+S) sector well positioned to benefit from blockchain technology is emissions monitoring and reporting. I reported more on the technology and its impact on the EHS space in this in-depth article about blockchain and emissions management.
Environmental monitoring current practice
Presently, companies with emissions monitor these following regulatory requirements, input the resulting data into a database or spreadsheet, perform emissions calculations on the entered readings, and then report the results of these calculations to regulators. The entire focus of this process is to:
- determine whether emissions of a single chemical or chemicals exceed prescribed levels and
- evaluate the effect of these discharges on the media to which the compounds have been introduced by the polluting industry or other sources.
There is no suitable software technology or mechanism to look at aggregate emissions across geographical areas or sectors or how emissions of one type interact with emissions of an entirely different kind. Examining such interactions could be far more critical than monitoring and assessing the impacts on human health and the environment of single parameter emissions to only one media, and may reveal new opportunities for optimizing our EHS+S practices for reduced cost with similar or improved performance.
Aggregate emissions
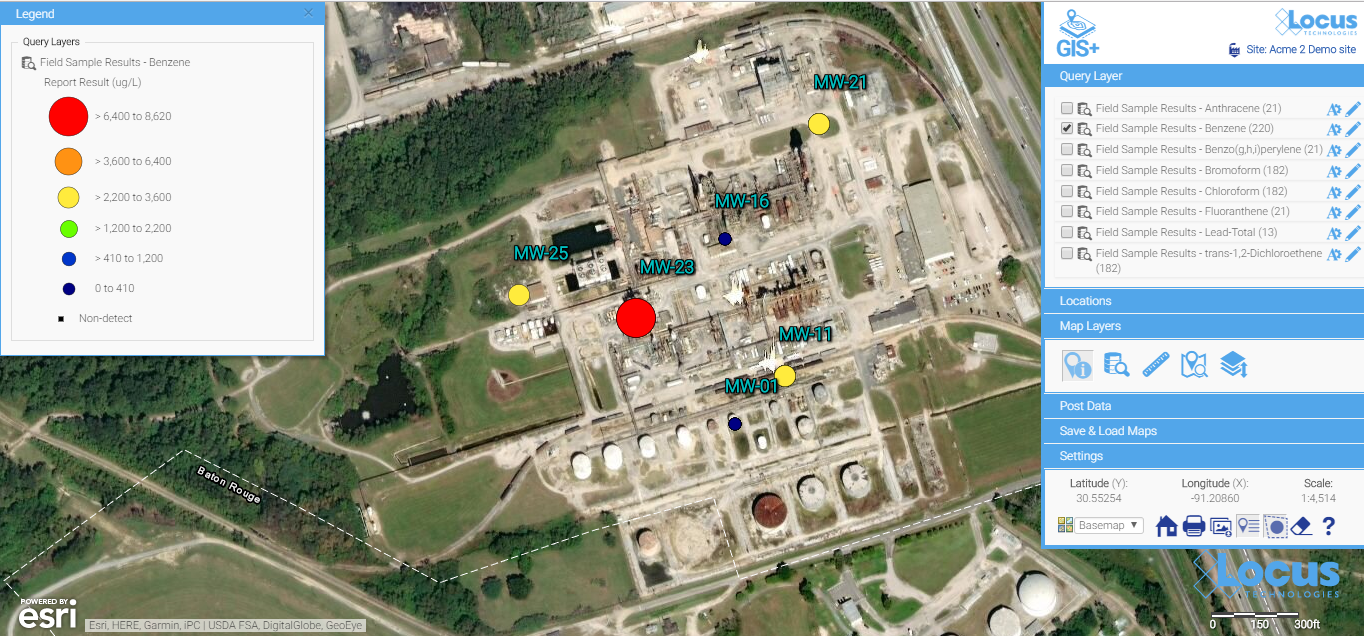
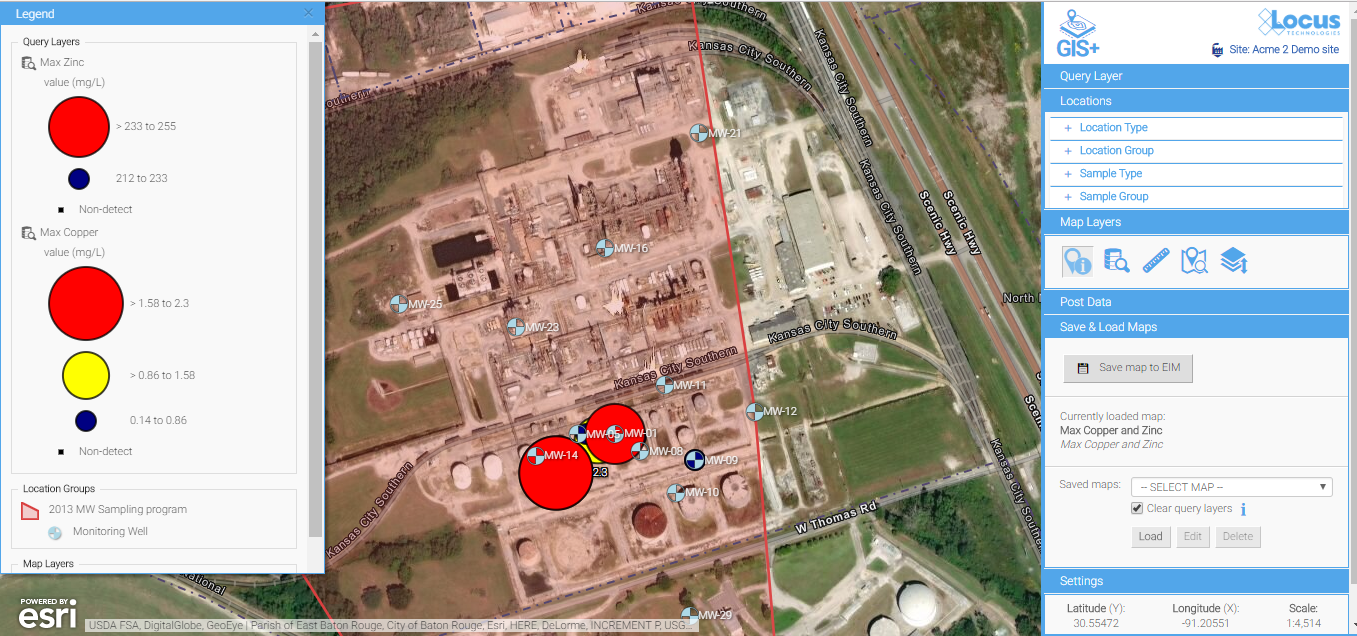
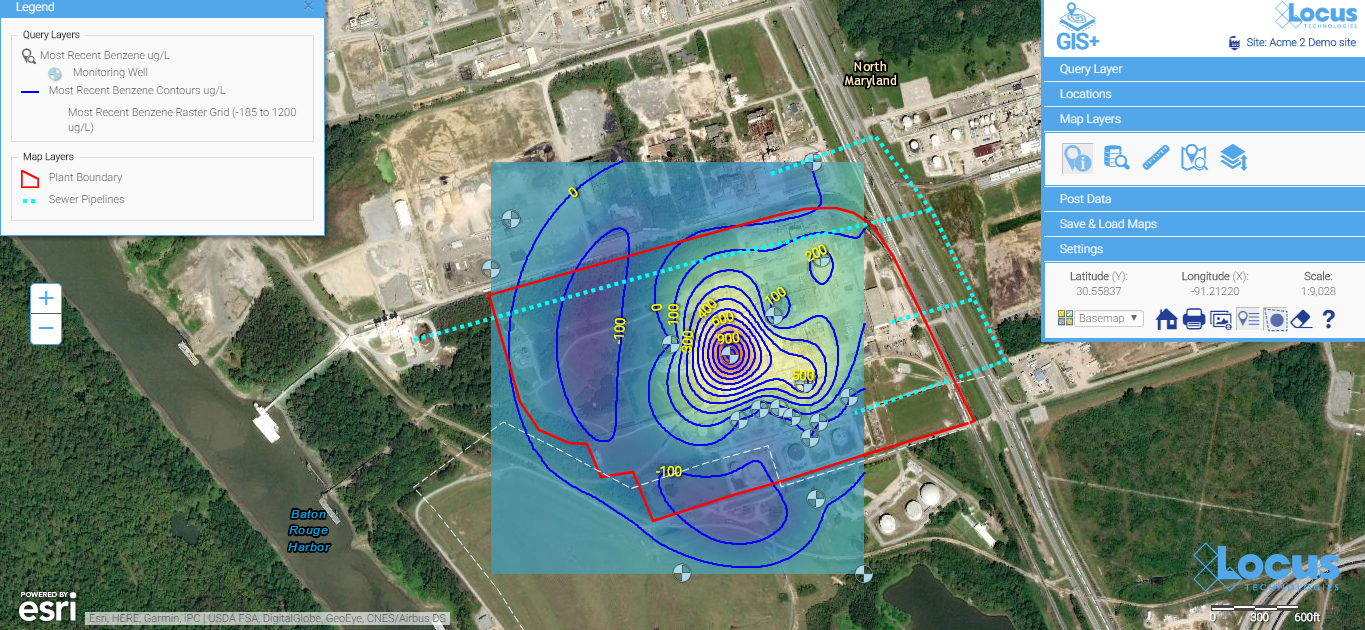
To take a hypothetical scenario, consider the possible consequential damages when two incompatible streams of chemicals or waste mix to create even worse chemicals as a result of their chemical reaction. EPA has only recently started looking into these type of scenarios. Its Envirofacts databases allow the public to retrieve information from multiple sources of Envirofacts’ System Data relevant to your area of interest. However, each database is a separate silo of information (Figure 1). The next step that ought to be taken is to assess and, as needed, report on the possible interaction of incompatible emission sources that are nearby, but are independently monitored and stored in disconnected databases (see Figure 2 below).
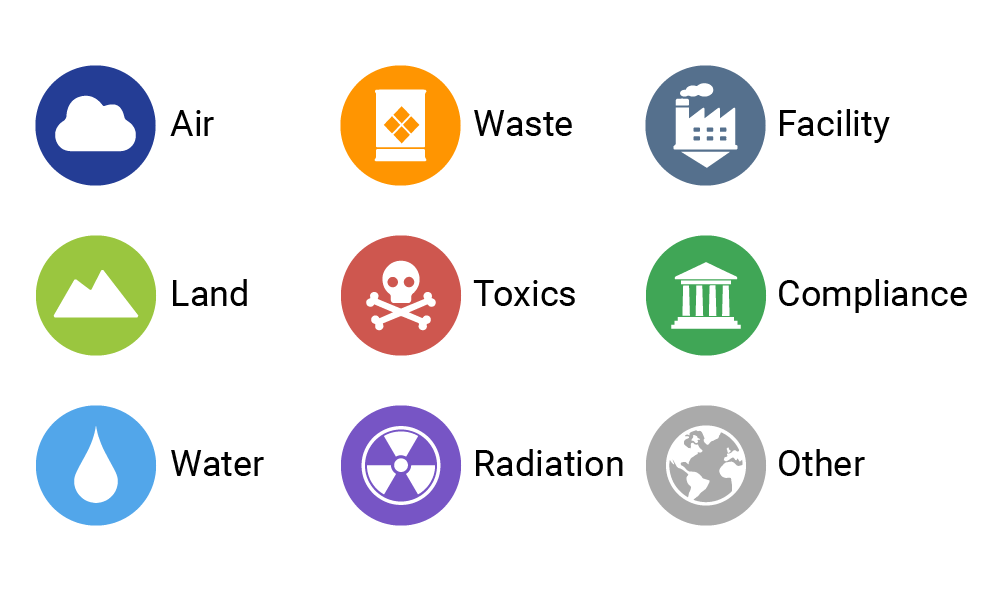
Figure 1: EPA Envirofacts databases allow the public to retrieve information from multiple sources, but only one source at time and disconnected from each other.
Most everyone taking prescription medicines comes to understand that interactions between drugs are quite common. Imagine something similar to the interaction of drugs in your body happening on a much larger scale in the environment. EPA recently imposed the highest environmental fine ever at the 2,530-acre Eastern Michaud Flats Contamination Superfund site near Pocatello, Idaho.
Two adjacent on-site phosphate ore processing facilities, the FMC Corporation and the J.R. Simplot Company, began operations at the site in the 1940s. The J.R. Simplot facility produces solid and liquid fertilizers using phosphate ore, sulfur, air and natural gas. The FMC plant is North America’s largest producer of elemental phosphorus which is used in a variety of products from cleaning compounds to foods. Operations at these plants have independently contaminated both the groundwater and soil with hazardous chemicals. Both plants have received numerous environmental violations, many of which were settled with the EPA. Each of the sites has its environmental ills (and fines), but the more significant environmental problem is a combined regional plume.
Everyone knows that acids and metals do not play well together. Sulphuric acid from the J.R. Simplot operation has leaked from surface impoundments into the groundwater and, on its way downstream, has leached all kinds of toxic metals from the FMC site, creating a highly poisonous plume of contaminants. An accurate assessment of the environmental disaster that exists in this area requires that the environmental impact of the two plants be examined in toto. Blockchain-based monitoring technology would allow both the public and regulators to see the resultant subsurface commingled plume and possibly pave the way to a more comprehensive remedy.
Issues involving contamination of multiple media have also arisen at sites where discharges of volatile organic compounds or VOCs have occurred. In Silicon Valley, where I live, many engineering consultants have made their living chasing plumes of VOC chemicals (e.g., TCE) and then, when deemed appropriate, have installed various groundwater treatment plants tucked in the back of parking lots of companies like Google or HP to ameliorate this contamination. Santa Clara, the central county in Silicon Valley, is home to more Superfund sites than any other county in the United States.
The process is analogous to rinsing detergent from a sponge. After many rinses, it still seems to have more in it. It is an endless process with little environmental benefit. Has anyone looked at the additional impact of the high energy demand for treatment systems that have minimal effect on improving groundwater, but can contribute significant CO2 equivalents to the atmosphere?
With blockchain technology, we could simultaneously measure the positive effect of the treatment plant removing contaminants from water and the negative impact that this same plant produces by contributing to the CO2 emissions. Quantities of removed chemicals over time could be plotted in real time vs. CO2 emissions produced resulting from high energy usage of the treatment plant. This would allow companies operating treatment plants and regulators overseeing them to determine at what point in time continued treatment could be harming, not helping the environment. It is these type of analyses that would benefit society and help with the decision to shut down a remediation process when diminishing returns of the treatment system are reached.
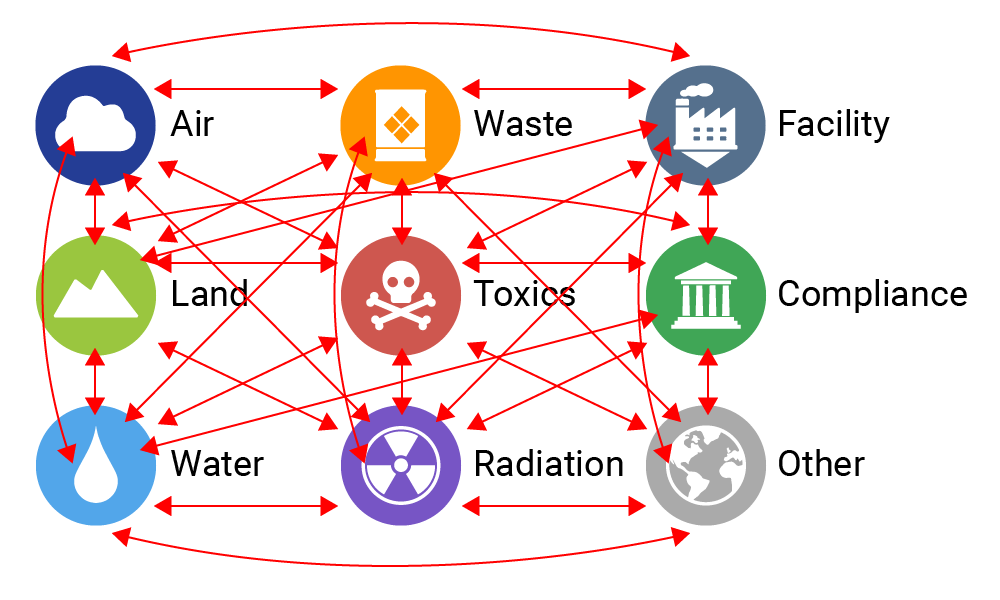
Figure 2: Interaction of incompatible emission sources is better managed if emissions are aggregated than if independently monitored and stored in disconnected databases.
How would blockchain technology help in a scenario like this? Chemical removal rate would be tracked in one block (of the chain) and CO2 emissions in another. Owner and regulator would agree on the formula to determine when the treatment process ceases to produce a significant environmental benefit. At this point, the system would be shut down. All of this would be monitored and measured in real time, and more importantly, it would be transparent to the owner, regulator, and the public.
Emissions measures should be preemptive, not reactive
When you think about emissions, they are generally (except incidents and accidents) operating problems that can be managed and optimized before discharges even happen. It is to the benefit of companies to do it this way. Every process that has an exhaust or smokestack for dispersing air emissions or pipelines for discharging liquids to surface receptors or water bodies could be managed to reduce harmful emissions coming out the system regardless of regulatory prescribed permissible levels. As an organization with a legacy environmental site knows, it is far more cost-effective to eliminate the original cause of emission than to spend decades of effort to remediate after the fact.
Unfortunately, many businesses are currently not genuinely looking at the aggregated data they collect about their emissions, wastewater, and energy use alongside their operational metrics. Current practices for EHS+S data management only allow for very simplistic comparison of normalized indicators between these disparate data sets. But it would benefit these operators to gather, aggregate and analyze data, and then make better, more cost-effective decisions as part of their risk-management protocols, while still maintaining their environmental compliance requirements.
Blockchain technology allows for review of more detailed data when making decisions with aggregated data sources so that managers can look beyond the simple normalized performance indicators. For example, many organizations only review their environmental and sustainability performance on an annual basis, mainly because the current tools to aggregate this data require them to be evaluated on a consistent time frame, and there is a significant investment in bringing all of the relevant data together.
But through blockchain technology, the data maintain their connection at every level. This allows for trend evaluation at other time frames not currently being examined. So if some short-term operational practice causes a spike in emissions, that issue can be identified and resolved immediately, rather than waiting for the end of the year, when the emissions have already happened, and the effect may not even be apparent when averaged out on an annual time frame. Then, even looking beyond the facility or organization, blockchain also allows for data aggregation across industry, region, and country, so that we will be in a better position to forecast the future and assess the viability of different measures to ameliorate the problems confronting us.
A bigger picture
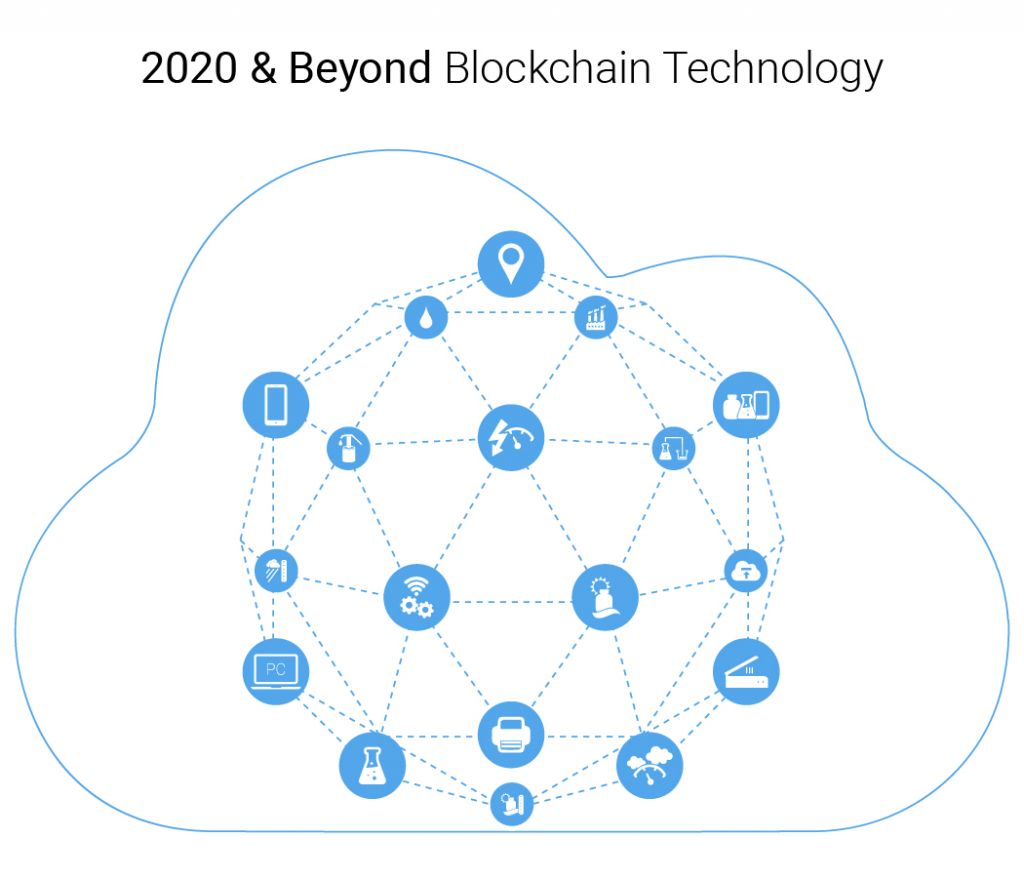
There is a growing need for companies to bring together information from their vast disconnected databases, single tenant clouds, and spreadsheets, and then mine the data they collect from these sources. In a decade or so, planet Earth may be a meshed grid of static sensors coupled with movable ones installed on people, animals (yes animals roaming in the wild), transportation devices, and other moving objects to collect data in real time. The conversation about the environmental landscape has evolved drastically over the last 50 years as we continue to understand the extent to which human activity has affected the planet. Companies and society need a collective and holistic understanding of the problems we face.
The only way to understand the full picture, and in turn to act meaningfully on a global level, is for all individuals and companies to understand the impact of their activities. It’s impossible to mitigate the net risks and effects of these activities on the planet when we have not fully assembled the data to characterize the problem and understand the full picture. Blockchain technology offers the best path forward, making it possible for environmental data be integrated at multiple levels.
Any coordinated effort of this magnitude will be years in the making, but every journey starts with a first step. There are two impediments to institute a change like this: technology (until recently, blockchain did not exist) and a government with the initiative to require such technology. Just as was the case with the internet revolution of the nineties, the rate of progress in technology is surpassing politicians’ ability to come to grips with its impact on society.
So far, there have been no imposed data exchange standards; a prerequisite for a broad data exchange, land for implementation of blockchain technology. But in the meantime, progressive organizations will want to start taking advantage of this technology to look at their operations and make more informed EHS+S decisions.
Looking forward with blockchain technology
Perhaps blockchain technology is not ready for prime time. Some may argue that it creates a secondary problem of additional energy consumption much like water treatment systems described earlier. This is a theme that is advocated by some media outlets and blockchain skeptics who argue that the computer algorithms require significant amounts of electricity to power the servers on which they run. Estimates of blockchain’s soaring energy use are likely overstating the electric power used as the current debate on power consumption is not backed by hard data. When it comes to technology, history has consistently shown that the cost will always decrease, and the impact will still increase over time. It is inevitable that blockchain technology will become more accessible with reduced infrastructure over the next few years.
Blockchain could completely change how companies run their businesses and present new opportunities far beyond sustainability and environmental emissions management.
We are living in a world where companies and governmental agencies are not able to comprehensively analyze EHS+S information efficiently. Using blockchain technology will allow organizations to track, store, rollup, gain insights into, and also share their data with other interested parties as needed. It has the potential to put accurate and verifiable information into the hands of companies and regulating agencies more quickly. To make better progress on how we use EHS+S information, regulators will need to find ways that reward positive and proactive behaviors. We are not going to solve these issues by fining emitters until they behave.
Blockchain technology can help us move us away from the punitive approach and toward a more collaborative one by assisting companies to reduce their emissions while lowering their operating costs at the same time. Social sharing elements may also play a role here, giving companies that benefit from the fruits of blockchain technology a valuable marketing and PR advantage over those who do not adopt this technology, and as such, lag behind in their progress on environmental issues.
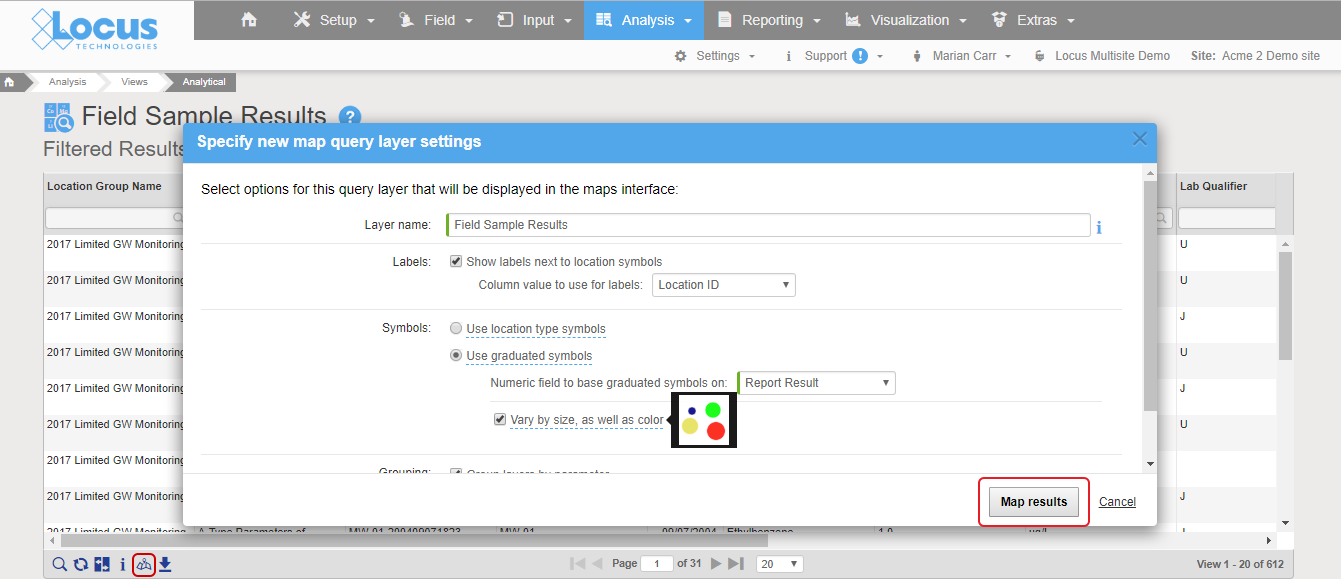
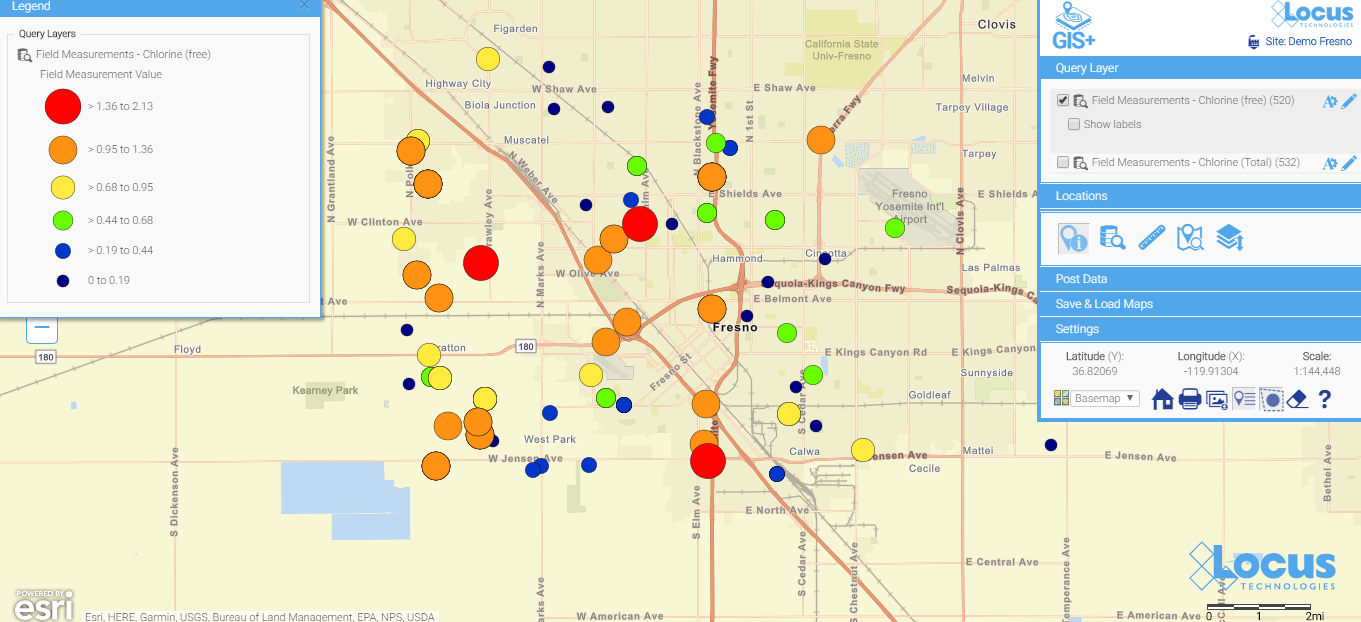
 See your data in new ways with Locus GIS for environmental management.