Environmental Information Management (EIM) Subsurface Visualizations
Both EIM and Locus Platform, applications from Locus Technologies, let you manage your environmental data gathered from surface sampling locations. But did you know you can manage and visualize your data from subsurface locations?
With the subsurface functions in Locus applications, you can track boreholes and enter solid sample information such as soil type, lithology, recovery, and blow count. You can link analytical results, field readings, and geophysical test measurements taken at different depths in the borehole. If a borehole is converted to a well, you can load well completion details including all components of the constructed well. You can link wells to multiple screened intervals related to specific aquifers.
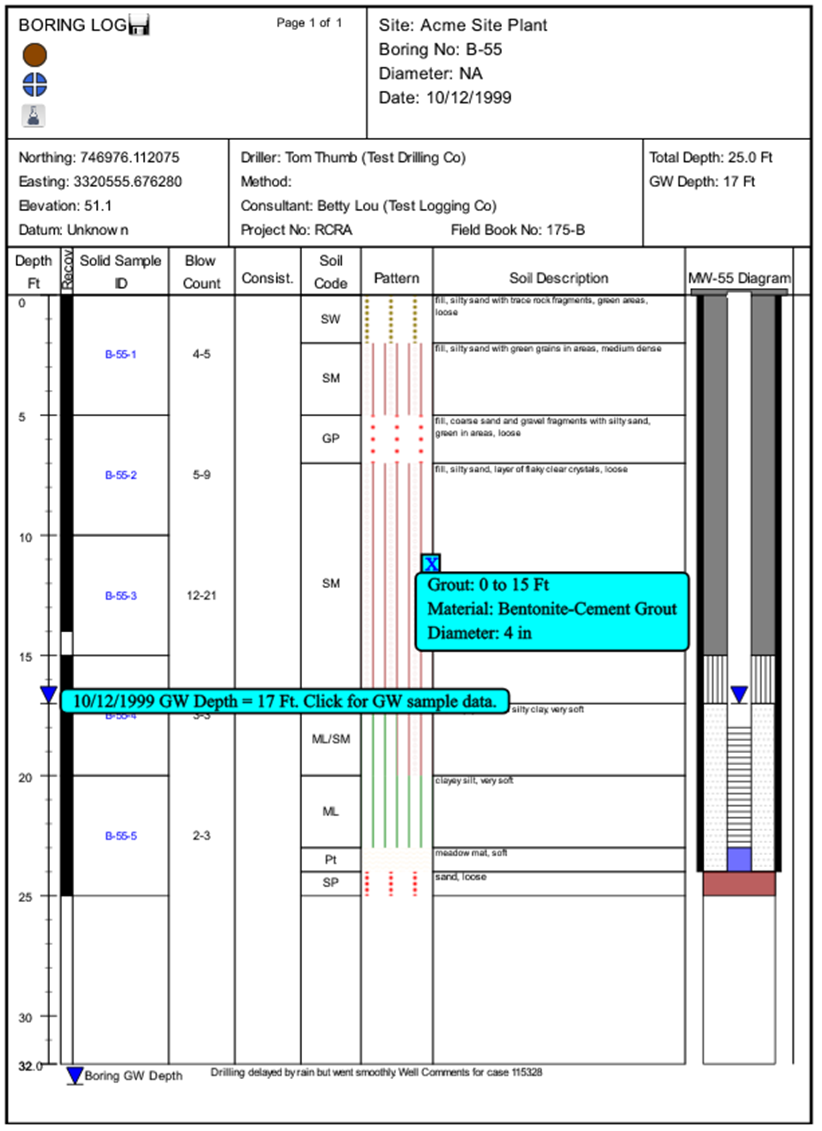
Once you have entered your data, you can generate interactive visualizations. You can display individual boreholes or wells on a borehole log as shown below, to see solid sample attributes and a well construction diagram. You can click various parts of the log to drill down into the data to view charts of groundwater levels over time for the borehole, or to generate grids of sample results for different depths.
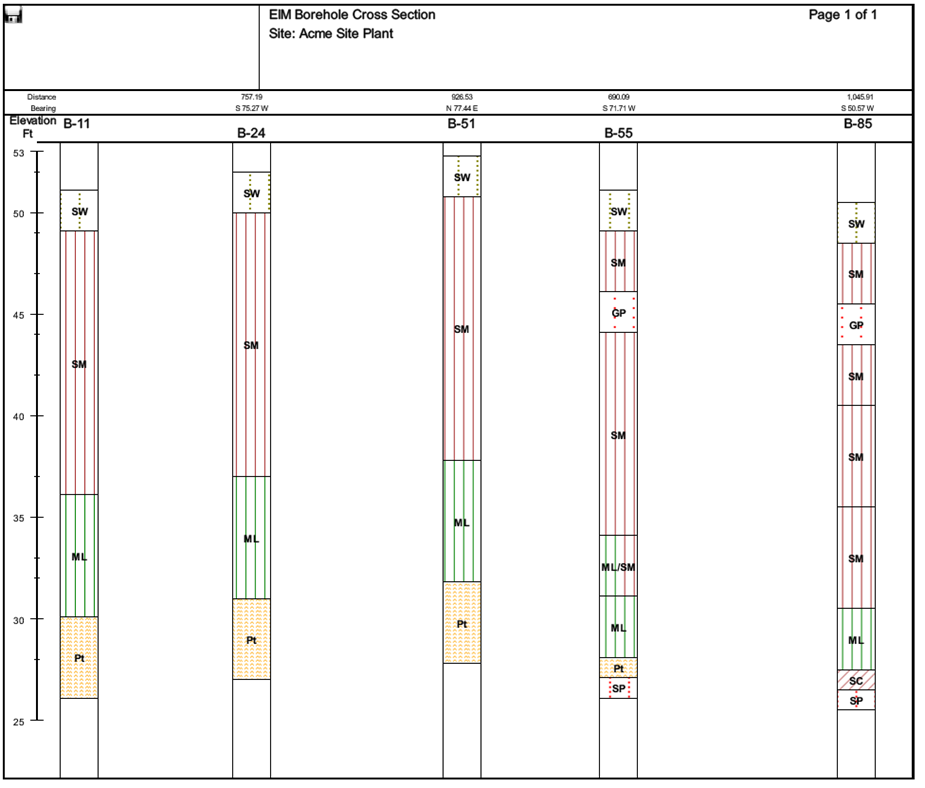
Multiple boreholes can be shown together on a profile, as shown here.
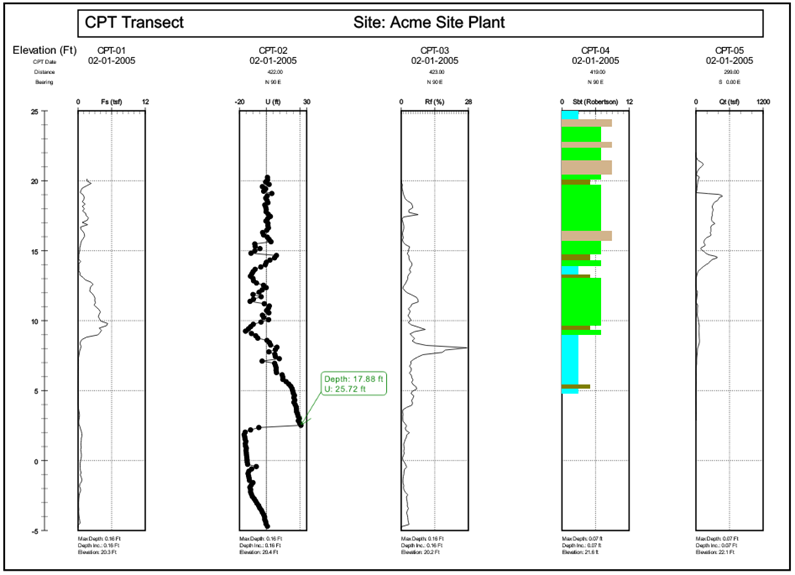
If you perform CPT (cone penetration testing), you can use Locus applications to store and visualize that data. Shown below is a multiple CPT transect. You can display different test results including tip resistance, sleeve friction, piezocone readings, friction ratio, and soil behavior type.
These visualizations show the strength of Locus’s applications for storing and displaying subsurface data on interactive logs and profiles. A future blog post will show how you can use subsurface data with Locus GIS+ to perform contouring and other analysis.