The Horrors of Excel for Data Management

Locus has been preaching on the pitfalls of Excel for a long time. It’s no surprise that one of the worst imaginable errors in Excel that could’ve happened, did. Almost 16,000 COVID-19 cases in England went unreported because Public Health England hit the maximum row count in their version of Excel.

This is not the only example of Excel being misused or being the wrong tool entirely for the job. Excel is not in any way a data management system for complex or vital data. When it comes to sustainability reporting and environmental data management, the evils of the grid are a force to be reckoned with. We have highlighted a few examples that will have you shivering.
Excel Horrors - Evils of Autofill

Case 1: The Evils of Autofill

Take a look at this harmless-looking chart. It shows monthly electricity consumption for a facility set to report:

Month  Monthly Electricity Consumption (MWh) 
January 2019  133,500 
February 2019  122,400 
March 2019  138,900 
April 2019  141,600 
May 2019  141,601 
June 2019  141,602 
July 2019  141,603 
August 2019  141,604 
September 2019  141,605 
October 2019  141,606 
November 2019  141,607 
December 2019  141,608 

During review, the auditor notices a distinct trend from April to December, indicating false data overwritten by a stray double-click. Eventually, the auditor required re-entering all invoice data for dozens of facilities to correct the issue. Where the original data went and how autofill went astray remains a mystery.


Excel Horrors - Phantom File Editor

Case 2: The Phantom File Editor

Imagine using a massive spreadsheet with lots of linked calculations for your annual sustainability report. One of the team engineers works on the file to input more data and get it ready for presentation. But in the final steps, they accidentally delete one of the formulas that sum up the indicators. The annual total looks great for the presentation since you’ve effectively removed a portion of your resource consumption, but afterwards you discover the conclusions were incorrectly calculated.  How did that error get introduced?  The spreadsheet has no auditing capabilities on the individual values, so you may never know.

Excel supports multiple users editing one document simultaneously, but not well.  Multiple records are saved, edits are lost, and vital data vanishes, or at best is very hard to recover. The Track Changes feature is not infallible, and over reliance on it will cause hardship.
Excel Horrors - Date of the Dead

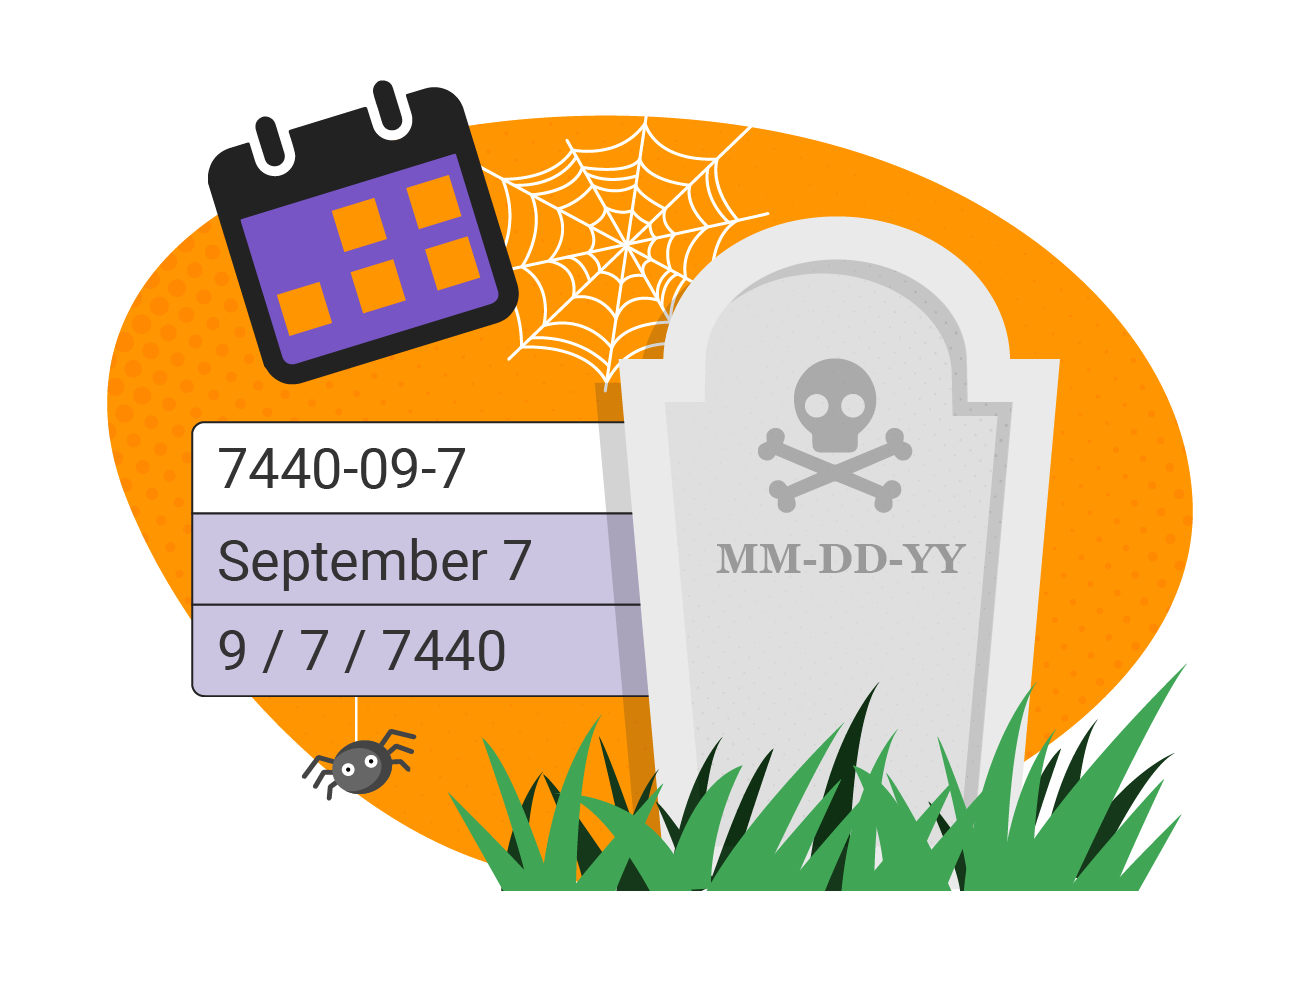
Case 3: Date of the Dead

Excel has a frustrating insistence of changing CAS numbers into dates, even if they are something like “7440-09-7″ turning into September 7, 7400. If you’re not explicit in your cell formatting, Excel isn’t happy leaving values as they are.


Excel Horrors - Imposter Numbers

Case 4: Imposter Numerical Values

You meant to type 1.5, but you typed “1..5” or “.1.5”. Does Excel reject these imposter numbers or let you know of a potential error? No, it’s stored in Text format. This can throw off any averages or sums you may be tracking. This minor identity theft can cause a real headache.


Other Significant Cases:

Other data quality issues with using Excel include, but are not limited to:

  • Locations with multiple variations of the same ID/name (e.g., MW-1, MW-01, MW 1, MW1, etc.)
  • Use of multiple codes for the same entity (e.g., SW and SURFW for surface water samples)
  • Loss of significant figures for numeric data
  • Special characters (such as commas) that may cause cells to break unintentionally over rows when moving data into another application
  • Bogus dates like “November 31” in columns that do not have date formats applied to them
  • Loss of leading zeros associated with cost codes and projects numbers (e.g., “005241”) that have only numbers in them but must be stored as text fields
  • The inability to enforce uniqueness, leading to duplicate entries
  • Null values in key fields (because entries cannot be marked as required)
  • Hidden rows and/or columns that can cause data to be shifted unintentionally or modified erroneously
  • Inconsistent use of lab qualifiers— in some cases, these appear concatenated in the same Excel column (e.g., “10U, <5”) while in other cases they appear in separate columns

As you can see, the horrors of Excel are common, and terrifying. Without a proper system of record, auditing features, and the ability for data to vanish into the ephemera, Excel offers little in the way of data security and quality for organizations managing vital environmental and compliance data. Many are learning firsthand the superiority of database management systems over spreadsheets when it comes to managing data. Now is the time to examine the specific shortcomings of your current system and consider your options.

Contact us today to learn how Locus makes complex data management a little less spooky!

    Name

    Company Email

    Phone

    Tell us about your company's needs

    Locus is committed to preserving your privacy.

    7 Useful Visualization Tools for Environmental Management

    The ability to visualize your field and analytical data across maps, logs, and charts is a crucial part of managing environmental information. Locus makes it easy to visually display and export data for sharing in reports and presentations. We’ve compiled 7 of the most useful visualization tools in our environmental information management software.

    Data Callouts

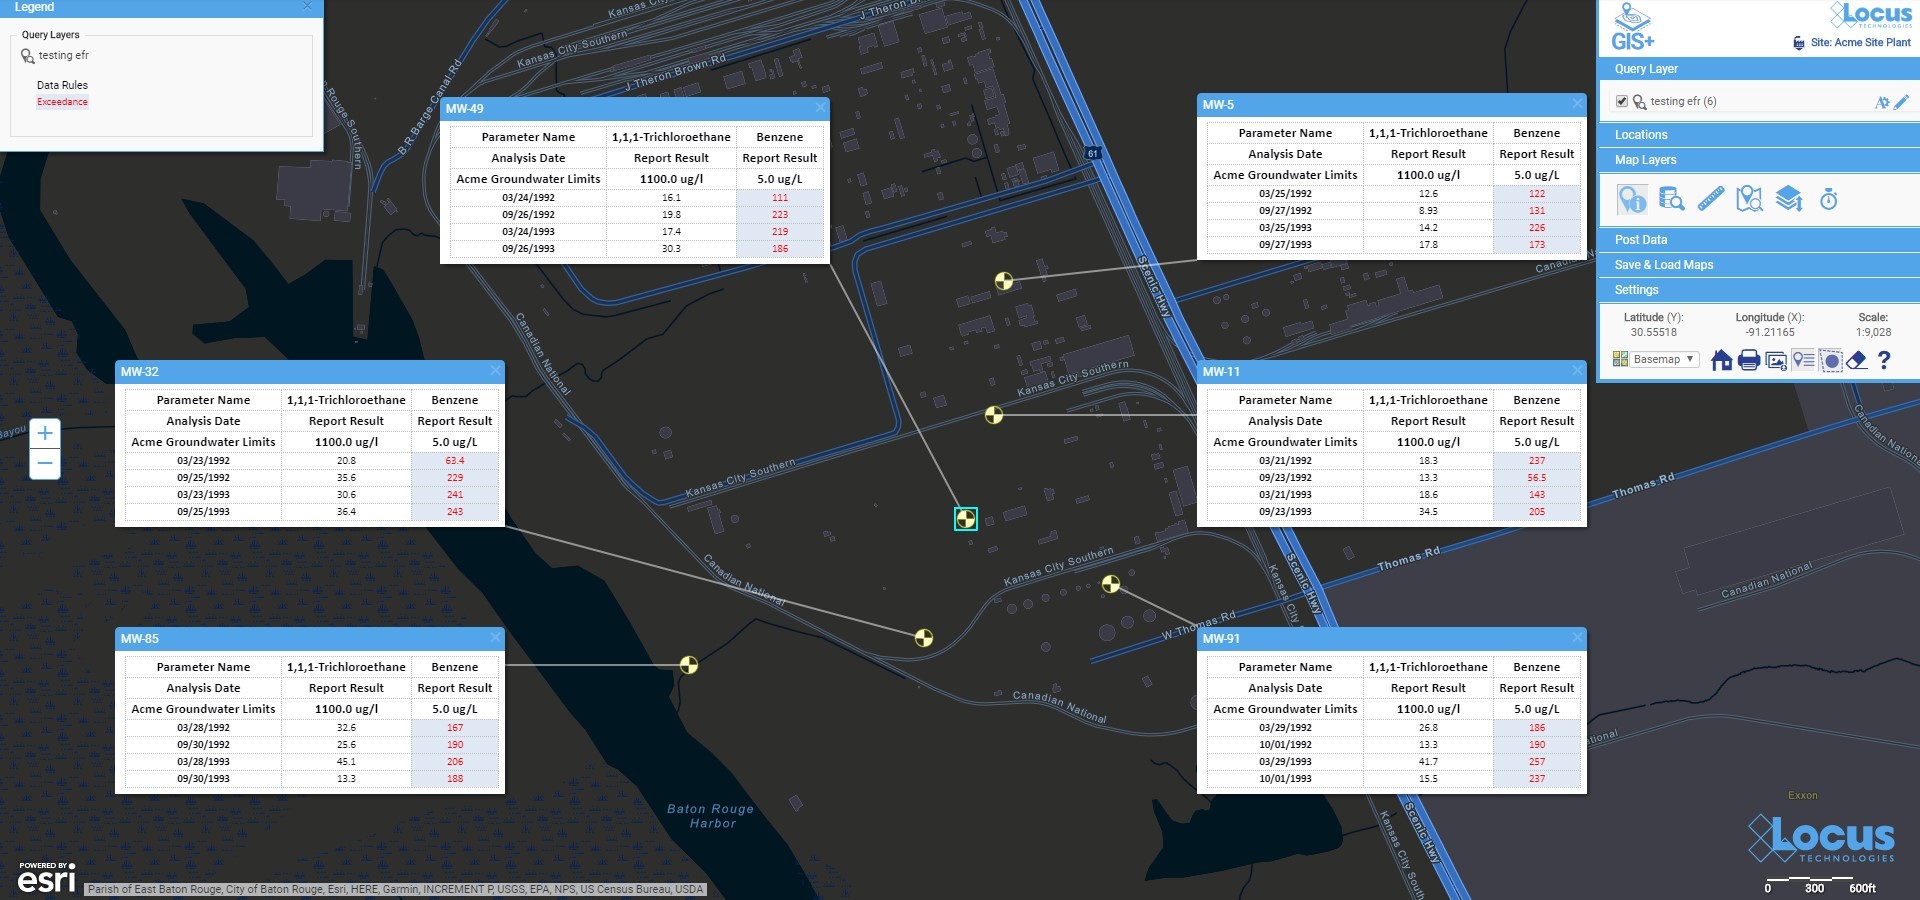
    View your data in easy-to-read text boxes right on your maps. These are location-specific crosstab reports listing analytical, groundwater, or field readings. A user first creates a data callout template using a drag-and-drop interface in the EIM enhanced formatted reports module. The template can include rules to control data formatting (for example, action limit exceedances can be shown in red text). When the user runs the template for a specific set of locations, EIM displays the callouts in the GIS+ as a set of draggable boxes. The user can finalize the callouts in the GIS+ print view and then send the resulting map to a printer or export the map to a PDF file.

    Locus GIS Data Callouts


    Graduated Symbols

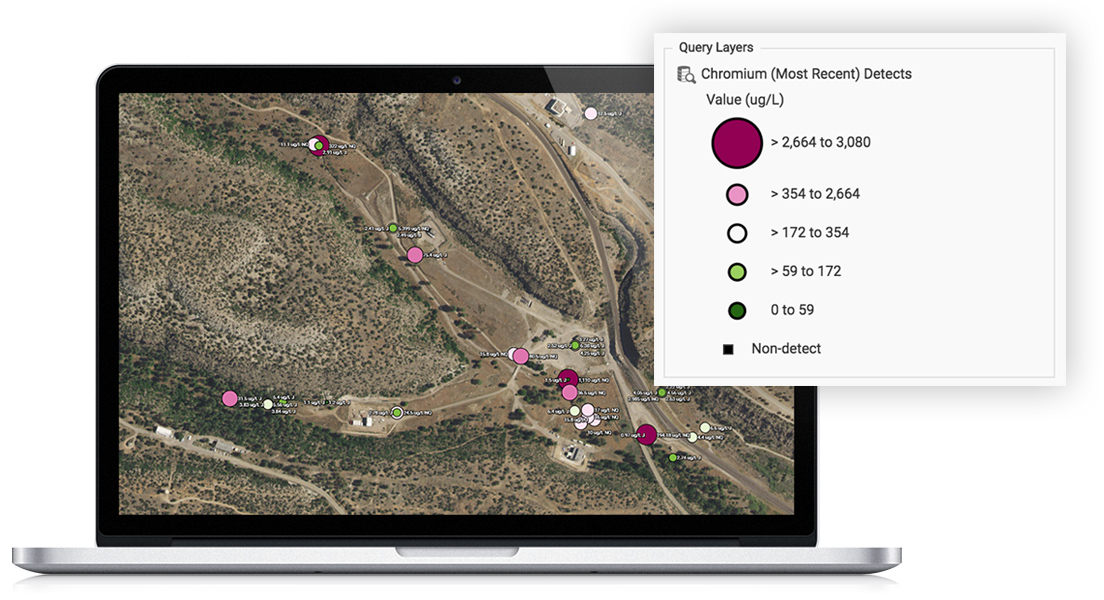
    Locus GIS features high-quality and industry specific graduated symbols so that you can compare relative quantitative data on customizable maps. Choose graduated symbol intervals, sizes, and colors from a large selection of color ramps and create multiple layers for data analysis. It also features a location clustering option, ideal for large sites, a historical challenge for mapping.

    Intellus GIS+ maps


    Charting

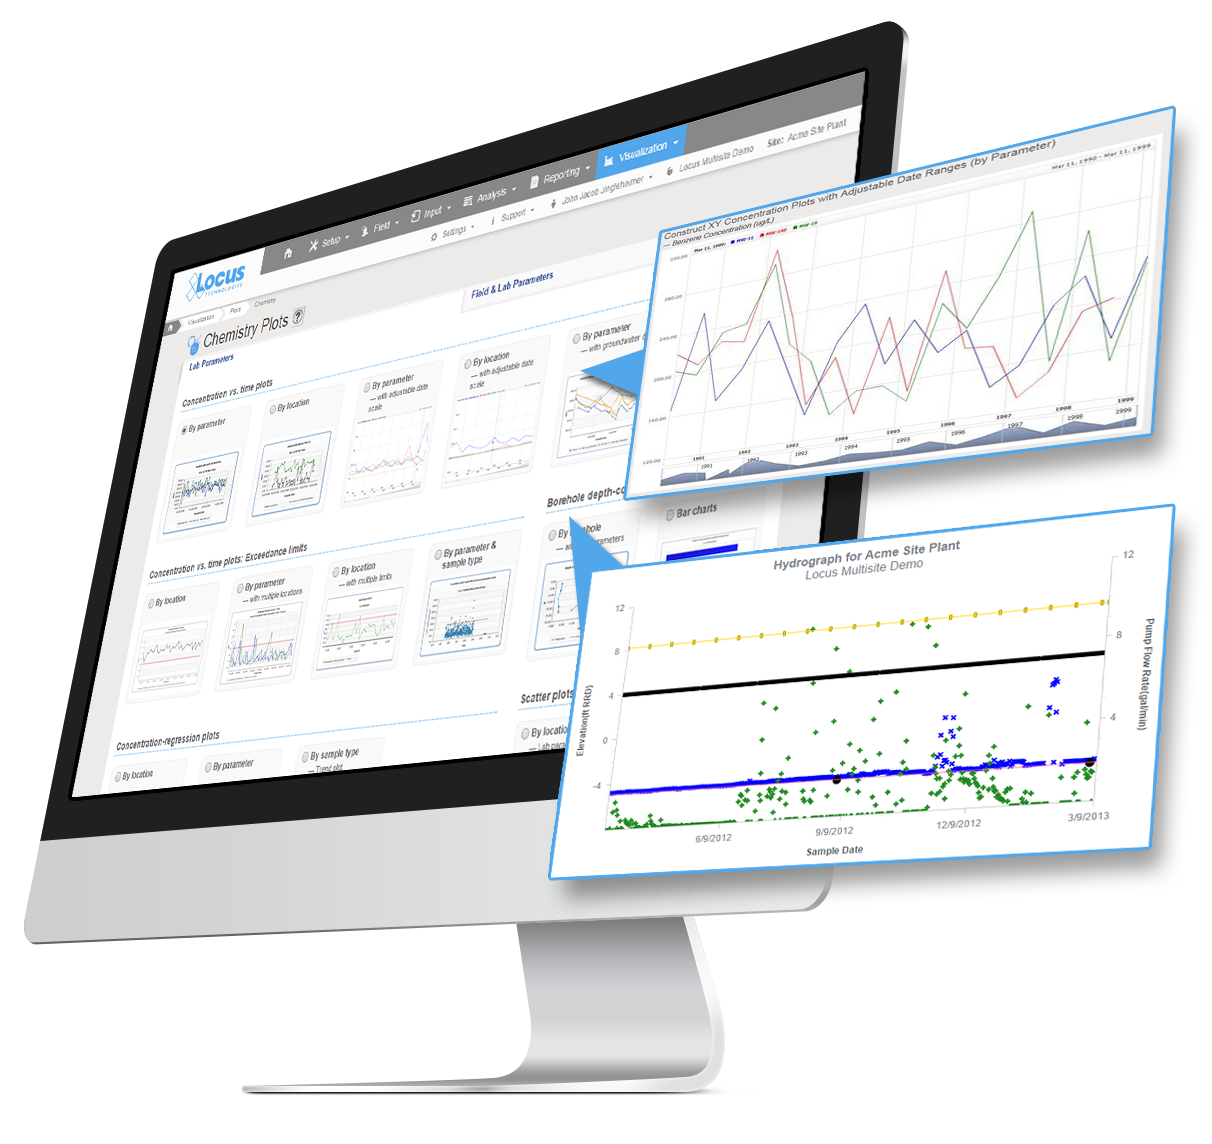
    Multiple charts can be created in EIM at one time. Charts can then be formatted using the Format tab. Formatting can include the ability to add milestone lines and shaded date ranges for specific dates on the x axis. The user can also change font, legend location, line colors, marker sizes and types, date formats, legend text, axis labels, grid line intervals or background colors. In addition, users can choose to display lab qualifiers next to non-detects, show non-detects as white filled points, show results next to data points, add footnotes, change the y-axis to log scale, and more. All of the format options can be saved as a chart style set and applied to sets of charts when they are created.

    Screenshots of EIM chemistry plots menu with two sample plots


    Time Sliders

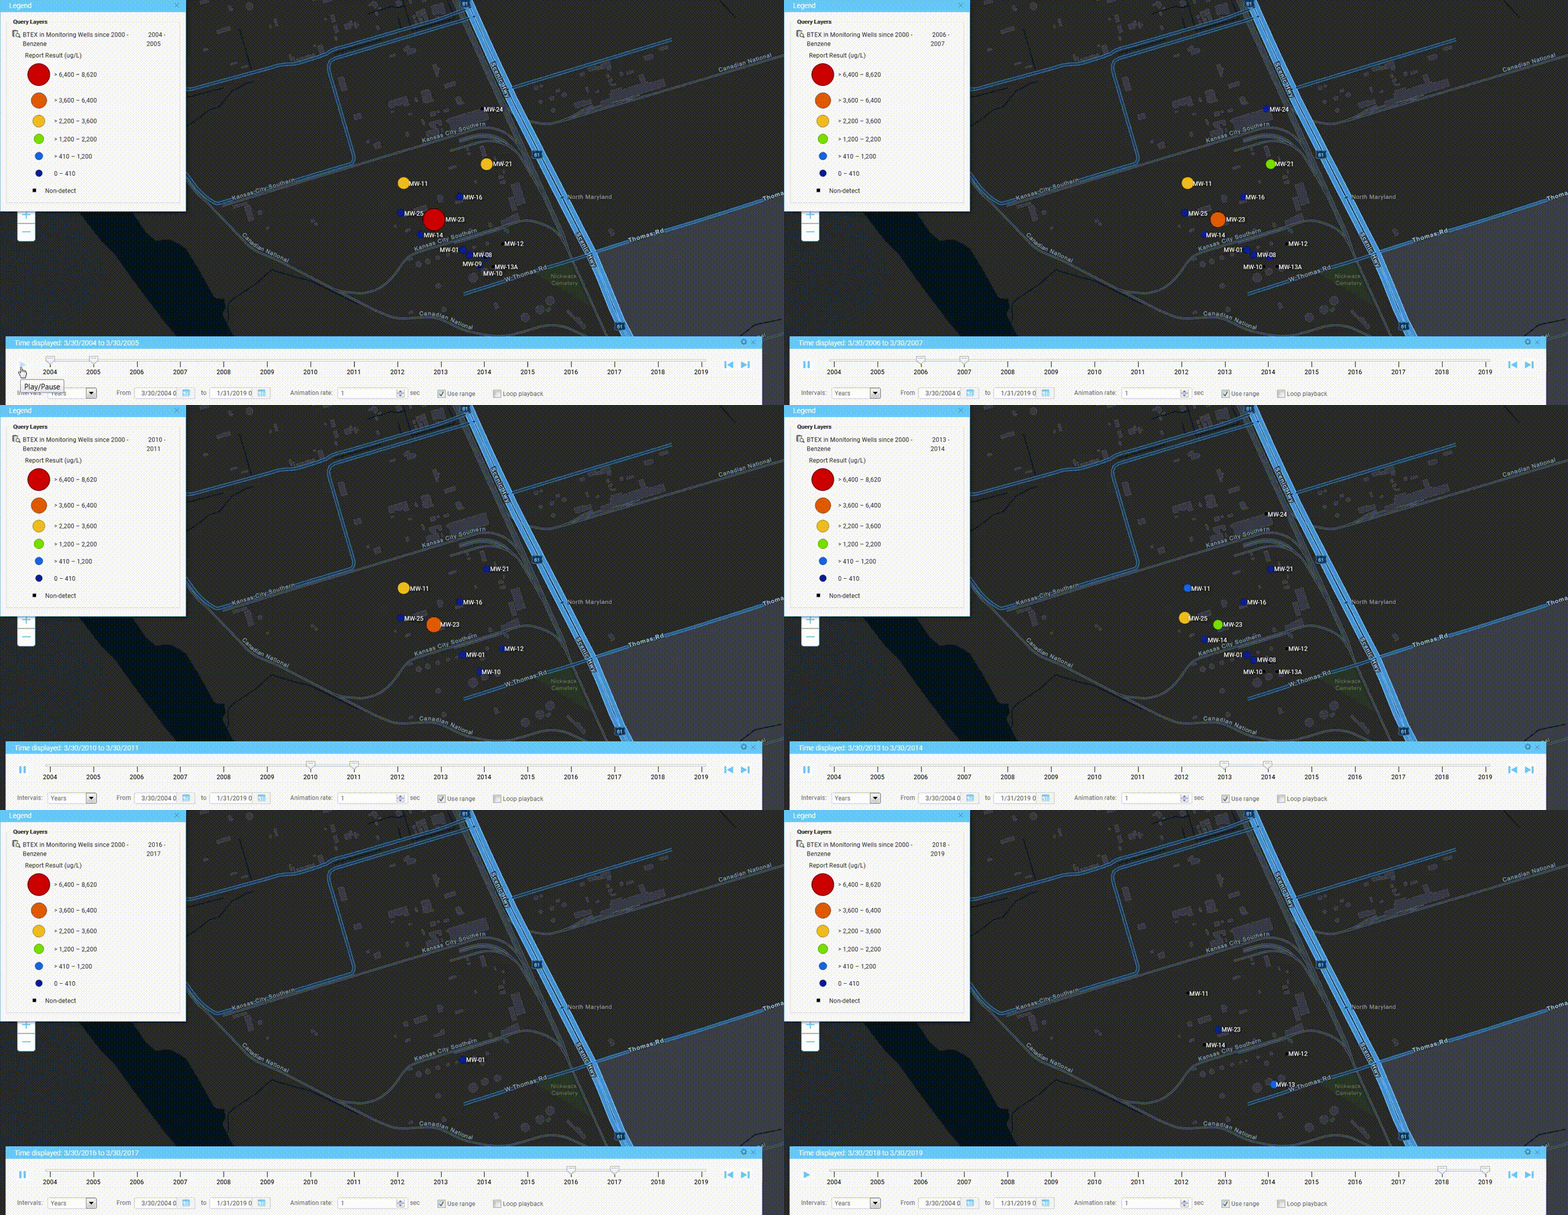
    Locus has adopted animation in its GIS+ solution, which lets a user use a “time slider” to animate chemical concentrations over time. When a user displays EIM data on the GIS+ map, the user can decide to create “time slices” based on a selected date field. The slices can be by century, decade, year, month, week or day, and show the maximum concentration over that time period. Once the slices are created, the user can step through them manually or run them in movie mode.

    GIS+ time slider in action


    Augmented Reality

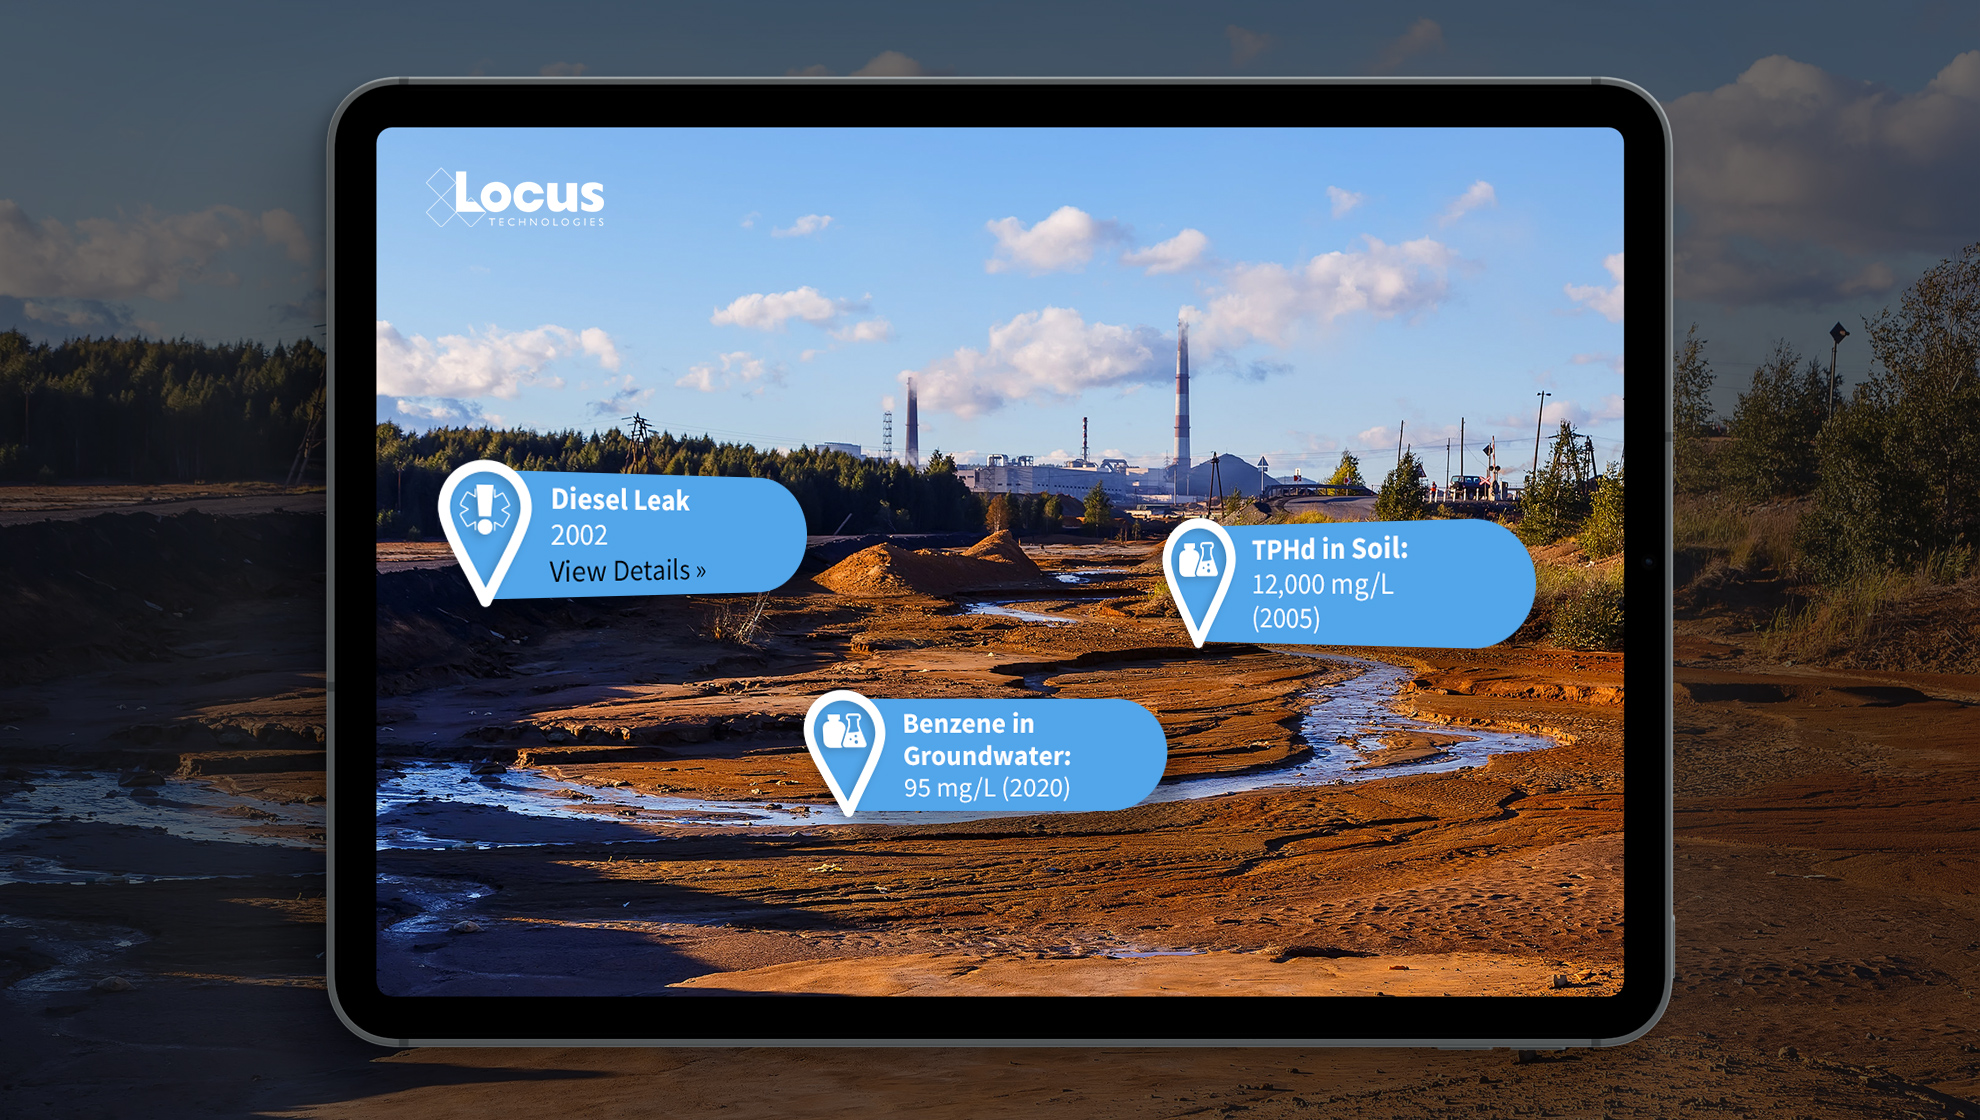
    Locate and identify inspection and/or monitoring locations on your mobile device. View real-time and historical environmental data to quickly find areas of interest for your chemical and subsurface data. Use your camera to get precise geotagged information for spills, safety incidents, historical chemical sources, subsurface utilities, or any other type of EHS data.

    Locus Augmented Reality


    Boring Logs

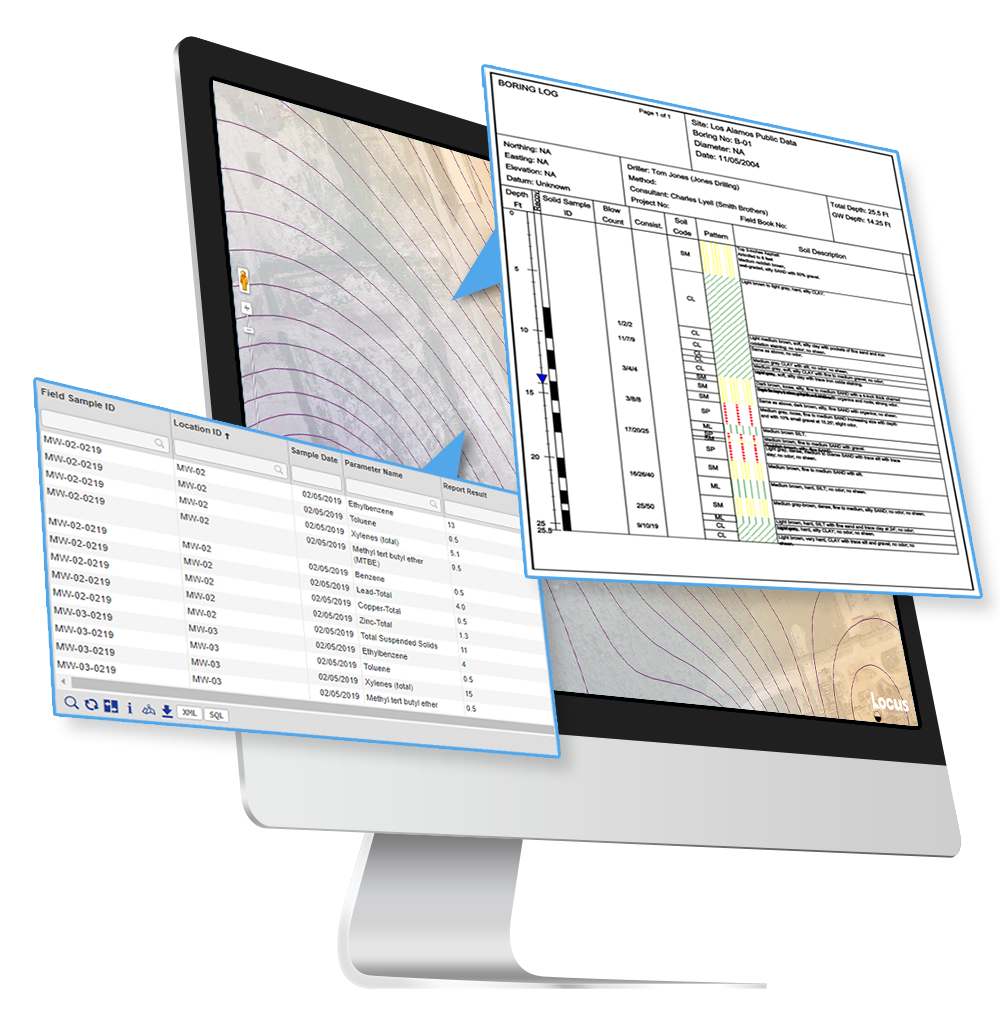
    Create and display clickable boring logs of your sample data—using custom style formats and cross-sections. Show depth ranges, lithology patterns, aquifer information, and detailed descriptions for your samples.

    Locus GIS+ boring logs on groundwater contour lines


    Contours

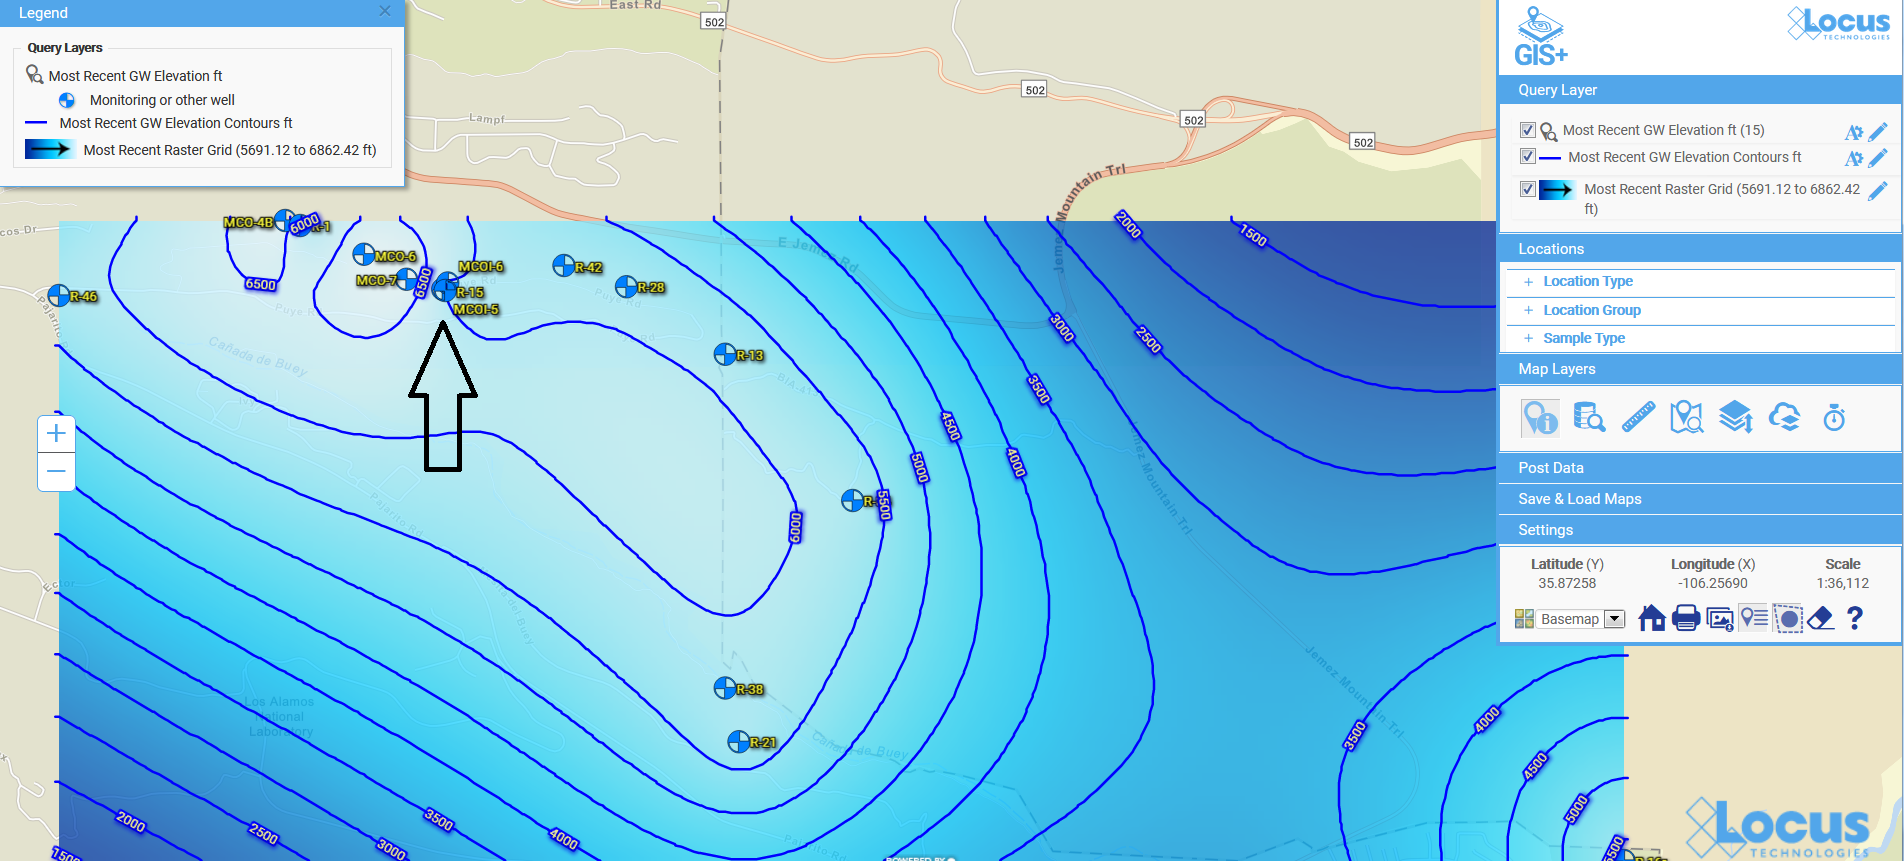
    Create and visualize custom contours using multiple algorithms. Because visualizations let you chunk items together, you can look at the ‘big picture” and not get lost in tables of data results. Your working memory stays within its capacity, your analysis of the information becomes more efficient, and you can gain new insights into your data.

    Contour map for groundwater in Locus GIS+


    Contact us to see more

    Send us your contact information and a Locus representative will be in touch to discuss your organization’s environmental data management needs and provide an estimate, or set up a free demo of our enterprise environmental software solutions.

      Name

      Company Email

      Phone

      Tell us about your company's needs

      Locus is committed to preserving your privacy.

      Carbon Offsets Have a Huge New Problem—Wildfires

      As if the world of calculating forest and natural assets to be used as carbon offsets for big businesses isn’t complicated enough, now there’s a huge new, unexpected issue. Wildfires are threatening the underlying nature itself.

      Oregon Wildfire

      A pyrocumulus cloud from Oregon’s Bootleg Fire can be seen for miles as it burns in the Freemont-Winema National Forest. As of Thursday night, the fire had burned more than 400,000 acres, including forest that had been preserved to compensate for greenhouse gas emissions elsewhere. Photo: National Interagency Fire Center.

      The wildfires in the American West this past summer, including one big fire in Southern Oregon, the Bootleg Fire, torched a large percentage of land set aside for carbon offsets. Another fire in Washington State threatened an Indian reservation carbon offset project. Companies who produce greenhouse gases pay nature and forest reserves to maintain and build themselves out to help trees pull carbon from the atmosphere. The offset allows the companies to claim they are carbon neutral. The more they pollute the more they pay. A growing financial market for offsets in Europe, the UK and now China is based on the premise these assets can be correctly measured and managed.

      That premise routinely comes under fire, as one forest is different from another, some trees in the same forest suck carbon at a different rate then others and, of course, there’s no way to tell how a forest used as an offset today will look 100 years from now. Now the natural land is coming under fire literally. In order to counteract CO₂’s climate-warming properties, a carbon offset project needs to promise to sequester carbon permanently. That’s because CO₂ can linger in the atmosphere for up to 1,000 years. If the carbon that is avoided or removed ends up getting released, then the program is flawed. The impact of the fires is already generating calls from advocates who argue carbon output needs to be reduced at its source, not offset with money and accounting gimmicks. Those are legitimate arguments but as we are nowhere near approaching a global scenario like that, offsets are our best shot to make polluting more expensive and ultimately reduce it.

      The problem is that the offset market is developing so fast that all the parties in it — buyers, sellers, brokers — are profiting, and so are thinking of new ways to grow it. Already, ideas about securitization of carbon offset assets, where they would be packaged into tradable derivatives, like mortgages or interest rate products, are catching on.

      This feeds into more participants in the carbon market, and as a result, higher prices, and then more participants on that. On the European Trading System for carbon prices, the value of futures contracts for UK carbon topped $100 (£ 72.4 pounds) in late September amid the country’s petrol delivery crisis. But none of this compares to what could happen if global leaders can advance the idea of an international carbon price and emissions trading mechanism at the United Nations’ COP26 global climate summit in Glasgow in November.

      The carbon market, one way or another, is certain to develop in coming years, and with it, the potential for abuses. Those can be fought by new regulations and better policing of markets. But at present, there is nothing to stop the natural threat of fires or other disasters on the underlying offset assets. In the investing world, we call these developments Black Swans. Something completely unexpected that comes along and upends markets. Kind of like China’s sudden attack on its tech industry this past summer, and its impact on Chinese stocks worldwide. It is another sad and ironic tragedy of climate change that global warming itself is destroying the very tools we have to fight it.


      [sc_image width=”150″ height=”150″ src=”24014″ style=”11″ position=”centered” disable_lightbox=”1″ alt=”David Callaway, Callaway Climate Insights”]

      About the Author—David Callaway, Callaway Climate Insights

      David Callaway is founder and Editor-in-Chief of Callaway Climate Insights. He is former president of the World Editors Forum and editor of USA Today.


      [sc_button link=”https://www.locustec.com/applications/sustainability/greenhouse-gas/” text=”More on GHG” link_target=”_self” centered=”1″]

      6 Ways To Get Data Into Your EHS System

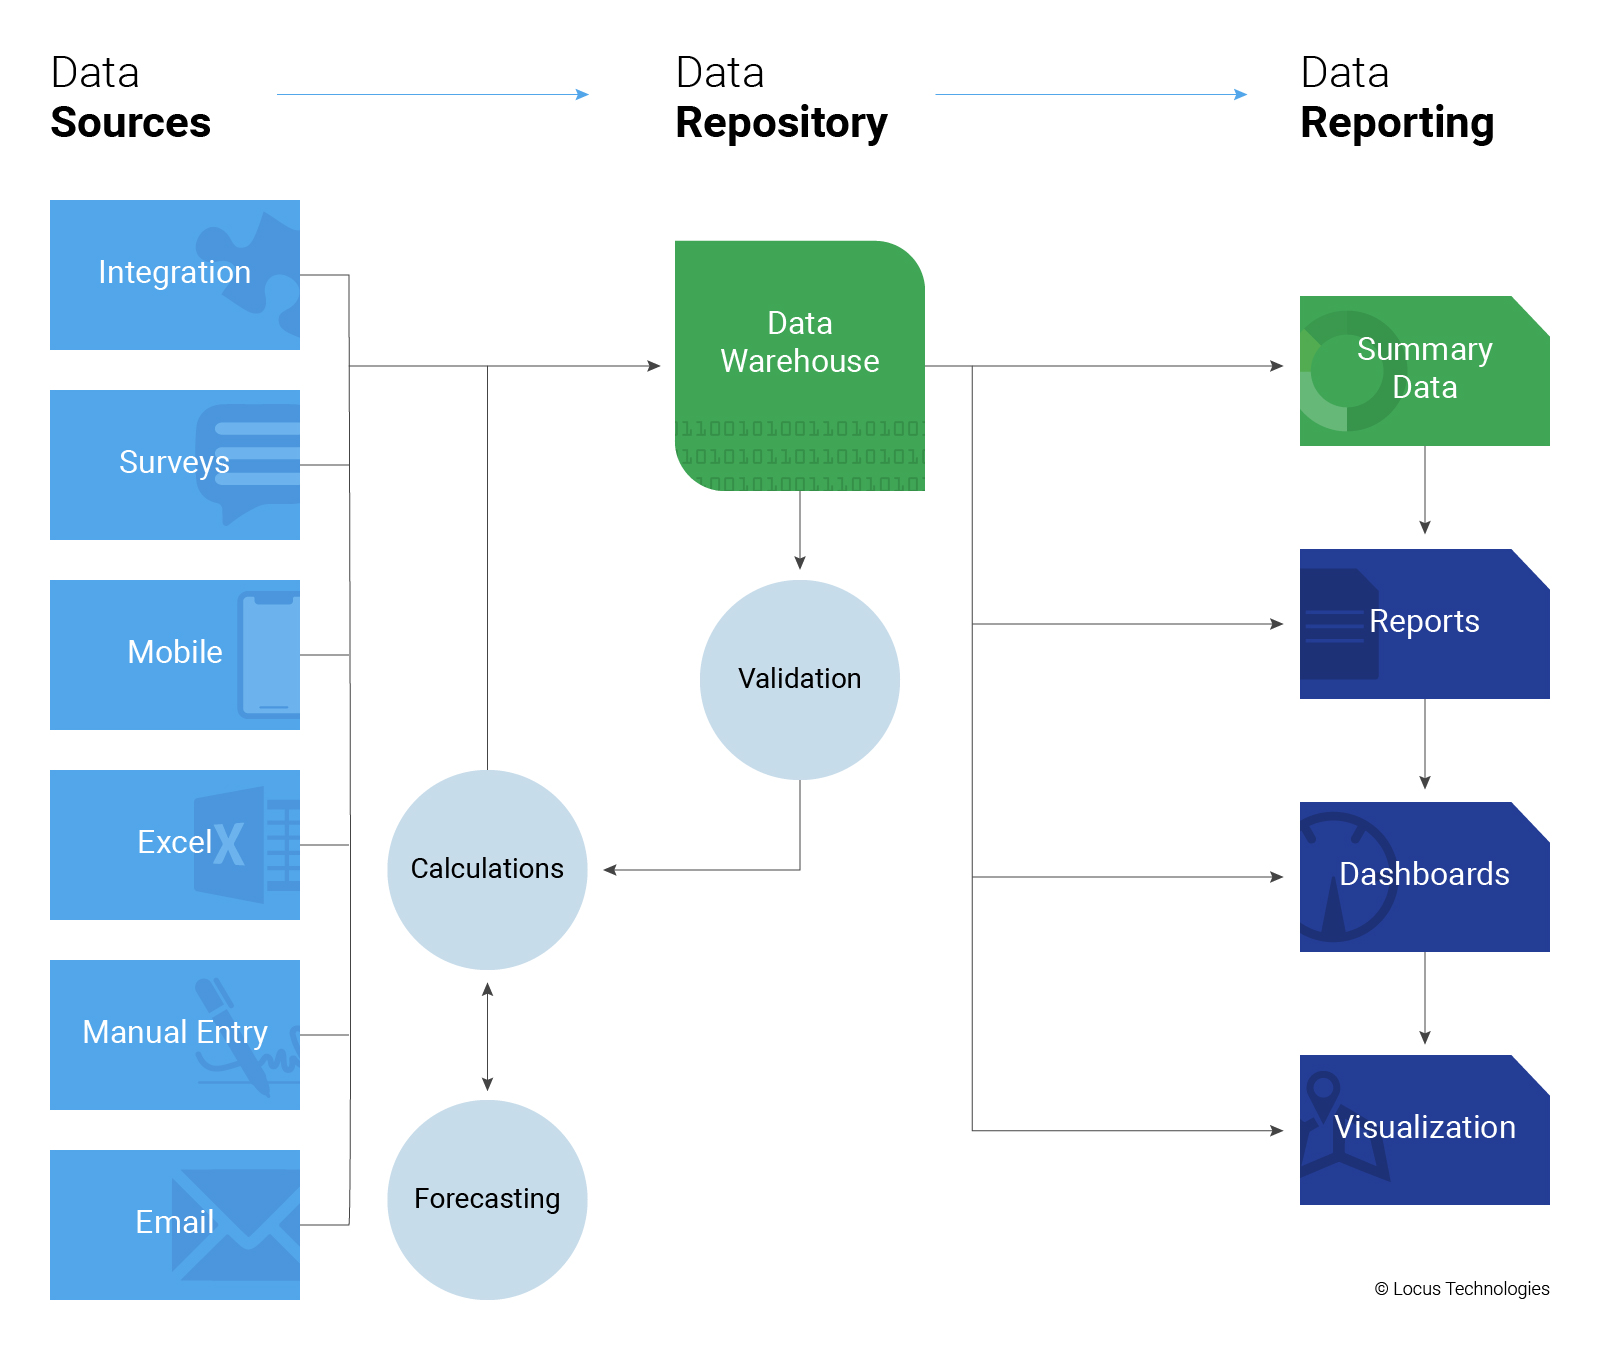
      Locus provides multiple methods to populate EHS, ESG, or any environmental data, including the following:

      6 Ways to Input Data


      Integrations

      Locus provides a full suite of REST API’s, and SDK that can be used to populate data from external data sources. Typical uses include utility data, CEMS, meter data and IoT data.


      Surveys

      Locus Survey tool enables you to issue survey questionnaires to people outside your organization, and enables them to securely and seamlessly respond directly into the survey form. Typical uses include supplier surveys, audits and customer questionnaires.


      Mobile

      User input forms can be optimized for input on a phone or tablet, which allows quick uploads of photos and also geotags your data so you can ensure it was collected at the right location.


      Excel and Text Files

      Locus provides a full suite of Excel upload tools that allow you to import data directly from Excel or CSV files. This option also allows you to work offline and re-sync your data later. Typical uses include laboratory data, periodic monitoring data and data migrations.


      Manual Data

      Like any system, Locus provides tools for users to directly enter data into the system. These include Locus sophisticated data validation tools which employs machine learning techniques to identify data entries which may be invalid, with visual indications of the expect range or ranges.


      Email

      Locus can be configured to directly read email input (as text) and place it into the system. Typical uses include instances where external users initiate a conversation, which then may be responded to from within the system, such as an inquiry, issue, or an incident report.

      Contact us to learn more

      Send us your contact information and a Locus representative will be in touch to discuss your organization’s environmental data management needs and provide an estimate, or set up a free demo of our enterprise environmental software solutions.

        Name

        Company Email

        Phone

        Tell us about your company's needs

        Locus is committed to preserving your privacy.

        5 Keys to Navigating ESG

        With sustainability practitioners strained to deploy limited resources internally to navigate the myriad of standards and frameworks to meet the growing appetite for environmental, social, and governance (ESG) information, we continue to ask, “Isn’t there an easier way to do this?” Navigating ESG Anyone who has worked to align standards and frameworks, corral internal champions around disclosure requirements, and marry quantitative performance data with narratives on management approach, knows that this is no easy feat.
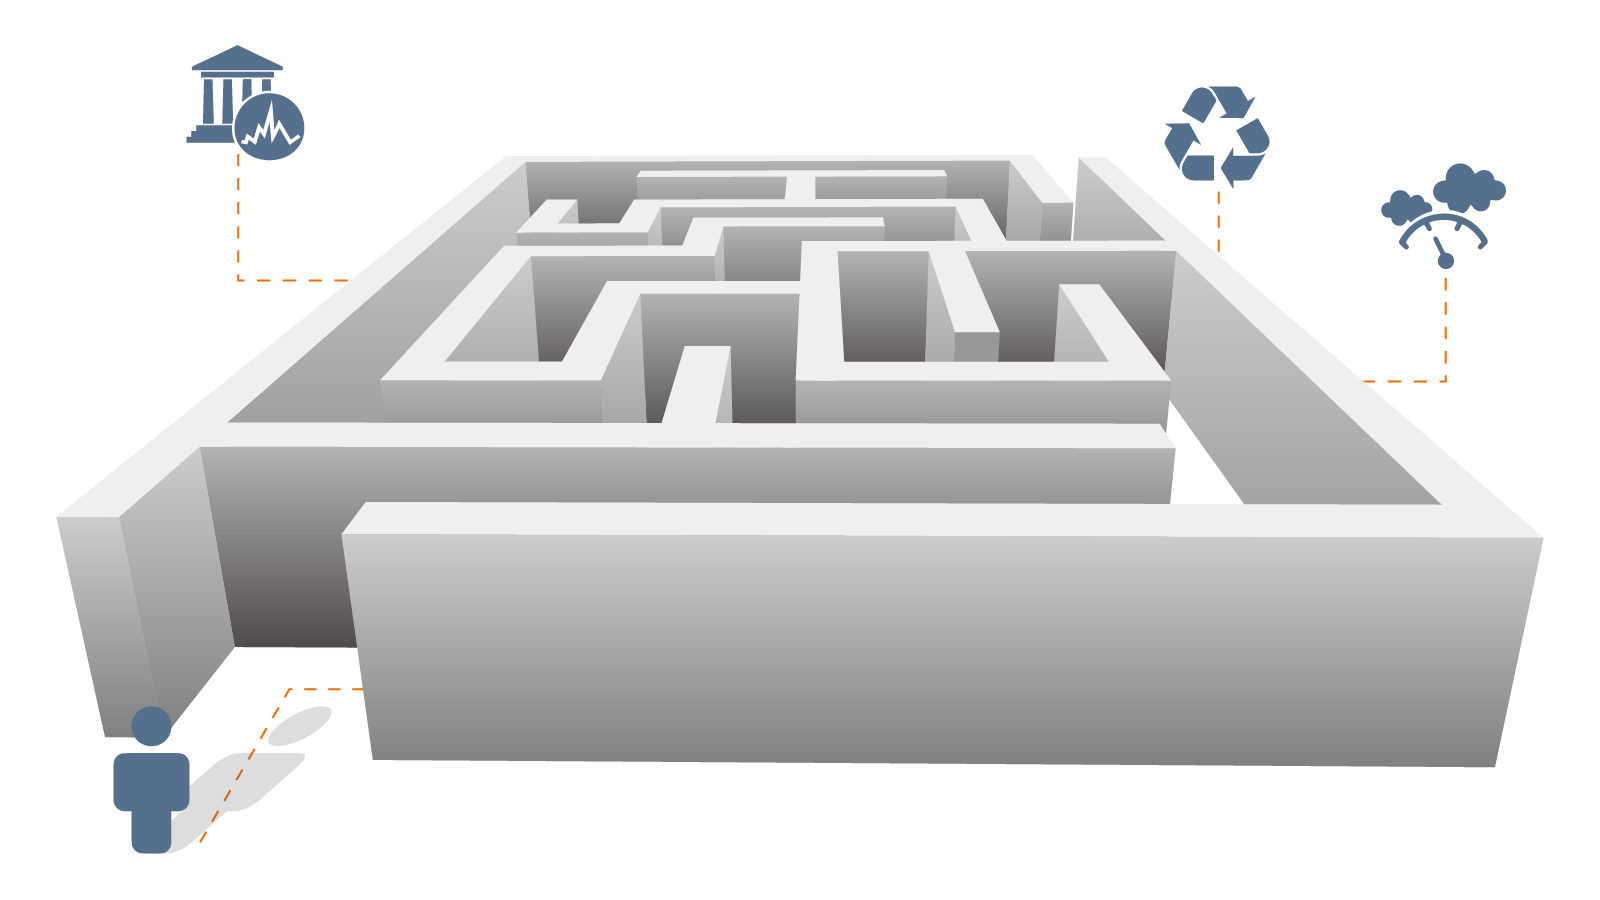
        The uphill battle to integrate data and other systems is often complicated by trying to pull others along in the organization—regardless of where their hearts lie.

        So how is it that we can focus in on what’s relevant and minimize the reporting burden on others?

        At the risk of seeming to oversimplify the process, I’ll attempt to breakdown some of the concepts mentioned here as a means for peering through the gray. The following five points have been central to my years of guiding organizations through this process. Navigating ESG

        1: Navigating the myriad of standards and frameworks:

        Not only are there the long-time warriors (the Global Reporting Initiative, CDP, and the Sustainability Accounting Standards Board now merged with the International Integrated Reporting Counsel labeled as the Value Reporting Foundation), there are also larger north star initiatives, like the United Nation’s Global Compact or Sustainable Development Goals, and even those that are industry specific, like the Global Real Estate Sustainability Benchmark. There are also the investor-driven ratings and rankings, supply chain initiatives, and mandates disclosure requirements that organizations must contend with. Not everyone is blessed with sustainability departments powered by specialists of all types. In fact, most are managed by 1-3 individuals who often juggle multiple roles until they can prove the importance of an integrated strategy and leverage additional support. In the end, standards alignment comes down to one person dropping all disclosure requirements into an excel spreadsheet to make sense of all that is needed. There is no harm in this. It is a recommended first step in trying to better understand the nuances between all that is asked and whether it is possible to pull data to meet various requirements. The goal eventually, of course, is to automate reporting against all applicable requirements. Usually companies start by developing a comprehensive list of all that they can disclose, either initially or in the future.  The key is not to exclude areas that the company is unable to immediately disclose on, but to press the “pause” button and keep those items in the horizon as areas that should be revisited in the future. Instead, stating where one is in the journey to retrieve information and manage inherent risks, while providing data for what is possible, is recommended. In that, clear “omissions” or “exclusions to the boundary” should be noted.

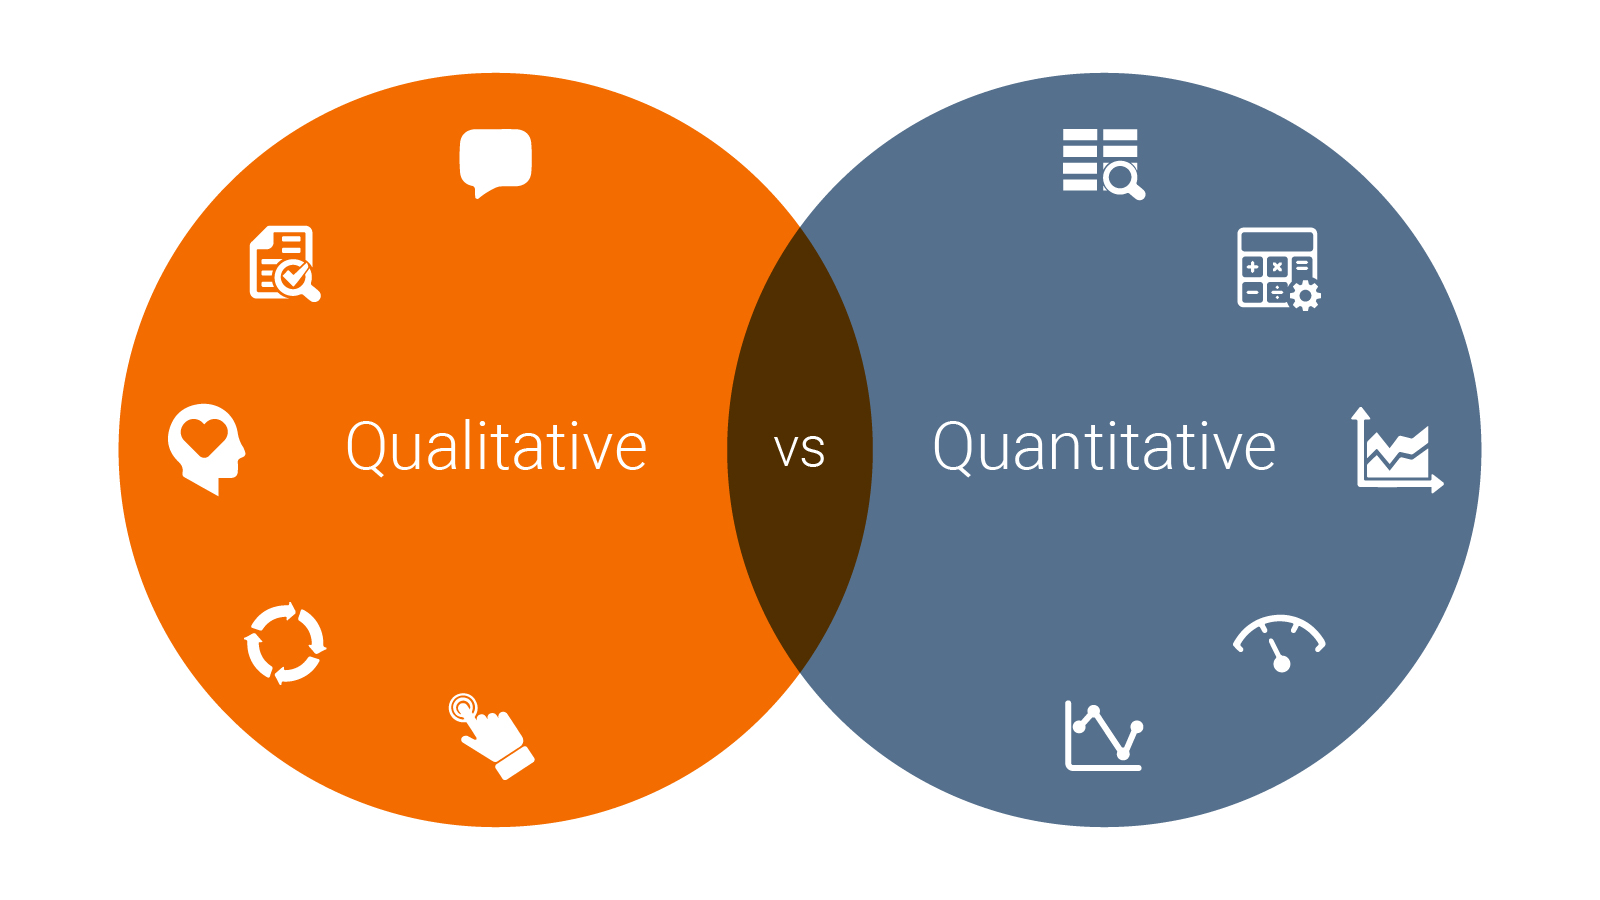
        ESG | Qualitative vs Quantitative Data

        2: Determining the qualitative vs. quantitative:

        Be it labor standards, human rights, training and education, resource consumption or greenhouse gases, there are both qualitative and quantitative features to grasp and disclose an organizations’ impacts. Granularity is based on what the organization is trying to achieve by pursuing efforts in a certain area. Will the level of detail provide a sharper view of potential risks? Will the data enable decision-making? Will it demonstrate the level of transparency the organization is willing to provide to match disclosure among its peer group? Will it result in greater recognition or even, leadership status? By asking these questions, organizations can determine their priorities and narrow in on data tracking mechanisms to pull, house, and analyze detail. Keep in mind, however, taking inventory always presents surprises. Try not to go down a rabbit hole searching for data that doesn’t exist or isn’t relevant considering the larger footprint. Report on what is available and explain what is being accounted for, what is missing, and why. Navigating ESG

        3: Pull others along:

        Frameworks, data, and the endless requests for disclosure are enough to make anyone question their sanity—let alone the ongoing education that is needed to bring others along the path towards greater sustainability. Up until about five years ago, the role of the sustainability champion was often a lone wolf in the organization who felt committed to the charge. Boards were not involved, and it was because few companies saw sustainability as a strategic imperative. Today, it’s no longer effective to go at this alone. Markets have begun to regulate this space: the fear of shareholder resolutions, and the inability to access capital due to a lack of demonstrated ESG commitments, risk management, and performance disclosure has catapulted the need to activate players across functions. Regardless of standard, framework, or reporting platform, governance is critical to ensuring that sustainability sticks. It’s not enough to simply describe the organizational and leadership structure, but to describe how and where sustainability or ESG risk management sits within and what the role of the Board is. The sustainability coordinator, or Chief Sustainability Officer’s structure the group to facilitate action. Constant education and hand holding is necessary to inform the working group on the rapidly changing landscape and what is needed to maintain a license to operate from the stakeholder perspective. ESG Report

        4: Minimize the reporting burden:

        If it’s not clear by this point, all that matters when it comes to reporting is 1) performance data, 2) an explanation of management approach, and 3) a description of your processes undertaken to identify material matters and manage risks. Stories and imagery provide color but not an overview of what the organization is doing to manage impacts. Begin by structuring your website to highlight data. Embedd data from  GRI, the SDGs, and/or SASB indexes as companies such as Ball Corporation, BlackRock, and Coca-Cola. All have focused more efforts on tangible reduction and reuse, rather than creating beautiful communication pieces. This allows them to focus time and resources on doing the work that matters. ESG Data Collection

        5: Data collection:

        As the saying goes, “what doesn’t get measured doesn’t get managed.” Pulling data from the ESG pillars and across functions often means that the data collection process tends to take shape like a patch work quilt. Utilizing an integrated, configurable system that can extract and consolidate data into a single source of truth allows companies to focus on results, rather than begging for data from sources internal and external to their organization. Where possible, automate the data collection process, and provide decision-making analytics that can be transferred to various disclosure platforms to streamline the process and further minimize the reporting burden.


        Hopefully, these points will help reassure you that you’re on the right path. The reality is, there is no easy way. Many of the front movers know this all too well. Their approach has taken years to solidify. In addition to the 5 points listed above, try to remember that it is important to just get started. Improvements can be made over time and lessons aren’t typically learned through perfection.


        [sc_image width=”150″ height=”150″ src=”23979″ style=”11″ position=”centered” disable_lightbox=”1″ alt=”Nancy Mancilla, ISOS Group”]

        About the Author—Nancy Mancilla, ISOS Group

        Ms. Mancilla is the CEO and Co-Founder of ISOS Group, a full services sustainability consultancy firm also recognized for its leadership as a GRI and CDP Certified Training Partner in the U.S. Since establishing the company, Nancy has orchestrated 300+ Certified Trainings, co-taught MBA programs, regularly serves as a conference guest speaker and thought leader on the non-financial reporting process. In addition to educational services, ISOS Group provides organizations of all types with sustainability assessments, reporting guidance and external assurance.


        [sc_button link=”https://www.locustec.com/applications/esg-reporting/” text=”More on ESG” link_target=”_self” centered=”1″]