Long Live the GIS Mashup: Environmental Data Viewed in a Whole New Way
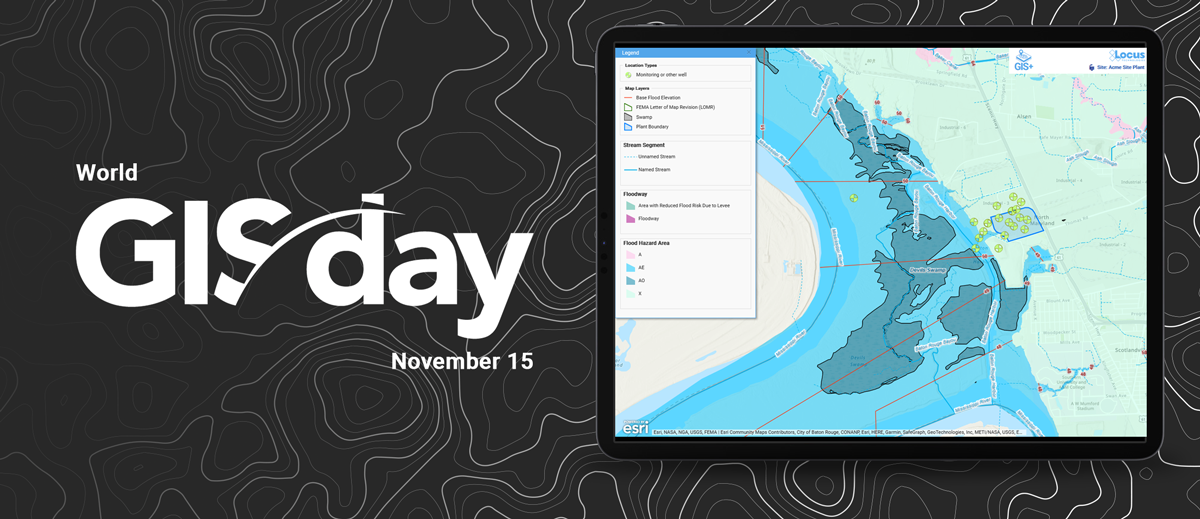
Nov 15, 2023, is GIS Day, a day started in 1999 to highlight the diverse uses of geographical information systems (GIS). Earlier Locus blog posts have looked forward to discuss how GIS can work with augmented reality and artificial intelligence. This post looks backwards to talk about mashups, a GIS concept that is over twenty years old but still relevant to environmental data management.
The term ‘mashup’ became popular in the early 2000s to describe the combination of multiple songs to make a new song. Similarly, a GIS mashup combines digital map layers into a new map – something that can’t be done with paper maps that have fixed data. Often, the mashed-up map layers are public, allowing digital cartographers to repurpose existing content from other users into their own custom maps.
The term ‘mashup’ has lately fallen out of use, perhaps because mashups are common now; sometimes it seems all pop culture is one big mashup. At any rate, the Locus GIS+ module, powered by the ESRI mapping engine, lets you make mashups in the Locus EIM and Locus Platform applications by combining data from three sources.
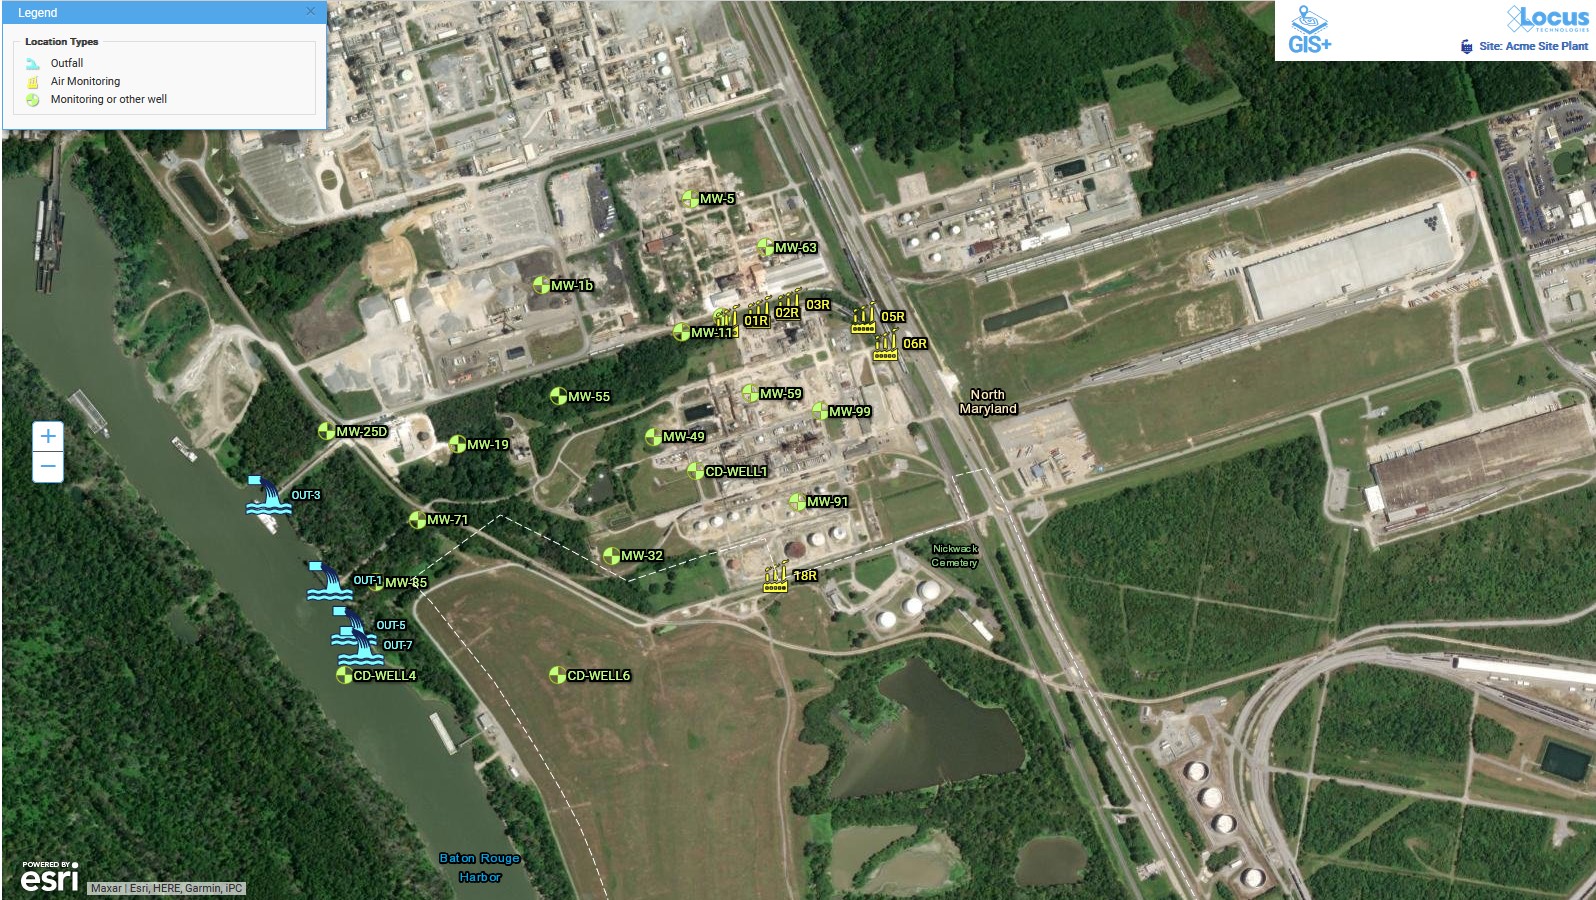
First, you can show georeferenced objects stored in EIM and Locus Platform, whether the objects are sample locations, spills, assets, or other features. Here is a map of wells and sample locations in EIM mashed up with a satellite image.
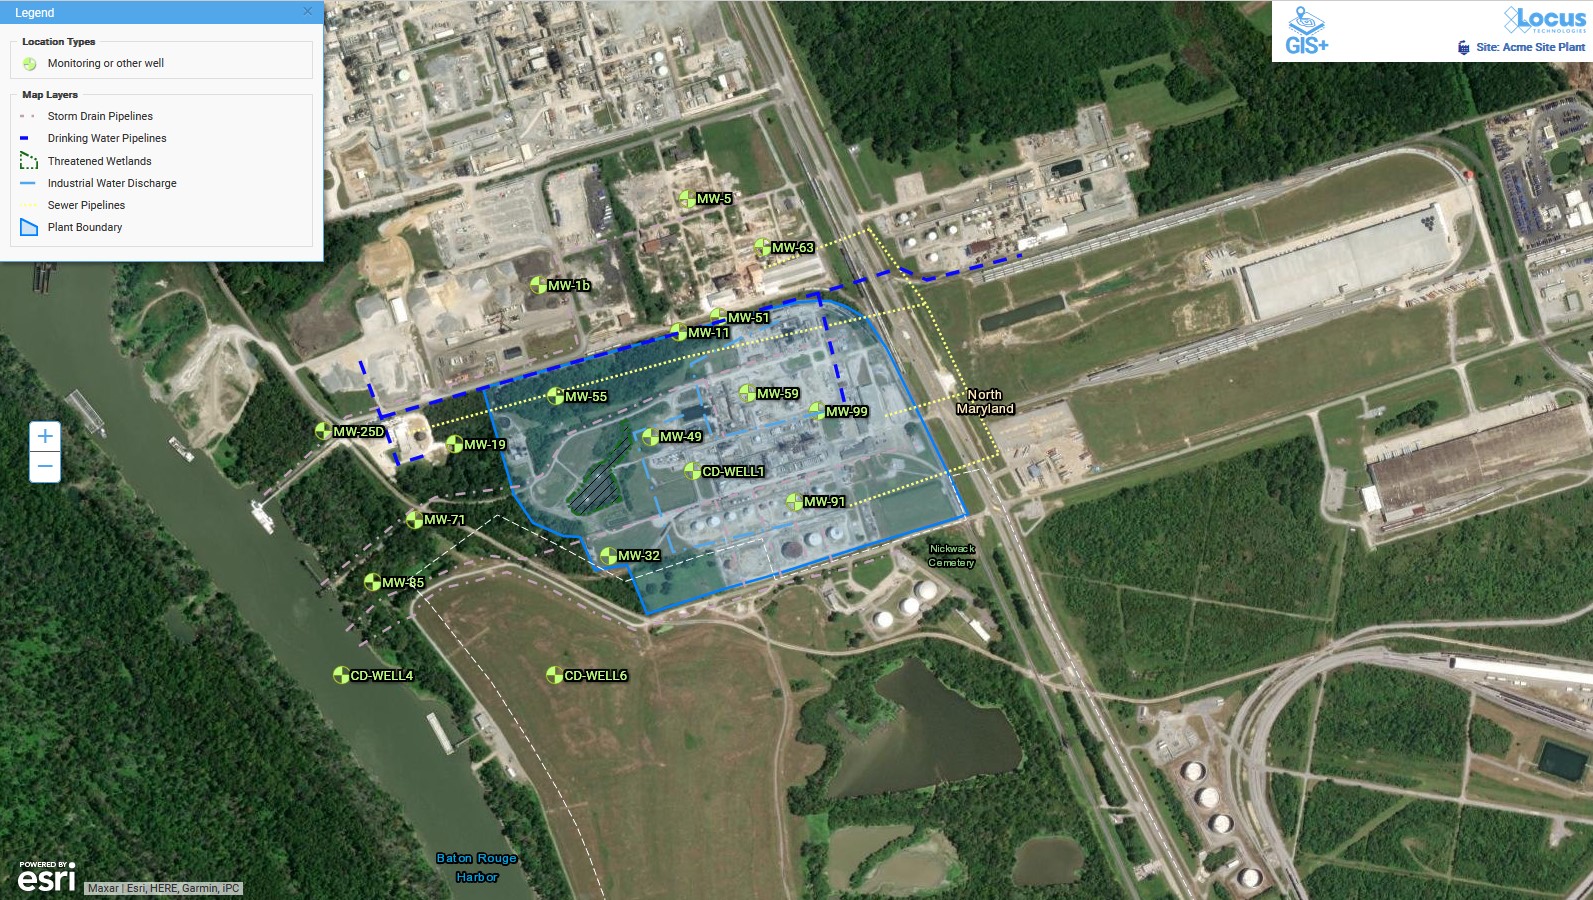
Second, you can add any map layers you have stored in your ESRI ArcGIS cloud – these could be plant boundaries, areas of concern, building footprints, site photos – anything you have in your ESRI web maps. The next map shows wells in EIM with map layers showing a plant boundary, wetlands, and several pipelines.
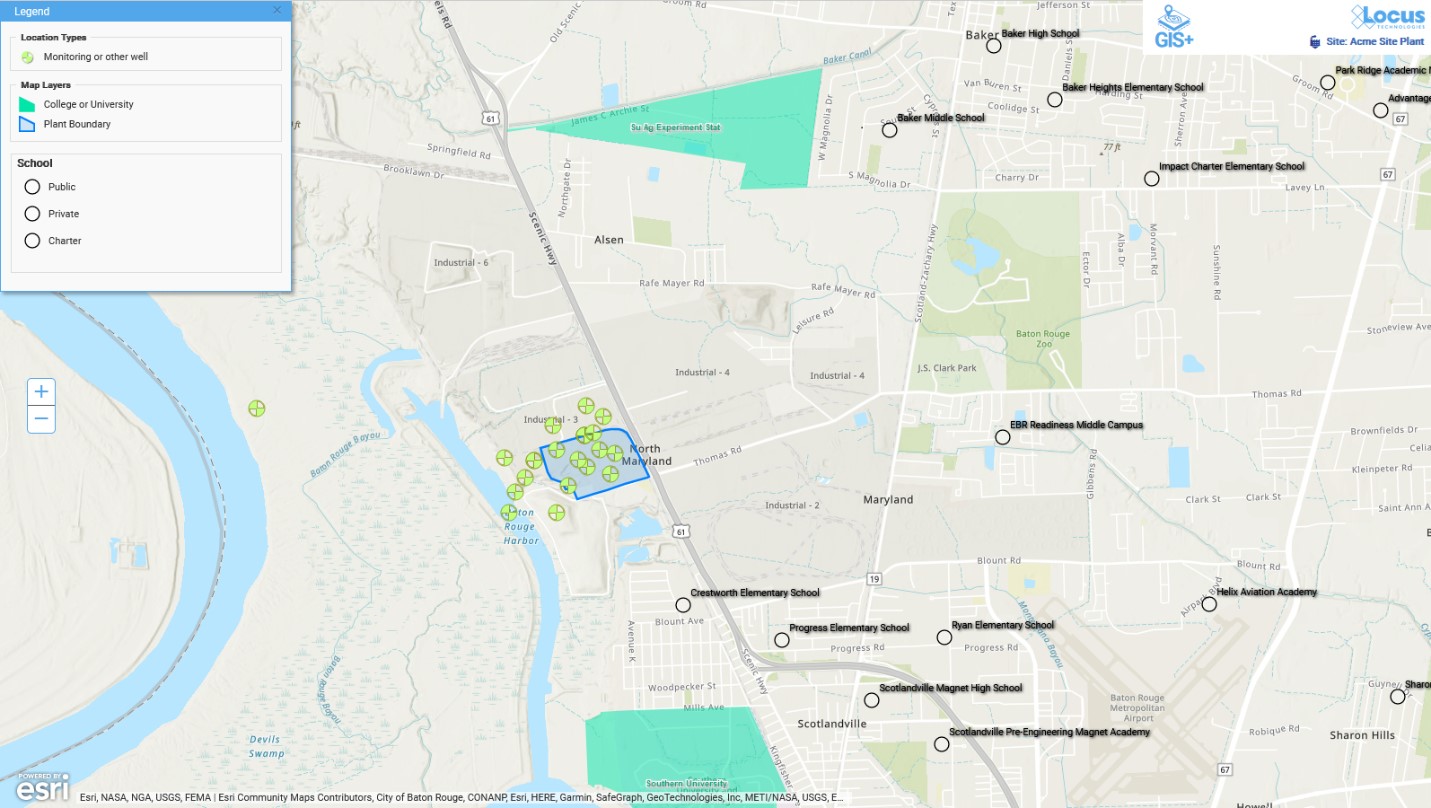
Third, you can supplement your maps with public data stored in the ESRI cloud – layers made public by a host of national, state, and local organizations and agencies, as well as private companies such as ESRI. This map mashes up EIM sample locations with a publicly available map layer showing nearby schools.
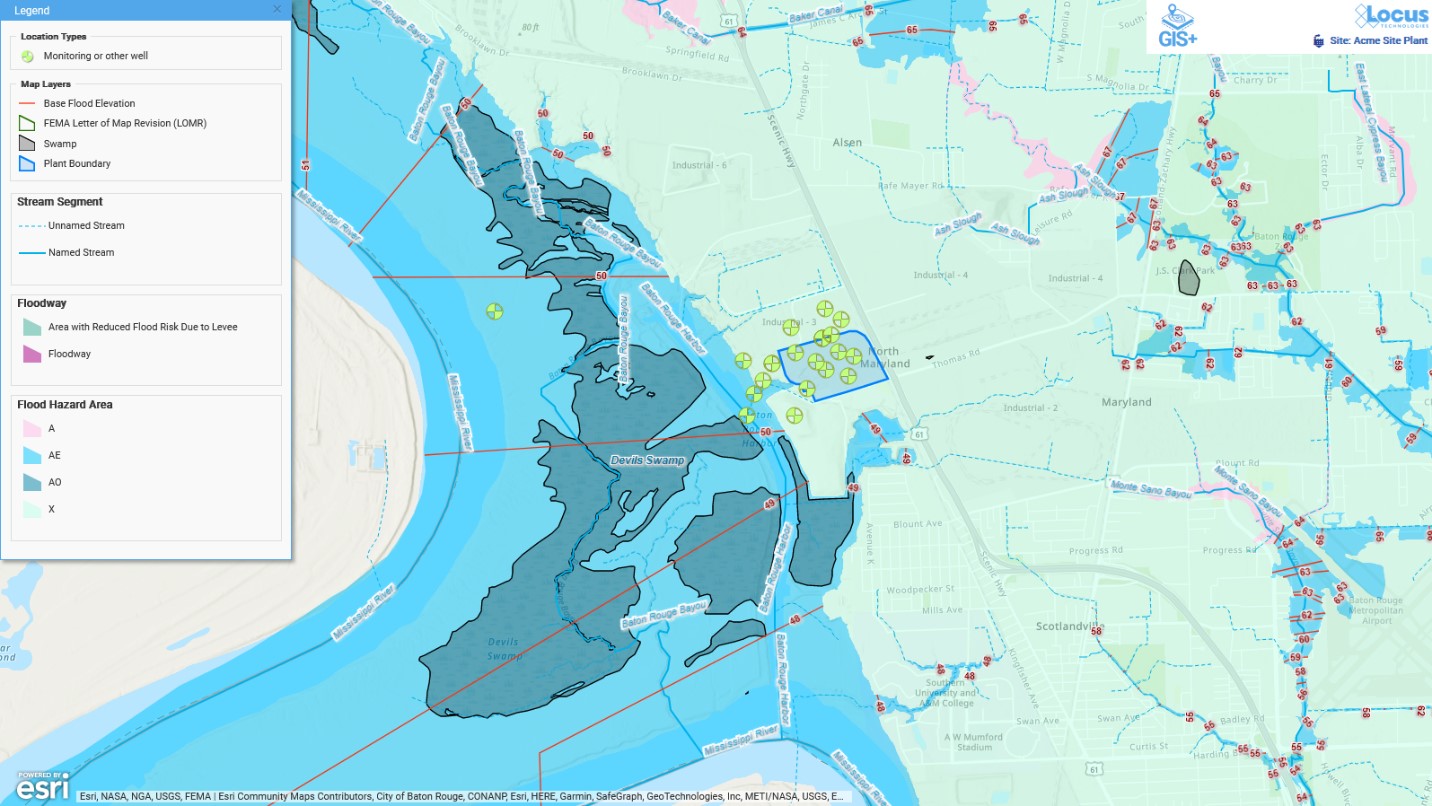
By combining data from these various sources, you can bring together many layers to perform your own analysis. For example, you can combine your asset layers in the Locus Platform with flood plain maps to evaluate property risk. Here is a map showing Platform locations with flood plans and streams.
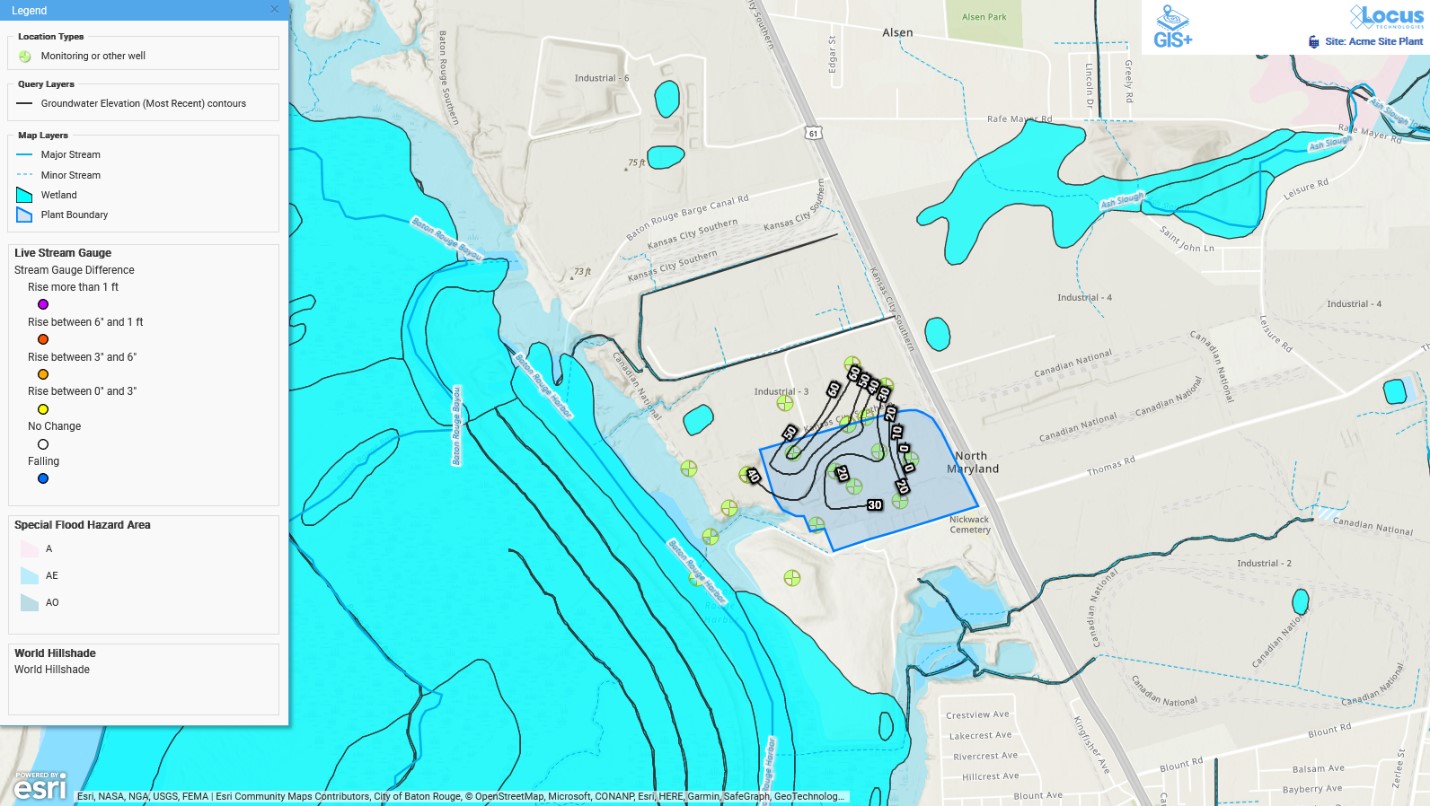
Or you can combine sampling results from EIM with groundwater contours generated in GIS+ and overlay public layers of aquifers, watersheds, and topography, to determine impacts on drinking water supplies. The next map shows groundwater contours from EIM mashed up with flood areas, streams, and wetlands.
The word ‘mashup’ may have gone out of style, but combining multiple data sources into your own map is a feature of Locus GIS+ that is here to stay. If you’re not using GIS+ with your Locus apps, contact Locus to try it; and if you already have GIS+, be sure to take advantage of this powerful method to make your own custom maps.