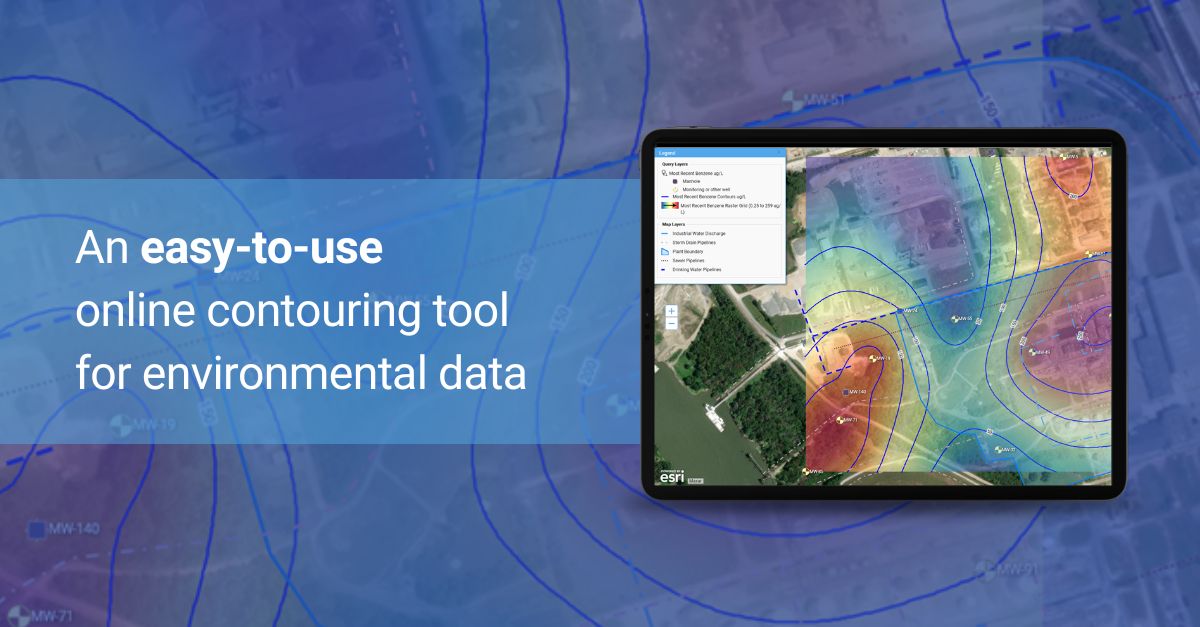
Environmental Data Contouring
Both EIM and Locus Platform, applications from Locus Technologies, let you manage your environmental data gathered from surface and subsurface sampling locations. But did you know you can create contours with analytical and groundwater data from your locations?
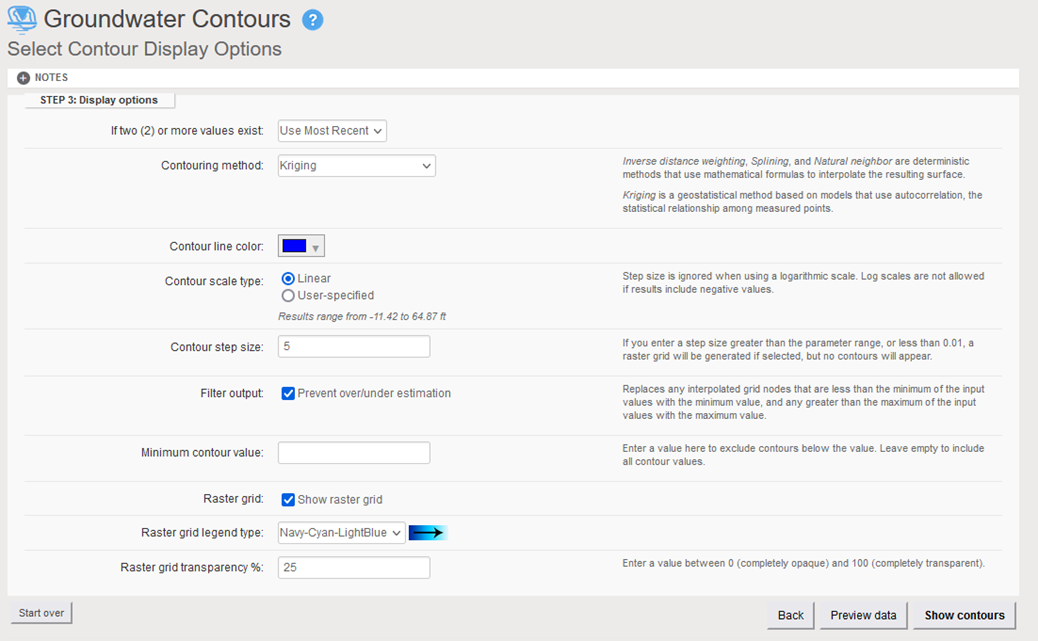
To create contours, you first select the data of interest. You can filter by location, parameter, date range, aquifer, and several other sampling attributes. Once your data is selected, you select your contour options, including:
- Whether to use the most recent, average, or maximum value at each location
- What method to use (kriging, inverse distance weighting, splining, natural neighbor)
- What contour step size to use (the value difference between contour lines)
- What contouring parameters to use (which depend on the method chosen)
- What outputs to generate (only contour lines, or lines plus a raster heatmap)
Some of these options are shown below in the form for groundwater contours.
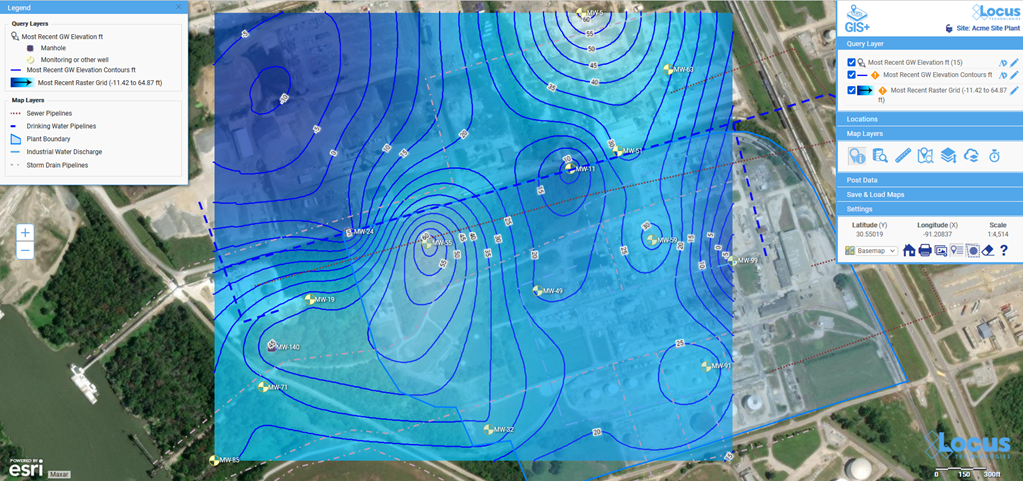
Once the options are selected, Locus software uses the location data to interpolate values and create a set of contours of constant values. These results are sent to the Locus GIS+ for display.
Here is an example of groundwater contouring showing the contour lines and heatmap on top of other layers from the study site.
And here’s an example of analytical contouring.
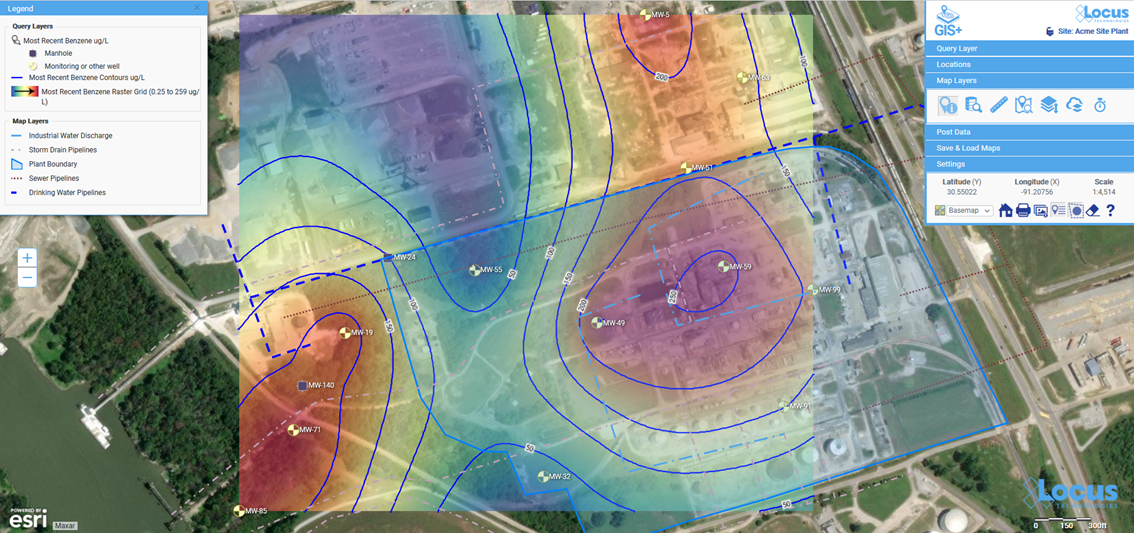
These contours show the strength of Locus’s applications for analyzing and mapping your environmental data. Contact Locus Technologies for more information!