
01 // Blog
How to integrate data from oil and gas fields, sampled sites, and the USGS Produced Waters Geochemical Database with water data management software
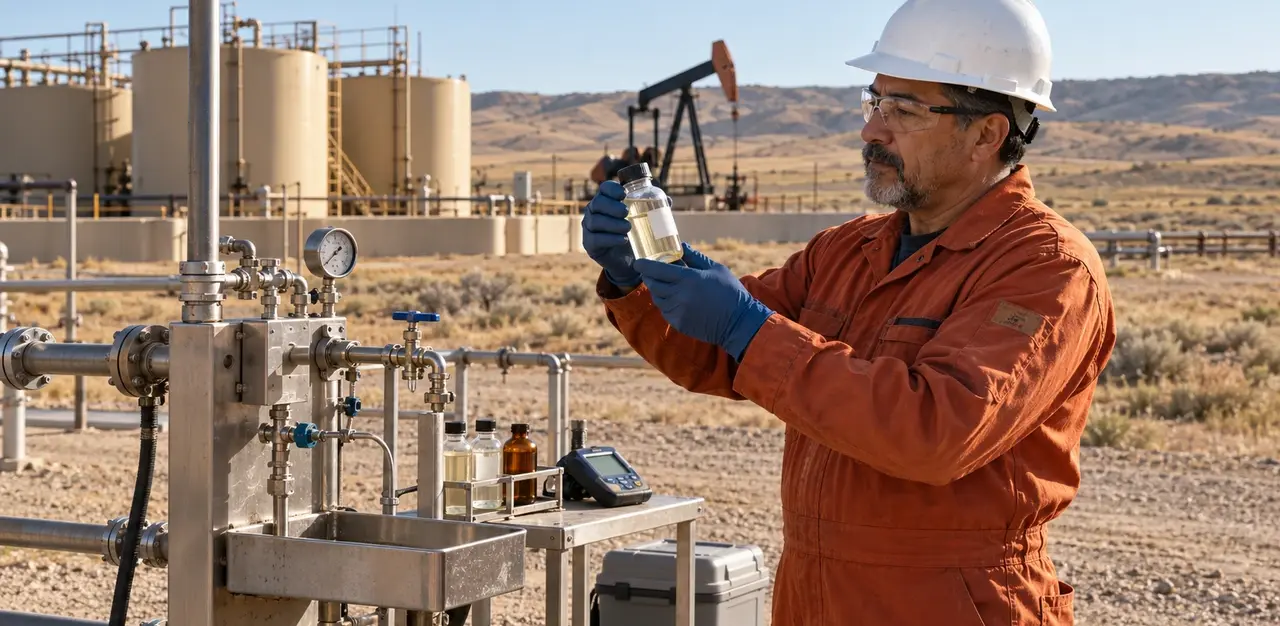
Produced water, a byproduct of oil and gas production, is often seen as both a challenge and an opportunity: a challenge, because the water is not suitable for direct release into the environment, but also an opportunity, because if properly treated, the water could be used for other purposes. Locus recognizes the importance of managing produced water responsibly. Our collection of Locus Water apps includes water data management software to streamline the monitoring, analysis, distribution, and reporting of produced water.
Locus has recently integrated the US Geological Survey’s (USGS) National Produced Waters Geochemical Database into our products. This database contains chemistry sampling results from produced water and other deep formations. The data goes back to 1905 and covers 155 parameters, including metals, volatiles, gases, salts, radionuclides, and field readings, from 113,135 locations across the US and southern Canada.
As of the spring of 2025, Locus customers can obtain access to this database for use in queries and maps alongside their own data in Locus cloud. Because the USGS database has 17,535,925 unique results, Locus provides a search interface. Users can pre-filter the data by US EPA region, geological basin, and state or province. Users can then search by well type, geological formation, or reservoir type.
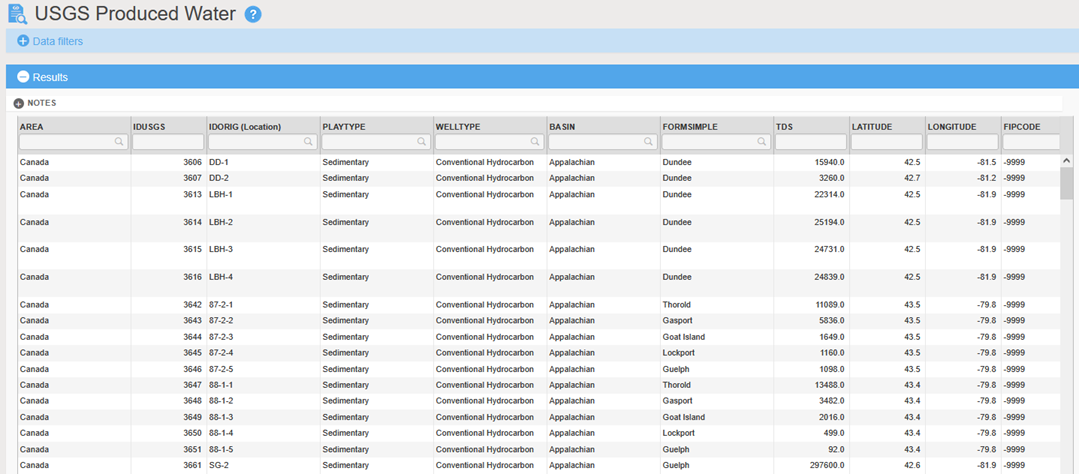
Here is an example of results of a query for the USGS Produced Water records in the Appalachian geologic basin. Results are listed in a Locus grid which can be filtered, sorted, and exported to other applications.
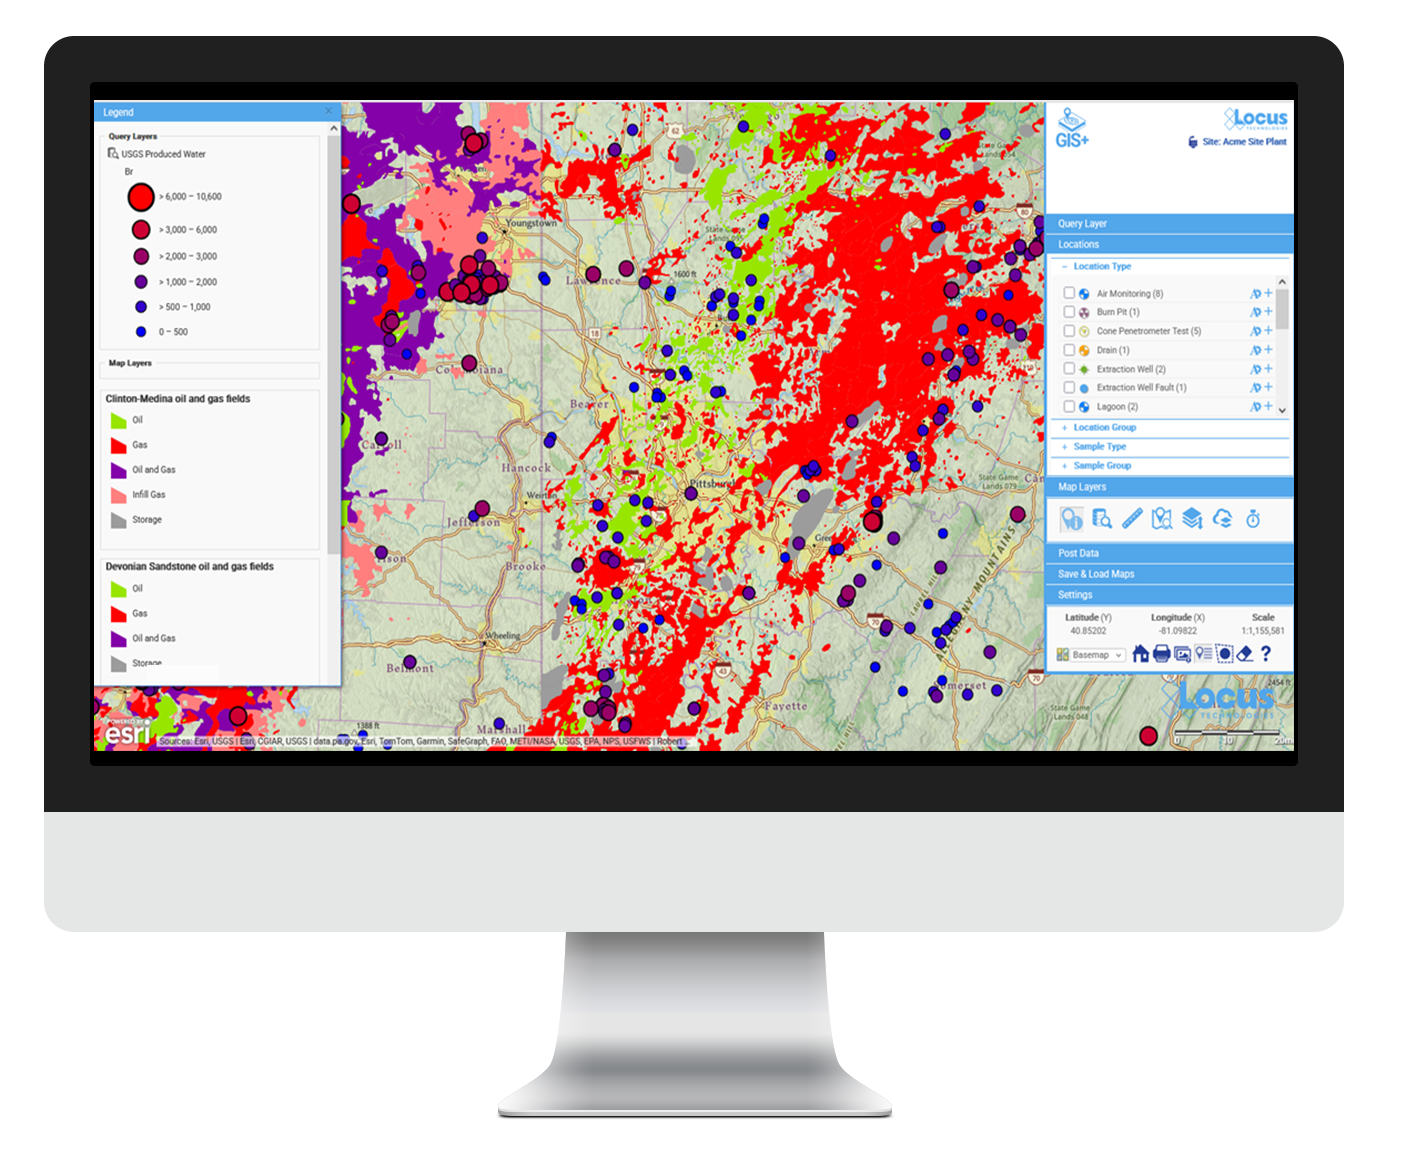
The grid results can also be sent to Locus GIS+. Below is a map of the Appalachian geological basin results near Pittsburgh, with locations displayed as circles that are colored and sized to indicate the level of bromine in the water. Similar maps can be generated for all other parameters in the database. Other map layers such as local oil and gas fields can be overlaid on the map, as can Locus customer layers such as sampling locations, assets, or areas of concern.
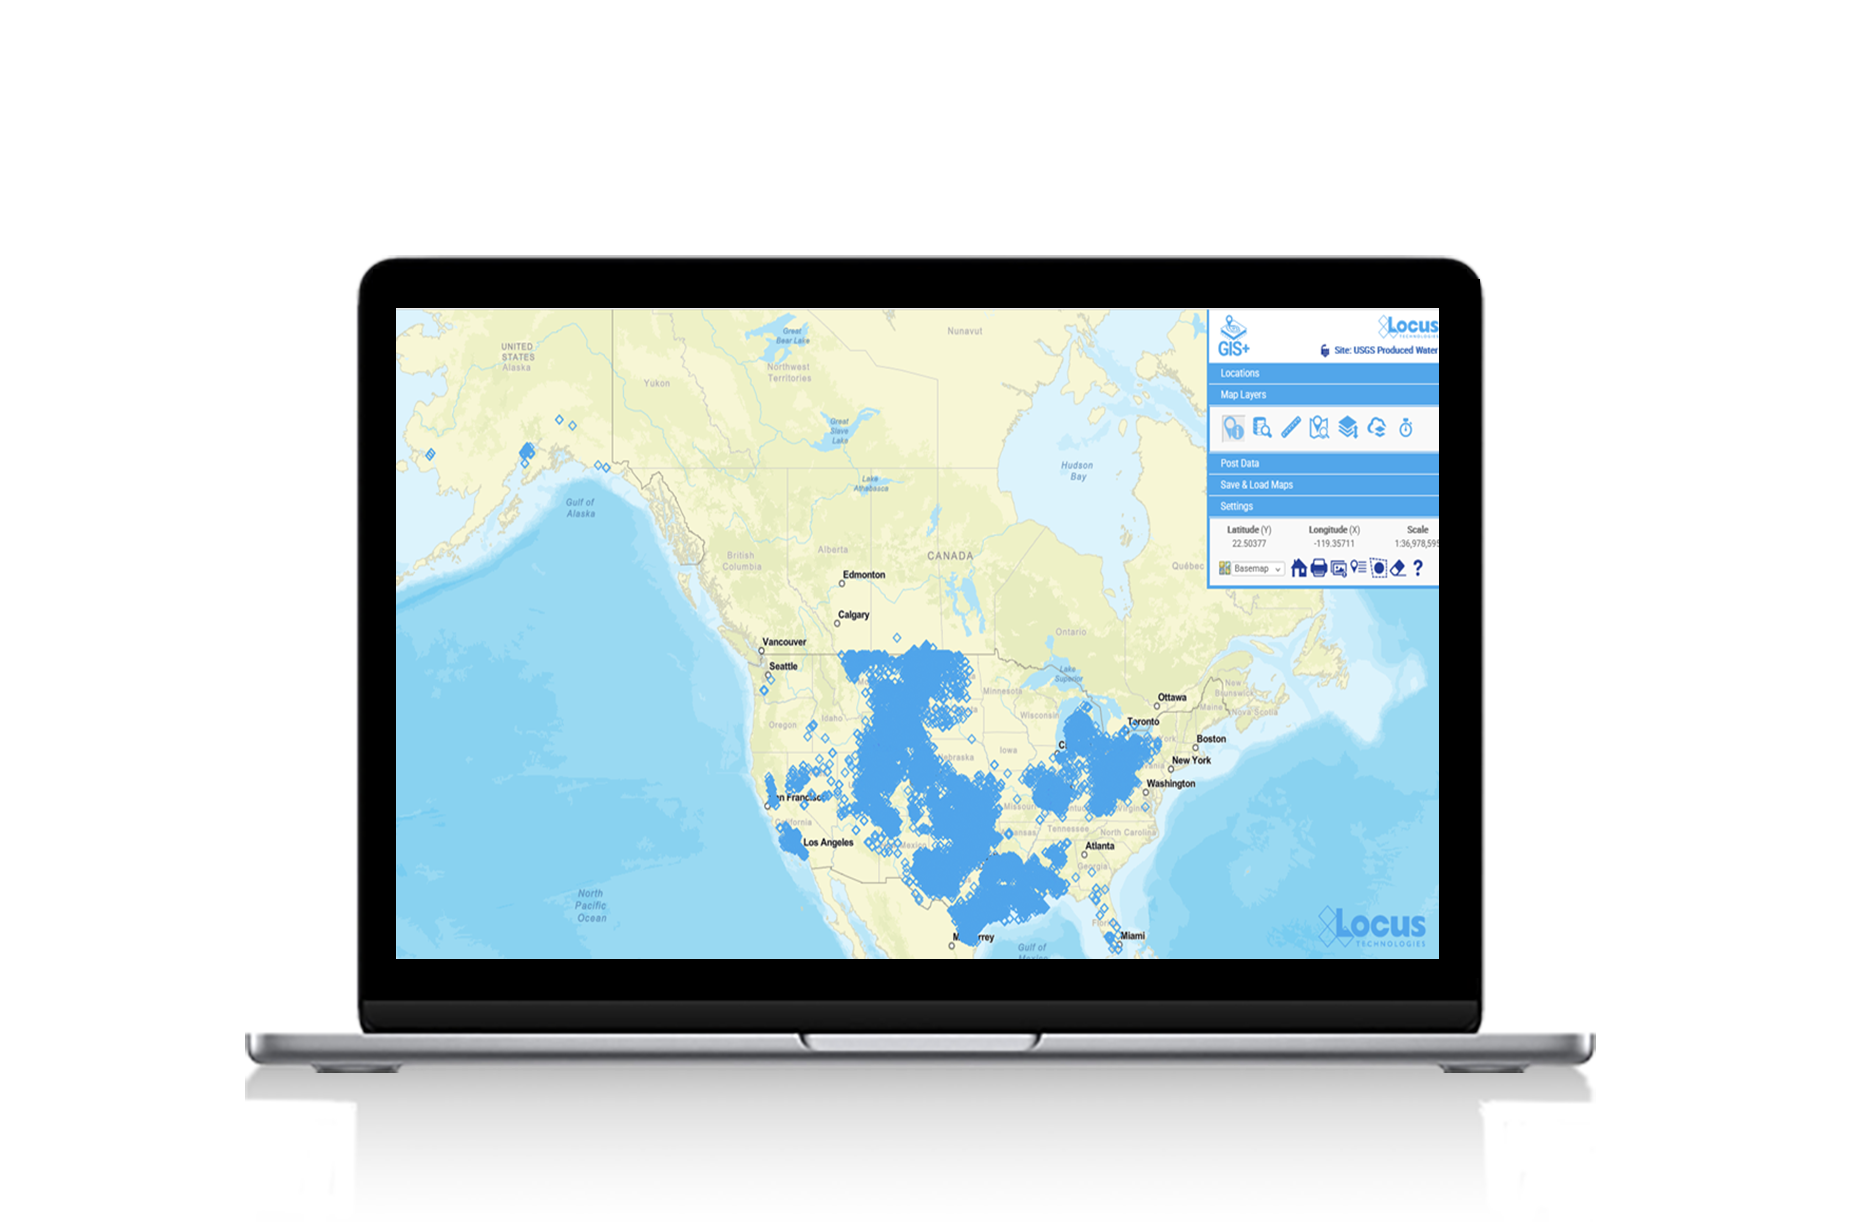
The USGS Produced Water database is also available as a series of map layers in Locus GIS+ for use with spatial queries. Users can search for produced water samples near their own sampling locations in Locus EIM or Locus Platform water data management software. Shown here is a Locus GIS+ map of all the sampling locations in the USGS Produced Water database.
Locus continues to improve our collection of Locus Water apps, including Produced Water. For more information, please contact Locus Technologies.


Dr. Todd Pierce has worked with geographical information systems (GIS) since 1993, bringing GIS innovations to both public and private businesses in the fields of environmental data management, natural resource management, climate resilience, and disaster recovery.