




01 // ANALYTICS, REPORTING & DASHBOARDS

EHS analytics, reporting, and dashboards for regulated industries

Where EHS data becomes defensible intelligence.

Locus is the only EHS software company that supports the complete spectrum of environmental, health, safety, and sustainability data alongside scientist-grade formulas, analysis, mapping, compliance, and reporting tools within a single configurable platform. Every chart, dashboard, and regulatory report draws from the same validated system of record — so the data your team analyzes and the data your organization submits to regulators is always identical, with no reconciliation required.

EHS compliance manager working on computer

Insights, reports, and dashboards from one data source

02 // Intro

  • One validated source for every output

    Analysis begins with the same records, validation history, and calculations used in formal submissions. This provides a consistent line-of-sight from source data to final output.

  • Regulatory-grade and BI-grade in the same platform

    Locus combines structured regulatory reporting and traceable calculations with flexible dashboards, maps, and ad hoc queries. The same governed data can serve regulators, analysts, and business leaders.

  • Role-based access from executive to regulator

    Tailor dashboards and reports by role, facility, division, or program while preserving a common data foundation. Each audience sees the level of detail appropriate to its responsibilities and permissions.

03 // Benefits

Put trusted data behind every disclosure and decision.

  • Dashboards, reports, and analytics from one validated dataset
  • Configurable KPI dashboards for any program or stakeholder
  • Man working on laptop as demonstration of AI for EHS and ESG
  • Regulatory reports for dozens of EPA and state frameworks
  • Enter data once, leverage it for any report, any framework
  • Role-based access ensures every user sees the right data
  • Drill from executive summary to source record in one click
  • Auditable, traceable reports built for regulatory scrutiny
  • Live API connections to Esri, Tableau and Power BI

One platform. Every deliverable.

04 // Key Capabilities

Regulatory Compliance Reporting

Locus is a single platform for easy and accurate regulatory reporting across a wide range of mandatory and voluntary frameworks. Organizations enter their data once and leverage it for any applicable report. Pre-built, formatted report templates conform to agency requirements, and new report formats can be configured to meet unique program needs without professional services. Reports can be exported in the formats regulators require: XML, XLSX, CSV, and PDF.

Pre-built frameworks include EPA NetDMR, DMR, CCR, Regional EPA, RCRA Biennial, SARA 313/TRI, e-Manifest, e-GGRT, Title V, Fenceline, LCFS, ESG, CSR, CDP, TCR, GRI, DJSI, OSHA 300, 300A, 301, FRA, and CSRD.

Permit Management

ESG and Sustainability Reporting

Locus ESG reporting software reconciles environmental data with the financial and operational data required for investor-grade disclosures. Greenhouse gas calculations, low carbon fuel data, and embodied carbon metrics are all managed within the same platform that handles permit compliance and water quality reporting. GHG methodology, conversion factors, and analytic models are fully auditable — users can drill into any calculation to review or adjust the approach before submitting a disclosure. Locus report templates adapt to GRI, SASB, CSRD, CDP, and other frameworks by jurisdiction and stakeholder, without separate data entry.

ESG Reporting

Dynamic Dashboards with Integrated Mapping

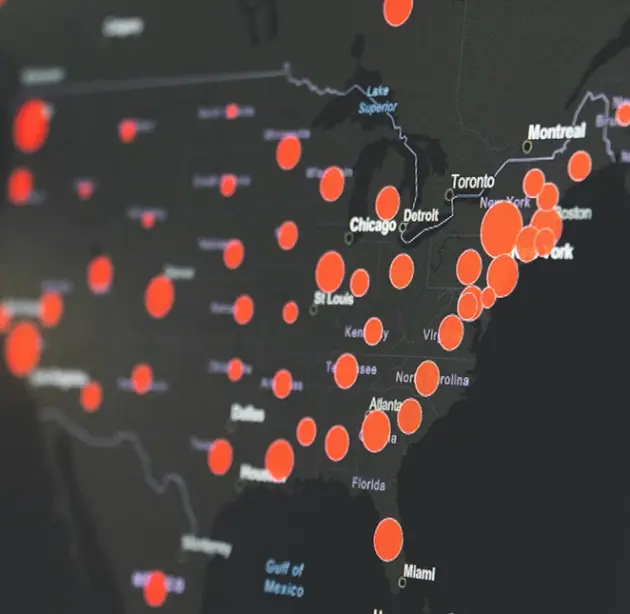
Locus dashboards combine charts and maps in a single view, and the two panels respond to each other interactively when shared by Locus OneView and Power BI. When a user selects a state or region on the embedded map, the associated charts update to reflect the data for that geography. When a specific data series is selected on a chart, the corresponding location highlights on the map. This interactivity makes it significantly easier to find patterns that would be invisible in either a chart or a map viewed independently, supporting faster compliance decisions and more credible executive reporting.

GIS & Spatial Intelligence

Ad Hoc Querying and Expert SQL

For analysts who need access beyond pre-built report templates, Locus includes both simple search tools and the Expert Query Builder — a drag-and-drop interface for constructing custom SQL queries against any reporting data table in the platform. Expert Query outputs are API-compatible, returning results in JSON format for use in any external application. Queries can be scheduled to run automatically on defined intervals, with outputs delivered to an FTP folder or email attachment, eliminating manual data pulls.

Data Connectivity & Integrations
AI and computer engineering reviewing environmental data and AI models

Tableau and Power BI Integration

Organizations that have invested in enterprise business intelligence (BI) platforms can continue using those tools while feeding them Locus-validated data. Live API connections link Locus Platform to Salesforce Tableau and Microsoft Power BI, and those connections remain active. No manual data exports, no scheduled syncs, and no risk that a BI visualization is pulling yesterday's compliance record.

Data Connectivity & Integrations

Auditable Report Provenance

Every Locus report output is traceable to its origin. The platform's data validation tools and visual calculation engine let users instantly review the provenance of any data point or calculation — following any figure in any report back through its calculation history, its validation record, and the user event that created it. During a regulatory inspection or internal audit, this traceability is available within the reporting interface itself, not reconstructed from emails or spreadsheets.

Data Quality & Validation

Role-Based Report Access

Locus includes powerful filters for reporting across any attribute, facility, division, or the full enterprise. Each user's reporting and dashboard view is governed by their role-based access configuration; field users see site-level data, regional managers see aggregated multi-facility summaries, executives see enterprise KPIs, and regulators or auditors see only the specific deliverable relevant to their permit or framework. Configuring these views requires no code and no IT involvement.

Security & Data Governance

05 // Feature Highlights

Robust tools and flexible configurations to accomplish exactly what you need

  1. Configurable KPI dashboards without code, by any power user
  2. Pre-built frameworks: NetDMR, CSRD, GRI, CDP, OSHA 300, and more
  3. ESG reporting aligned to investor-grade and auditor-ready standards
  4. Dynamic dashboards with synchronized chart and map interactivity
  5. Ad hoc querying and custom SQL via Locus Expert Query Builder
  6. Live API connections to Tableau and Microsoft Power BI
  7. Role-based access from field user to executive to regulator
  8. Full provenance tracing from any report figure to its source record
  9. Exports in XML, XLSX, CSV, and PDF formats

06 // Environmental Data Manager, Westinghouse Electric Company

"Advanced data analytics and visualization — including customizable dashboards, trend analysis, and GIS integration

— enabled Westinghouse to visualize data in real time and quickly identify potential compliance issues."

07 // Software Demonstration

See Locus software in action

See every output your compliance program produces — from one data source. Schedule a live demo and explore Locus dashboards, reports, and analytics across your program areas.
Schedule a Demo

Frequently Asked Questions

08 // FAQ

Locus supports reporting to EPA NetDMR, DMR, CCR, Regional EPA, RCRA Biennial, SARA 313/TRI, e-Manifest, e-GGRT, Title V, Fenceline, LCFS, ESG, CSR, CDP, TCR, GRI, DJSI, OSHA 300, 300A, 301, FRA, and CSRD. Pre-built formatted templates cover each framework, and additional formats can be configured for any additional agency or voluntary requirement without professional services involvement.

Yes. Locus dashboards are fully configurable by power users without writing code. KPI tiles, chart types, time periods, facility filters, and layout are all adjustable per view. Role-based access controls ensure each user's dashboard reflects their program responsibilities and data clearance level — from a facility-level field view to an enterprise executive summary — all drawing from the same validated dataset.

Yes. Because all Locus analytics, dashboards, and regulatory reports draw from the same validated system of record, the data your team analyzes internally and the data submitted to regulators is always the same. There is no reconciliation step, no parallel dataset to maintain, and no risk of a discrepancy between what a dashboard shows and what a regulatory submission contains.

Locus ESG reporting software manages GHG emissions, low carbon fuel data, water quality, waste, renewable energy, refrigerants, and other environmental sustainability metrics — reconciling them with financial and operational data for complete disclosures. GHG calculations are fully auditable, with drilldown access to methodology, conversion factors, and analytic models. Report templates adapt to GRI, SASB, CSRD, and CDP frameworks without separate data entry for each.

Every report output in Locus Platform can be traced back to its source. The platform's data validation tools and visual calculation engine let users review the full provenance of any data point or calculation at any time — through the reporting interface itself. During a regulatory inspection, teams can demonstrate exactly where every figure came from, which validation rule it passed, and who entered the underlying data, without reconstructing records from external sources.