
01 // GIS & Spatial Intelligence

Bring your data to life with GIS

See what your data reveals when it has an interactive map to stand on.

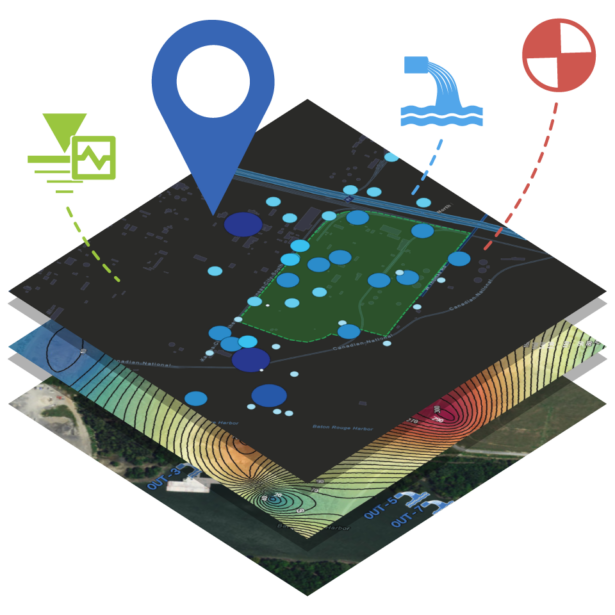
Environmental sampling, field measurements, site investigations, subsurface data, analytical results, compliance records, and assets all gain meaning when connected to geography. Contamination plumes spread across geology. Permit boundaries define where monitoring obligations begin and end. Incidents happen at specific coordinates, and their significance depends on what surrounds them. Locus Platform includes native GIS mapping and advanced spatial analysis through Locus GIS+, integrated with Esri ArcGIS technology. Your data connects directly to geography without leaving the platform.

02 // Why Locus GIS

Spatial analysis built into the compliance platform

GIS offers methods to visualize layers of environmental data in the context of the land, communities, watersheds, and landmarks that surround a site. For executives reviewing portfolio-level performance, field managers tracking incidents across facilities, or scientists monitoring contamination plumes, GIS turns rows and columns of data into a spatial narrative that reveals patterns tabular analysis alone cannot surface. Locus delivers this capability natively — without exporting to a separate mapping application, without maintaining a separate spatial database, and without reconciling coordinates between systems.

Connected mapping from record to real-world context

03 // Intro

  • No separate mapping tool required

    Create, analyze, and share maps within the same environment used to manage your environmental data. Teams can maintain one continuous workflow from record review through spatial analysis.

  • Integrates with Esri ArcGIS technology

    Bring customer-owned maps, base maps, and spatial layers from ArcGIS Online or Portal into Locus GIS+. Organizations can extend their existing GIS investments without migrating or converting data.

  • Connects spatial data to compliance records

    View laboratory results, monitoring locations, permit boundaries, incidents, and assets within their real-world surroundings. Teams can evaluate environmental conditions based on proximity, overlap, and change over time.

04 // Benefits of Locus GIS

Understand where conditions exist, why they matter, and how they change

  • Native GIS built into the same platform as your water and EHS&S data
  • Integrates with Esri ArcGIS for professional-grade cartography
  • Layers compliance records, lab results, and assets on real maps
  • Produces polished, presentation-ready maps
  • Temporal analysis shows how contamination or risk changes over time
  • Combine Locus data with public layers like watersheds and flood plains
  • Mobile-accessible — navigate to sampling points in the field
  • No separate GIS software, license, or data export required

What Locus GIS makes possible

05 // Spatial Intelligence

Native GIS and GIS+ Mapping

Locus customers choose between two levels of embedded GIS. The standard option uses a Google Maps base to display sampling locations, assets, incidents, and facility boundaries directly within Locus software. The premium Locus GIS+ includes built-in tools and public-domain maps for professional-grade spatial analysis, with no ArcGIS Online or Portal subscription required. For organizations that do use ArcGIS Online or Portal, their existing maps are available once they sign into their AGOL or Portal account within GIS+, eliminating the need for complex data exports and imports between systems.

Explore Data Connectivity & Integrations


Spatial Query and Analysis

GIS is far more than placing dots on a map. The real power is in spatial relationships — the ability to determine whether a feature lies inside a defined boundary, within a certain distance of a sensitive receptor, or overlapping a protected resource. Locus GIS+ supports spatial query, classification, buffering, and overlay analysis, letting teams answer the questions that matter most in environmental compliance: which monitoring wells with elevated readings fall within a watershed? Does the contamination plume overlap an aquifer used for drinking water? Where do pipeline segments cross protected waterways?

Explore Analytics, Reporting & Dashboards

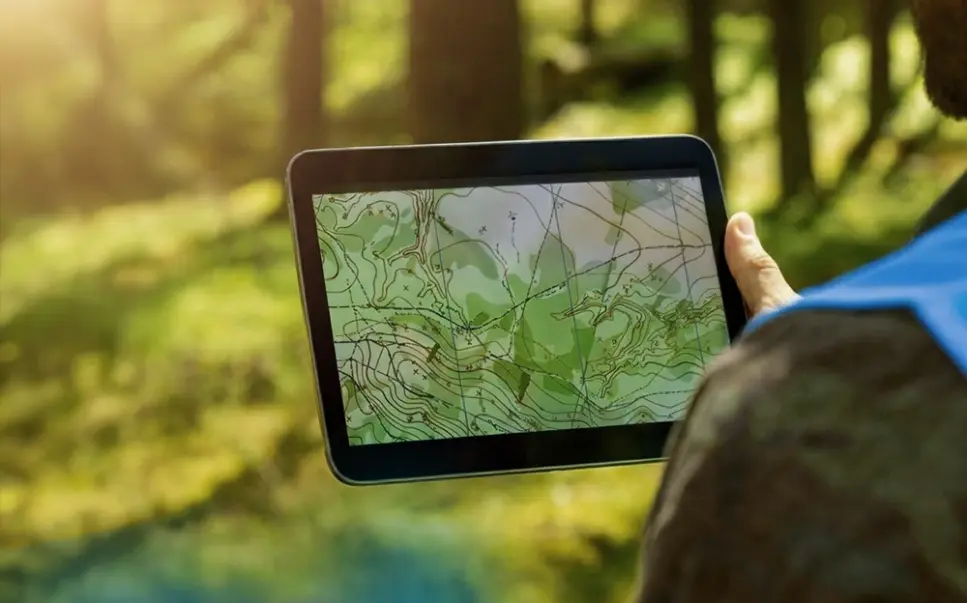
Contour and Topographic Maps

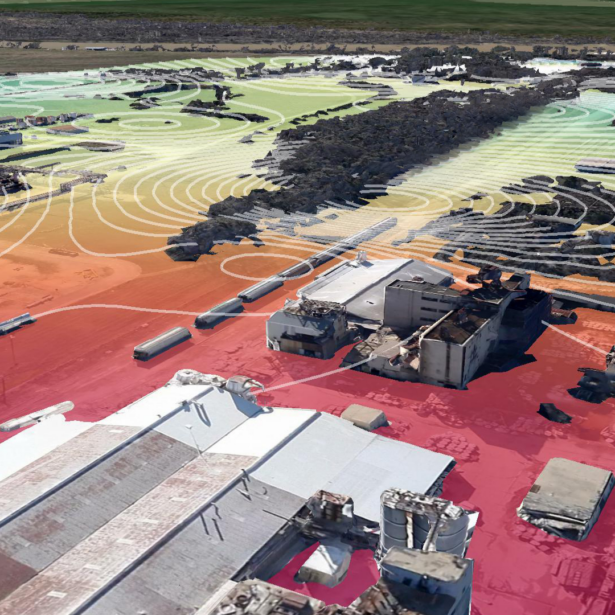
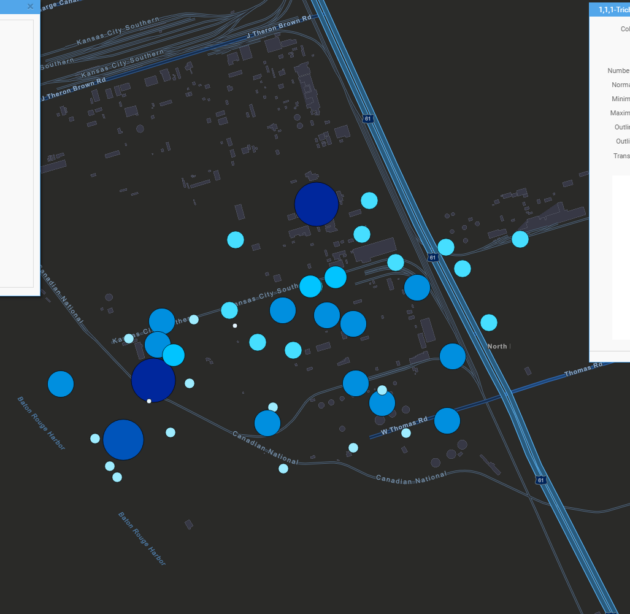
Locus GIS+ generates groundwater contour maps, topographic surfaces, Voronoi diagrams, choropleth maps, point density maps, and heat maps directly from the data stored in Locus software. Groundwater contour outputs — showing constant-elevation lines at defined intervals across a monitoring network — meet the presentation standards expected in remedial investigation reports, regulatory submittals, and public-facing environmental databases. All outputs are generated on demand from the validated analytical data already in the system of record.

Explore Sampling & Laboratory Data Management

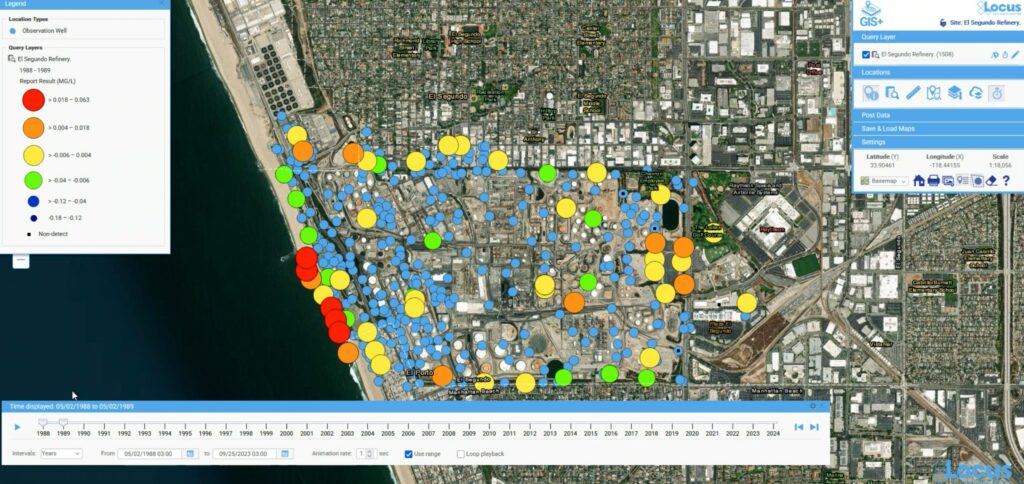
Temporal Analysis and Time Sliders

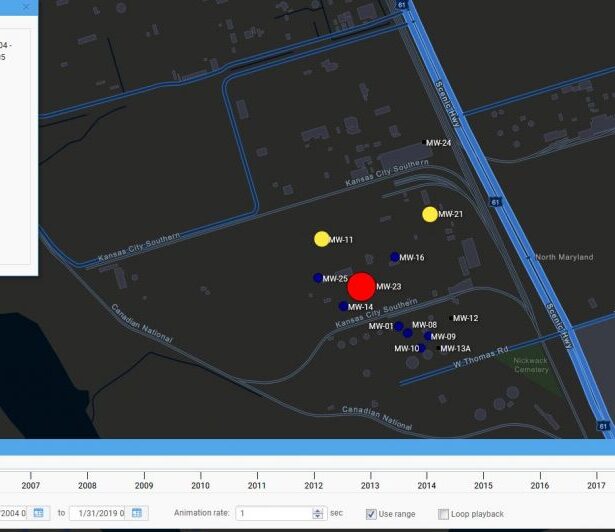
Environmental monitoring programs generate data across time as well as space and understanding how conditions change over time is often as important as understanding where they exist at a given moment. Locus GIS+ includes time slider controls that animate spatial data across defined intervals, making it possible to visualize contamination migration, remediation progress, and monitoring trends in a single evolving map view. This capability is particularly valuable for programs where both measurement values and instrument or sampling locations change over the life of a project.

Locus GIS+

Data Layer Mashups with Public Sources

it possible to assess whether contamination extends into a drinking water supply area, whether asset locations are exposed to flood risk, and how site conditions relate to the broader landscape. Composite maps built from these combined sources are saved and shared within the platform without requiring desktop GIS software.

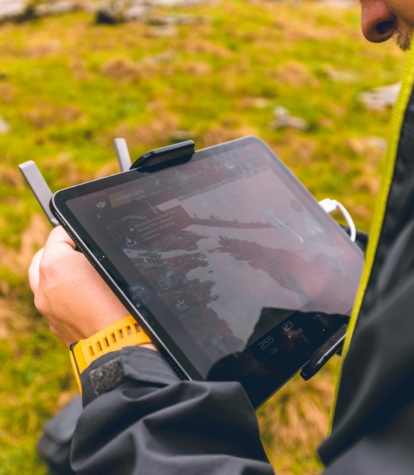
Mobile GIS for Field Teams

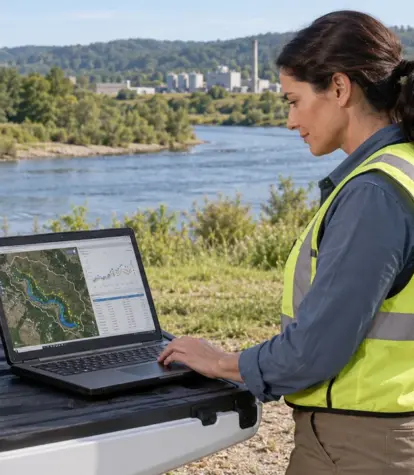
The Locus Mobile app includes a map interface that field technicians use to navigate to assigned sampling locations, confirm their GPS position against site maps, and track which locations have been visited during a field event. New monitoring locations can be created directly from the mobile map by selecting a point, eliminating the need for post-event coordinate entry. Locations created in the field are immediately available in the full GIS+ desktop environment when data syncs, maintaining continuous spatial continuity between field and office.

Explore Mobile & Field Access

ArcGIS Online Integration and Customer Map Layers

rganizations with existing ArcGIS licensing can integrate their own map layers directly into Locus GIS+ through ArcGIS Online and Portal for ArcGIS. Customer-owned base maps, custom symbology, and existing spatial datasets become part of the Locus GIS+ environment, so teams view Locus compliance and laboratory data within the spatial context they already use for site management. The integration preserves prior ArcGIS investments without requiring data migration or format conversion.

06 // Feature Highlights

Spatial intelligence tools built for environmental work

  1. Native GIS mapping embedded in Locus Platform — no export required
  2. Locus GIS+ powered by Esri ArcGIS Online and smart-mapping technology
  3. Spatial query functions including buffering, classification, and overlay
  4. Contour maps, heat maps, and point density maps
  5. Temporal analysis and time sliders for monitoring trend visualization
  6. Data layer mashups combining Locus data with public geographic sources
  7. Mobile GIS for field navigation and on-the-fly location creation
  8. ArcGIS Online integration for customer-owned map layers and base maps
  9. Outputs suitable for regulatory submittals and public-facing databases
Locus Google Earth Visualization

07 // Suzanne DeLorenzo, Director of Water Quality, San Jose Water

"GIS mapping capabilities are essential for our environmental data analysis. Locus GIS+ will allow quick data visualization

and is a quantum leap forward with advanced analysis tools that use Esri's Smart Mapping technology."

08 // Software Demonstration

See your environmental data in the spatial context it belongs in.

Schedule a live demo of Locus GIS+ and explore your compliance data on a map.
Schedule a Demo

Frequently Asked Questions

09 // FAQ

Locus Platform includes two levels of embedded GIS. The standard option provides Google Maps-based visualization of sampling locations, assets, incidents, and facility boundaries. The premium Locus GIS+ adds spatial query, contour mapping, time series analysis, buffering, choropleth maps, heat maps, and access to public-domain maps for professional-grade spatial analysis, with no ArcGIS Online or Portal subscription required. For organizations that do use ArcGIS Online or Portal, their existing maps are available in Locus GIS+ for seamless use.

Yes. Locus GIS+ supports spatial queries that connect environmental measurements to geography. Teams can identify which monitoring locations with elevated readings fall within a specified distance of a sensitive receptor, whether contamination plumes overlap aquifers, or where pipeline segments cross protected waterways. These spatial relationships are analyzed and mapped within Locus, drawing directly from the validated compliance and laboratory data already in the system of record.

Yes. Locus GIS+ includes time sliders and temporal analysis tools that visualize how spatial data changes across defined intervals. This supports plume migration analysis, remediation progress tracking, and long-term monitoring trend visualization within the mapping interface. For programs where both measurement values and monitoring locations change over time, Locus GIS+ handles both dimensions simultaneously in a single animated map view.

Yes. Locus GIS+ allows teams to combine their Locus data with public geographic layers available through ArcGIS Online including aquifer boundaries, watersheds, wetland polygons, flood plains, and topographic surfaces. This makes it possible to assess the geographic context of contamination, evaluate property risk relative to flood exposure, and prepare maps that demonstrate regulatory impact for report submittals and public environmental databases.

Yes. The Locus Mobile app includes a map interface that field technicians use to navigate to sampling locations, track their position against site maps, and create new monitoring locations on-the-fly by selecting a point on the map. GPS coordinates are captured automatically with each field entry. Locations created in the field are immediately available in the full GIS+ desktop environment when data syncs, with no coordinate transcription required.

Locus GIS+ integrates directly with ArcGIS Online and Portal for ArcGIS, allowing organizations to display their Locus compliance and laboratory data within existing ArcGIS map environments. Customer-owned base layers, custom symbology, and saved map configurations are incorporated into the Locus GIS+ interface. This protects prior ArcGIS investment and provides spatial context that teams already use for site management, without requiring duplicate data management or format conversion.