5-red-flags-outdated-software-laptop

For 26 years, Locus Technologies has been helping organizations that serve millions of people a day. Throughout that time, our team of experts have noticed some common red flag with the alternative solutions that are available on the market. The alternatives can be more problematic that helpful, creating data congestion and slowing down your workflow. Your organization deserves a solution that alleviates the burdens of data entry, regulatory compliance, voluntary reporting, and more. Here are the top five signs that your organization is using outdated water software:

1. Using paper form and/or transcribing data more than once

To ensure the highest level of data quality, you should not be risking human error at multiple levels. Enter your data once, and have it audit-ready, set to go on regulatory and voluntary reports, which are created directly from Locus Software.

2. Software support is not led by the specialist.

Support doesn’t end after implementation. What we often hear from our customers when they switch from other providers is that they are delighted with the level of support that Locus brings with our software. Locus is proud to have the expertise and experience to back our software, and if there is anything you need, you can be sure that Locus support can get it done smoothly.

3. The software has regular or unexpected downtimes.

You need reliability. Your software should be available to you on-demand. Locus is proud to be the only environmental software developer to publicly share our uptime, which is over 99.9%. If you are experiencing downtimes at inconvenient times or for long periods, you should switch.

4. It’s not mobile-enabled.

Field collection is key for most organizations managing water quality data. You should be able to enter that data into your system once, and from anywhere, reducing errors and extra time doing the same work twice (or more!). Also, being able to access historical data at your fingertips can help you solve problems on the fly.

5. It doesn’t provide actionable insights.

Sure, you may have all your data collected, but what are you doing with it? If your software is not giving you meaningful findings from analyzing your data, then you are always going to be playing catch-up. Having the tools to help your organization look forward is essential in selecting water data management software.

Want to learn more about our Water Data Management Solution? Reach out to our product specialists today!

    Name

    Company Email

    Phone

    Tell us about your company's needs

    Locus is committed to preserving your privacy.

    [sc_vimeo width=”640″ height=”360″ aspect_ratio=”16:9″ video_id=”814747329″ style=”default” position=”right”]

    The EIM platform lets the user perform successful searches through various methods. In all searches, the user does not need to specify if the search term is a menu item, help page, or data entity such as parameter or location. Rather, the search bar determines the most relevant results based on the data currently in EIM.

    Locus Technologies President, Wes Hawthorne tells us in this video how useful he finds this feature on the EIM platform.

    [sc_button link=”https://www.locustec.com/blog/quick-search-and-natural-language/” text=”Click here to learn more” link_target=”_self” color=”000000″ background_color=”52a6ea”]


    Request a demo

    Send us your contact information and a Locus representative will be in touch to discuss your organization’s needs and provide an estimate, or set up a free demo of our enterprise environmental software solutions.

      Name

      Company Email

      Phone

      Tell us about your company's needs

      Locus is committed to preserving your privacy.

      Water and wastewater operation and maintenance (O&M) mobile tracking apps have existed for some time now. Users are now familiar with the benefits of these apps such as instant data collection and access to reference information for better, more reliable O&M monitoring. As technology progresses and makes improvements your current application might seem outdated. Upgrading to a custom application with excellent customer support is easy with Locus Technologies. Below we have compiled some of our “must-haves” when looking for an upgraded application. 

      Unique and Custom Forms:  

      For many O&M programs, you may have your own data collection needs that are specific to your facility or industry. Mobile O&M apps now allow you to tailor your input forms to add new data fields, remove unwanted fields, change some of the logic like making certain fields required, and make certain fields tied into established pick lists. Even better, you can match the mobile form to the original paper form, making the transition to mobile simple and intuitive for staff. The more the merrier, as modern mobile apps let you have multiple forms on the same app, so you have everything you need in one place.

      Real-time entry validation: 

      It is not enough to just enter your O&M information into a mobile device. You also want to make sure you are entering the correct data. Current O&M mobile tools can check your entry as you enter it and validate it against whatever criteria are established for that data. For example, make sure that you are entering a pH reading of 7.2, rather than 72. You can also use configurable pick lists to limit data entry to your specific desired entries and not have to correct misspellings or 16 different ways to say, “out of service”. Make sure that pick lists are configurable and can be shared with each of your company’s devices. 

      Barcode and QR code scanning: 

      You are already using your phone to compare prices at your local store. It is amazingly easy to simply scan a product’s barcode and instantly see the best available price locally or online. Since every phone/tablet now has a built-in camera, you can use that to scan barcodes or QR codes to associate data entry with a tagged sampling port or asset. This can save you from mismatched errors that can occur when simply selecting from a list or typing in data.

      Use your voice: 

      We are starting to use voice recognition technology in our mobile devices to quickly send out text messages. Why not use it for recording inspection/audit comments or field issues? Voice recognition is improving every year and can provide your comments onto a data collection form much faster than typing and can be especially useful for conditions where gloves are required and typing, or stylus input is not practical. Using the phone’s native abilities, take advantage of the voice feature to streamline note-taking, knowing that you can always fix up any issues back in the office. 

      Review, Sync, Repeat: 

      Mobile apps should have a summary screen to review your data before sending it back to your database, such as a summary form for all data collected during a shift. And once you do sync your data back to the main database (you have a main database, right???), instantly reset the form for the next day’s data collection event so you are always ready. 

      No Internet? No Problem! 

      Mobile apps that will not function when there is no connection should be abandoned. You need to be able to collect data no matter the location and the signal strength. Look for mobile apps that function with zero connectivity and save the data until a signal is found. Not every location at modern water and wastewater facilities has a hot spot, so be prepared with the right app. 

      Locus-Mobile-Water-Sampling

      [sc_button link=”https://www.locustec.com/applications/mobile-field-data-collection/” text=”Learn more about Locus Mobile” link_target=”_self” background_color=”52a6ea” centered=”1″ separator_style=”double”]

      There is a need for most water entities to centralize data, and more easily load, share, analyze, and report data. Locus Technologies’ customizable software makes scheduling and collecting routine water samples is made easy by using Locus Mobile and EIM. Below is a list of frequent challenges that customers have encountered during their water sampling process and how they can be solved using the right tools from Locus. or better communications. 

      Challenge 1: Finding a flexible sampling planning tool 

      Planning tools need to allow flexibility in terms of different sampling intervals and date ranges, different field and analytical parameters, and account for location grouping. Using a well-designed application can pull together all of this detailed information and can provide a summary view of the individual samples. A manager can easily view sample status, and whether the sample is complete, in process, or planned.  A well-designed application can also generate the chain of custody (COC), and lab and sample shipping date information and labels per sample, which is a huge time saver. This type of sample tracking detail seemed to be very useful to many conference attendees to help ensure they are in regulatory compliance with required sampling frequencies. A key feature to look for is an application that is flexible enough that it can allow one-time, unplanned sample events such as water main breaks, customer complaints and schedule changes, and can handle complex multi-year routine sampling with ease. As a plus, it’s easy for you or your manager to know where you stand at any time. 

      LocusPlatform_Water_Sampling

      Challenge 2: Eliminating data entry errors caused by hand data entry 

      Data entry errors and fixing bad data when it was transcribed from field notes to Excel or other programs is a persistent problem with the old way of doing things.  Your company needs a better way to streamline the error prone data collection process.  Many clients are interested in an alternative to the pencil/paper/clipboard method and had goals to move to tablet or smartphone for data collection.  The universal wish list for mobile field applications included: 

      • Easy to use and set up 
      • Built in data validation to catch data entry errors at the source 
      • Direct upload to a data system so the end of the day all the daily samples were in the system with the push of a button 
      • Prepopulating locations especially for large water systems 
      • Complete field instructions for samplers on what to collect and where to collect it to eliminate missed samples 
      • Smart tracking to know on a daily/weekly basis, what samples were collected and what samples were still outstanding 
      • Integrated with sample planning tools (See challenge 1) to automate the sampling instructions and track the data collection activities vs plan 

      Locus-Mobile-Water-Sampling

      Challenge 3: Getting the most out of their software, especially regarding updates 

      Everyone is aware that software updates all the time.  Sometimes its security enhancements and sometime feature enhancements or bug fixes.  A source of frustration is getting a software update and not knowing what was updated or how best to incorporate a new feature/enhancement into their established process.  There was also concern for impact to an established routine with field crews that were used to the existing way of doing things. Even if a functionality improved the workflow, enhancements are only valuable to a user if they understand how to use them and how to incorporate them into their existing process. 

      Some suggestions from the attendees included:
      • Concurrent documentation updates with software updates 
      • “Quick start” guides for new functionality 
      • Online training on the new functionality with recording for later viewing 
      • Heads up on what is coming in the next several months so they can do strategic planning (sharing the roadmap) 
      • Sandbox environment to test the enhancements before going in production so they can plan how to incorporate the features into their process and train field crews 

      Mobile applications, which appear very simple to the users, are in reality complex software and require careful integration with the receiving database for a range of complex use cases.  This makes rolling out new mobile features challenging for both the developers and the users.  Enhanced customer/developer communication along with a sandbox environment can go a long way towards solving some of the inherent issues with rapid innovations and updates associated with cloud and mobile software. 

      Locus-Technologies-Training-and-Support

      Software tools are available and can solve a lot of the common data management challenges, but know what you want, know the problem you are trying to solve and know it will take some time and effort, but the end result will significantly improve your business processes. Though these challenges are present when choosing a software, Locus Technologies has the experts to help you hurdle the challenges to find the solution that is best for your business. 

      Request a demo

      Send us your contact information and a Locus representative will be in touch to discuss your organization’s needs and provide an estimate, or set up a free demo of our enterprise environmental software solutions.

        Name

        Company Email

        Phone

        Tell us about your company's needs

        Locus is committed to preserving your privacy.

        Locus GIS+ will streamline SJW’s water quality and environmental management from watershed to consumer taps.

        MOUNTAIN VIEW, Calif., 14 February 2023Locus Technologies, the leading EHS Compliance, and ESG software provider, today announced that San Jose Water (SJW), an investor-owned public utility providing water service to a population of approximately one million people in the Santa Clara Valley, has expanded Locus’ environmental information management software to use Locus GIS+ for advanced GIS analysis.

        SJW has been using Locus SaaS and mobile app since 2014 to manage its field data collection, water quality compliance, and regulatory reporting. SJW also uses Locus to track sewer discharges and well blow-offs.

        “Our responsibility is to ensure our customers receive the highest quality drinking water from their taps. We monitor the quality and cleanliness of our water in terms of state and federal regulatory requirements. In 2021, our highly experienced staff collected more than 1,000 regulatory and non-regulatory samples from our distribution system and treatment plant, generating over 23,000 data points. To manage this data effectively, we used Locus’ cloud-based software. GIS mapping capabilities are essential for our environmental data analysis. Locus GIS+ will allow quick data visualization and is a quantum leap forward with advanced analysis tools that use Esri’s Smart Mapping technology,” said Suzanne DeLorenzo, the Director of Water Quality at San Jose Water.

        “Locus’s mission is to help organizations, such as San Jose Water, to achieve their business goals by providing them the software tools to manage key data associated with water quality and compliance reporting,” said Neno Duplan, CEO of Locus. “With GIS+, SJW will have all the tools they need to perform a wide range of geospatial data analysis across their distribution system. Our water quality management cloud-based software, coupled with GIS+ and Locus Mobile for field data collection, provides our customers with a highly scalable and feature-rich application that gives water utilities strong analytical power and advanced GIS capabilities.”

        Locus GIS+ is powered by Esri’s ArcGIS platform and offers various advanced features— including enhanced cartography, comprehensive spatial data analysis, and the ability to use the customer’s map data through integration with ArcGIS Online and Portal for ArcGIS.


        ABOUT SAN JOSE WATER
        Founded in 1866, San Jose Water is an investor-owned public utility and is one of the largest and most technically sophisticated urban water systems in the United States. Serving over one million people in the greater San Jose metropolitan area, San Jose Water also provides services to other utilities, including operations and maintenance, billing, and backflow testing. San Jose Water is owned by SJW Group, a publicly-traded company listed on the New York Stock Exchange under the symbol SJW. SJW Group also owns Connecticut Water Company in Connecticut; Maine Water Company in Maine; and SJWTX, Inc. (dba Canyon Lake Water Service Company) in Texas. To learn more about San Jose Water, visit www.sjwater.com.

        Tracking your data is made easy within our software as a service (SaaS), Locus Platform (LP). Your company can take advantage of LP’s mobile-aware browser functions, giving you the capability to do all your fieldwork with your existing phones or tablets.   When cellular connections are unavailable or unreliable, Locus also has a Mobile app which supports the offline capabilities you need to keep your workflow going. 

        Regardless of your mobile approach, each mobile form can be easily configured to capture the data you require in the field such as photos and the sampling results.  

        Along with easy mobile data collection, Locus Platform can help you to:
        • Track and report your daily results, such as chlorine, nitrite and temperature to water treatment operators, for real time adjustments.
        • Monitor lab results from routine sampling. 
        • Flag out of range data in real time for notifications or data entry corrections. 
        • Analyze data geospatially to understand situations impacting water quality. 
        • Report average monthly chlorine results. 
        • Track water quality complaints and illicit discharges overtime.  
        • Generate Nitrification Reports.  
        • Prepare Monthly Flushing reports. 
        Of course, those are not the limits of Locus Platform. Our software can also help you to: 
        • Track and manage all types of tasks and regulatory commitments. 
        • Track any type of permit and associated requirements. 
        • Generate notifications for defined events, such as data entered above limits. 
        • Produce PDF and Excel reports for regulators and customers. 
        • Keep all your information in an easy-to-use secure system and basically future proof your program. 

        Whether in the office, or out in the field, Locus Technologies is with you every step of the way during the tracking process. Contact us to find your solution. 

        Request a demo

        Send us your contact information and a Locus representative will be in touch to discuss your organization’s needs and provide an estimate, or set up a free demo of our enterprise environmental software solutions.

          Name

          Company Email

          Phone

          Tell us about your company's needs

          Locus is committed to preserving your privacy.

          2022 has given us a wealth of new features and growth! Both of our platforms have undergone improvements to enhance our client’s user experience. Let’s look at all the new features for 2022.

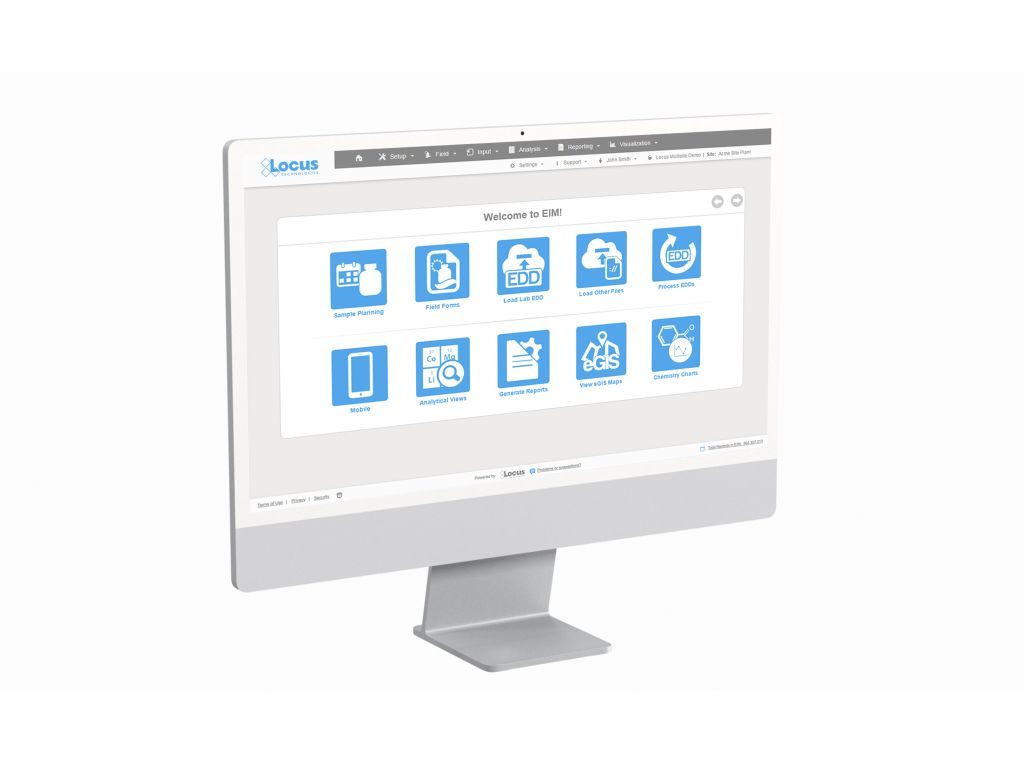
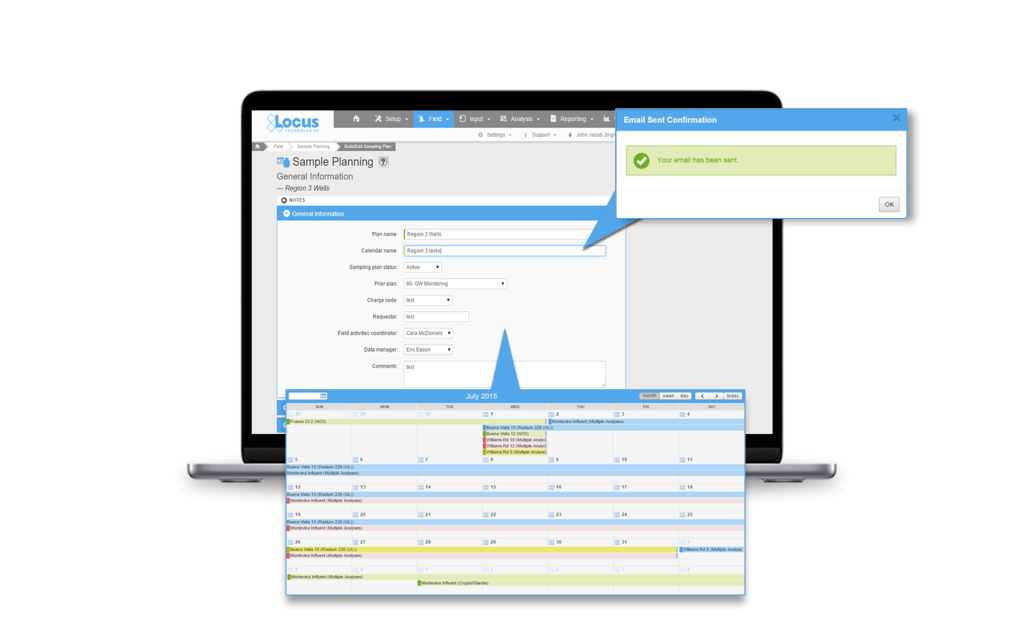
          Environmental Information Management (EIM)

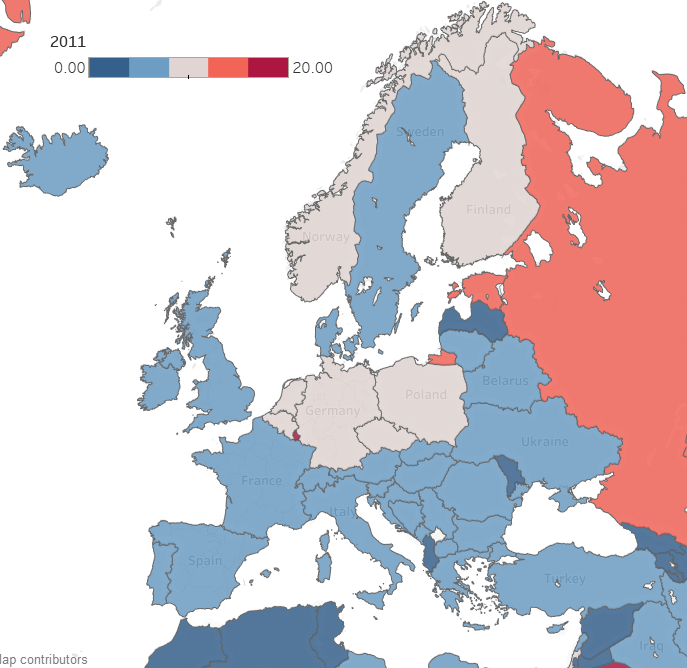
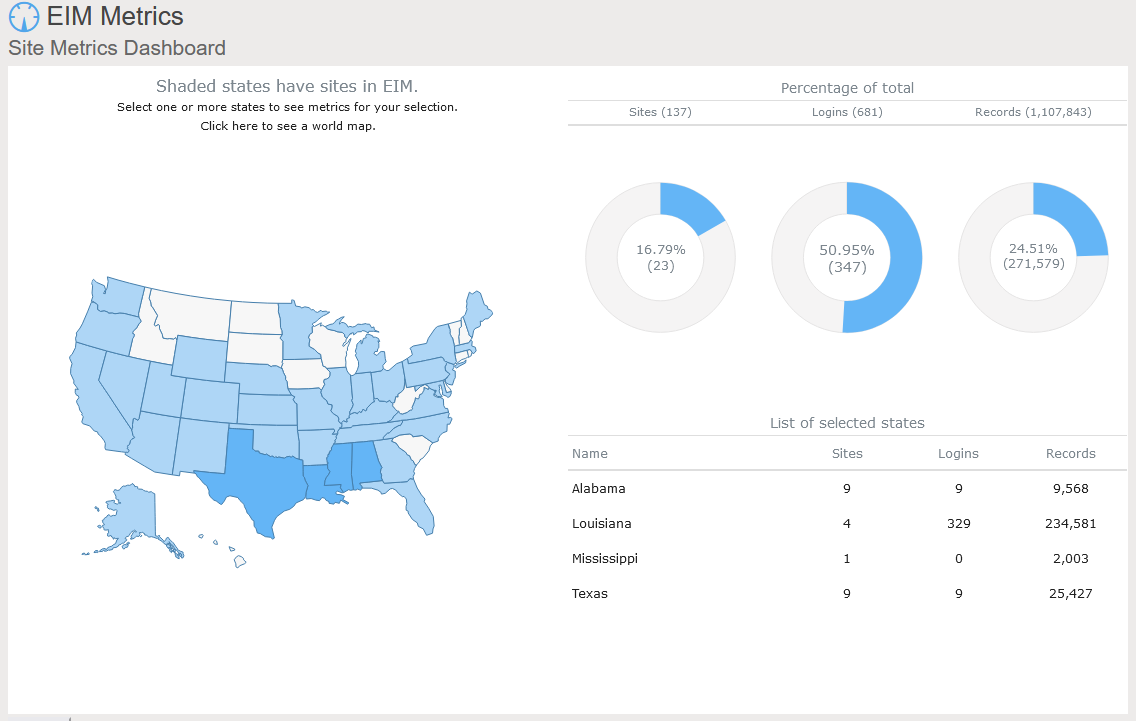
          [sc_icon_with_text icon=”mapping” icon_shape=”circle” icon_color=”#ffffff” icon_background_color=”#52a6ea” icon_size=”big” level=”h3″]

          1. New Site Metrics dashboard allows immediate visibility into your data with clickable mapping. This is especially powerful for customers with multiple sites where they want to keep track of site activity and usage. [/sc_icon_with_text]

          [sc_icon_with_text icon=”multisite-view” icon_shape=”circle” icon_color=”#ffffff” icon_background_color=”#9ac63f” icon_size=”big” level=”h3″]

          2. Finding data can sometimes be overwhelming especially when you have hundreds, if not thousands, of locations and numerous analytical parameters to review. Locus added advanced database search tools to support multiple search terms and ‘exact match’ searches, making it easy to find exactly what you want with a couple of key words and a click. Never has finding the right results from large complex datasets been so easy. [/sc_icon_with_text]

          [sc_icon_with_text icon=”integration-service” icon_shape=”circle” icon_color=”#ffffff” icon_background_color=”#3766b5″ icon_size=”big” level=”h3″]

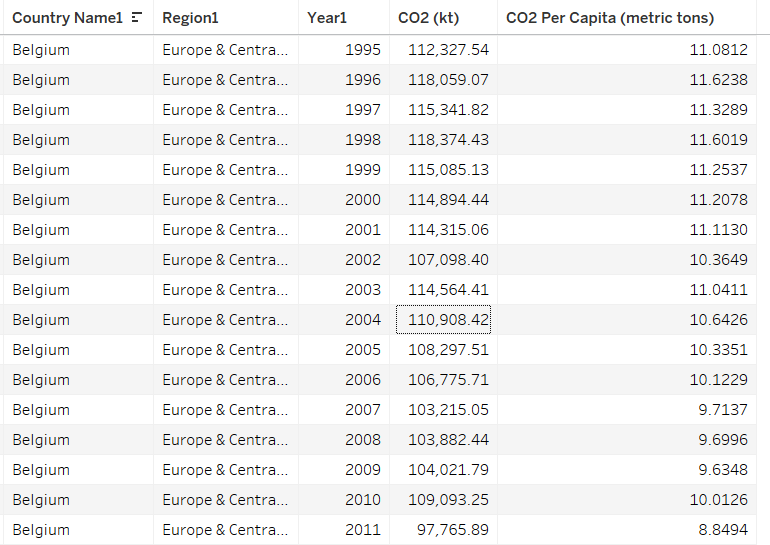
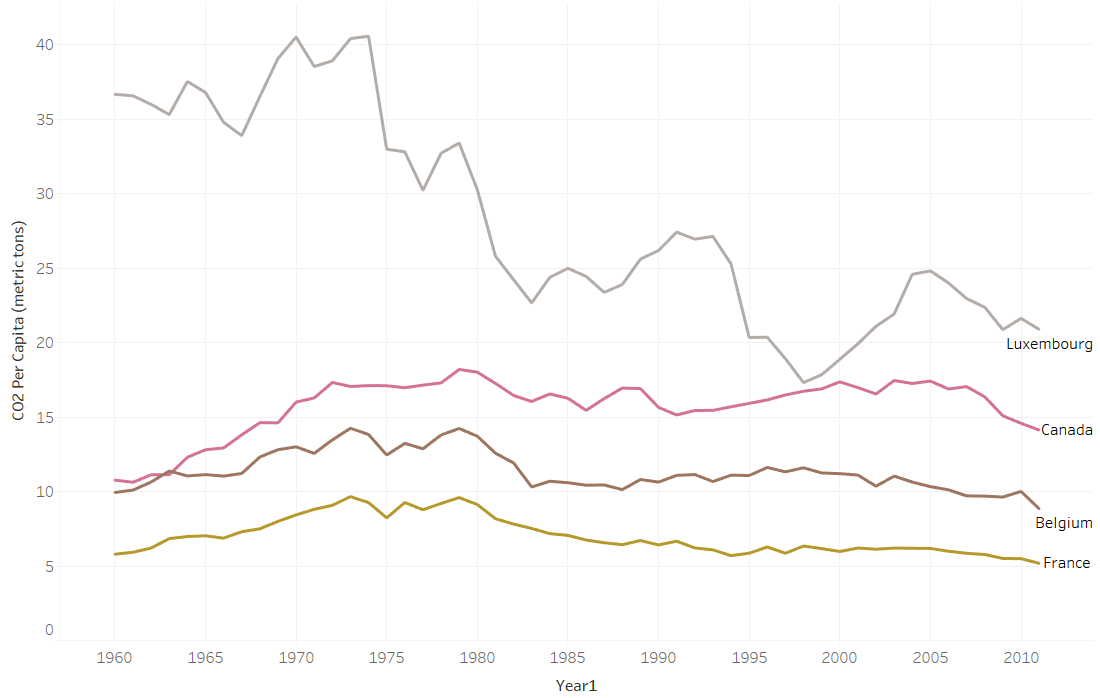
          3. Locus has enhanced its API functionality to enable easier integration with external BI tools, including Tableau, PowerBI, and other apps. Now, customers that rely on external business analytical tools will have quick and easy access to data to combine with other internal data sources. [/sc_icon_with_text]

          [sc_icon_with_text icon=”locus-docs” icon_shape=”circle” icon_color=”#ffffff” icon_background_color=”#52a6ea” icon_size=”big” level=”h3″]

          4. Locus document management has been taken to the next level by allowing customers to link documents from any external library directly into their sites, monitoring locations, samples, and more.  This means with a simple click, users can go to lab reports, regulatory reports, and any other current or historical document associated with the site.  If you are using SharePoint, for example, to manage documents – they can be accessed directly from Locus software.  Document access and security will be preserved by existing document library access controls. [/sc_icon_with_text]

          [sc_icon_with_text icon=”help” icon_shape=”circle” icon_color=”#ffffff” icon_background_color=”#9ac63f” icon_size=”big” level=”h3″]

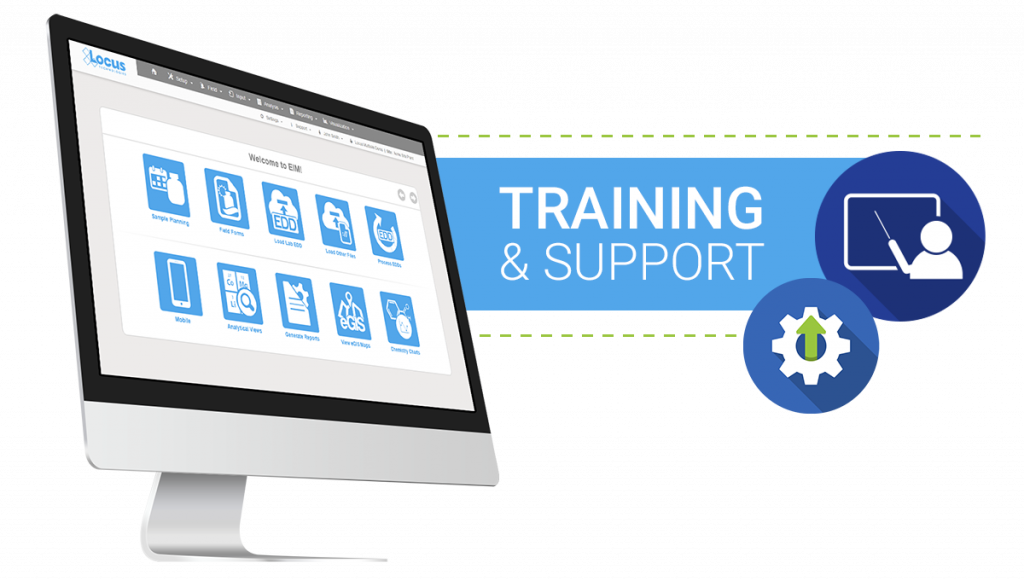
          5. 2022 was the year of “help”.  In addition to the advanced search, Locus added a new Help Browser to provide access to comprehensive documentation for every feature of the software.  It is similar to the familiar site map, only the links take you to help content.  With this new feature, users can view help in a single location vs having to access the information on each individual screen.  For new users, or infrequent users, this will be their new favorite feature. [/sc_icon_with_text]

          EHS & ESG Solutions

          [sc_icon_with_text icon=”material-consumption” icon_shape=”circle” icon_color=”#ffffff” icon_background_color=”#52a6ea” icon_size=”big” level=”h3″]

          1. Locus’ Survey/Questionnaire tool enables you to securely & easily obtain data globally without the burdens of training or maintaining user lists. The survey system effortlessly supports data entry from external organizations (such as suppliers) or even occasional users internal to your organization, with a simple link click. [/sc_icon_with_text]

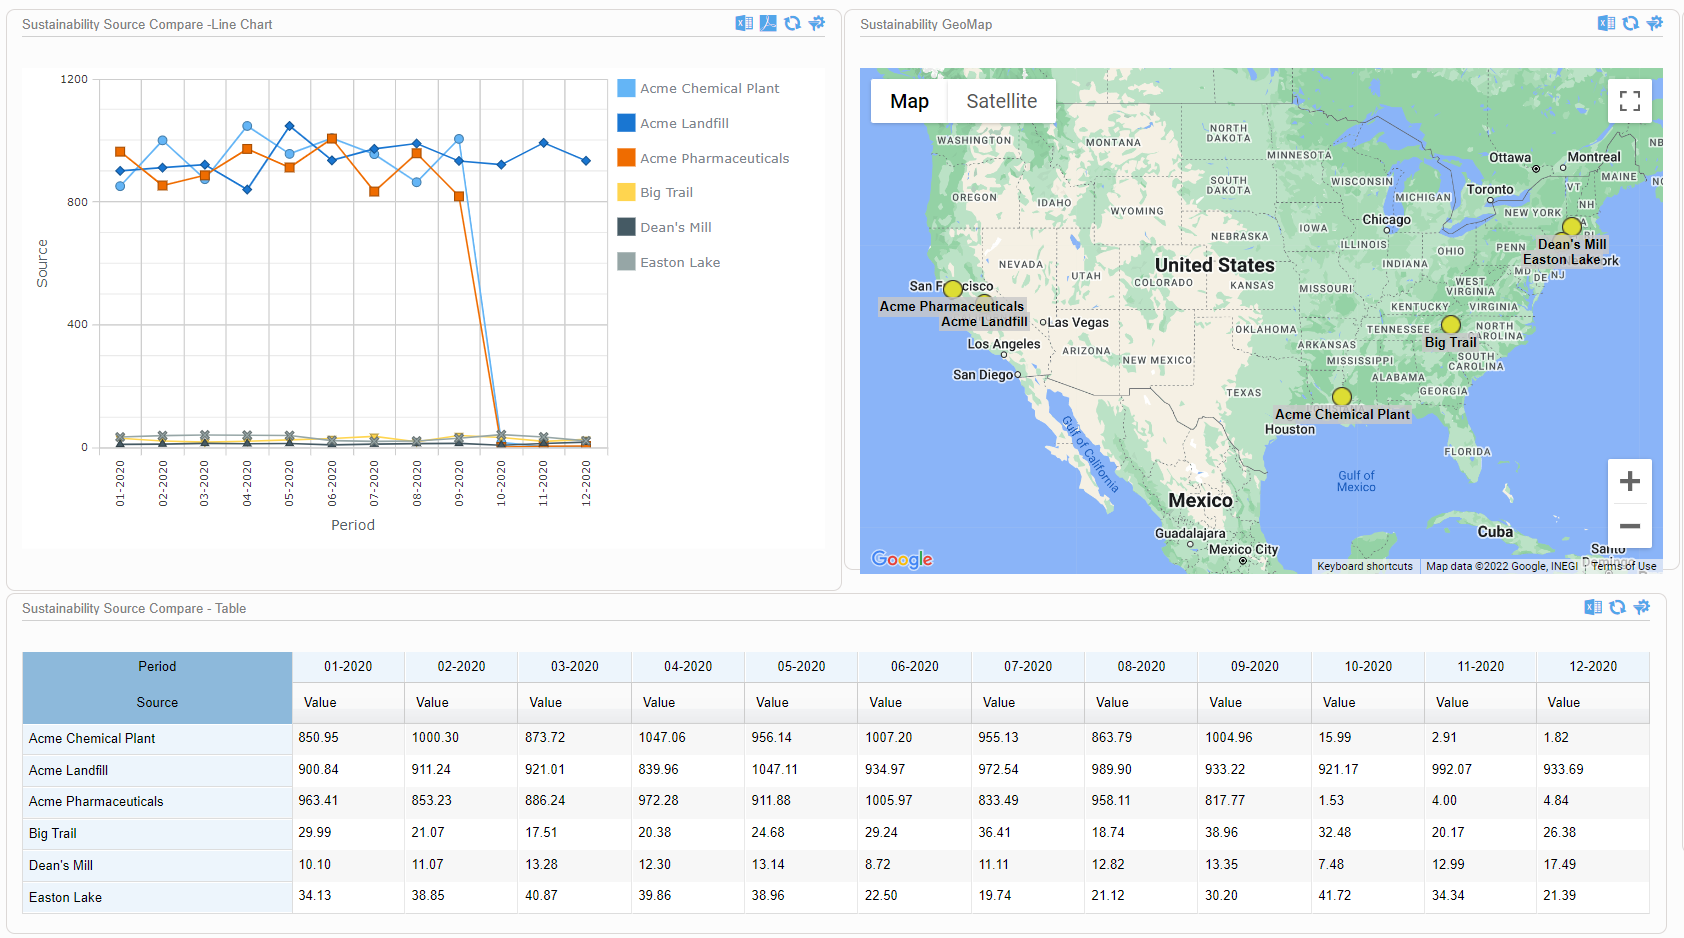
          [sc_icon_with_text icon=”drag-up–down” icon_shape=”circle” icon_color=”#ffffff” icon_background_color=”#9ac63f” icon_size=”big” level=”h3″]

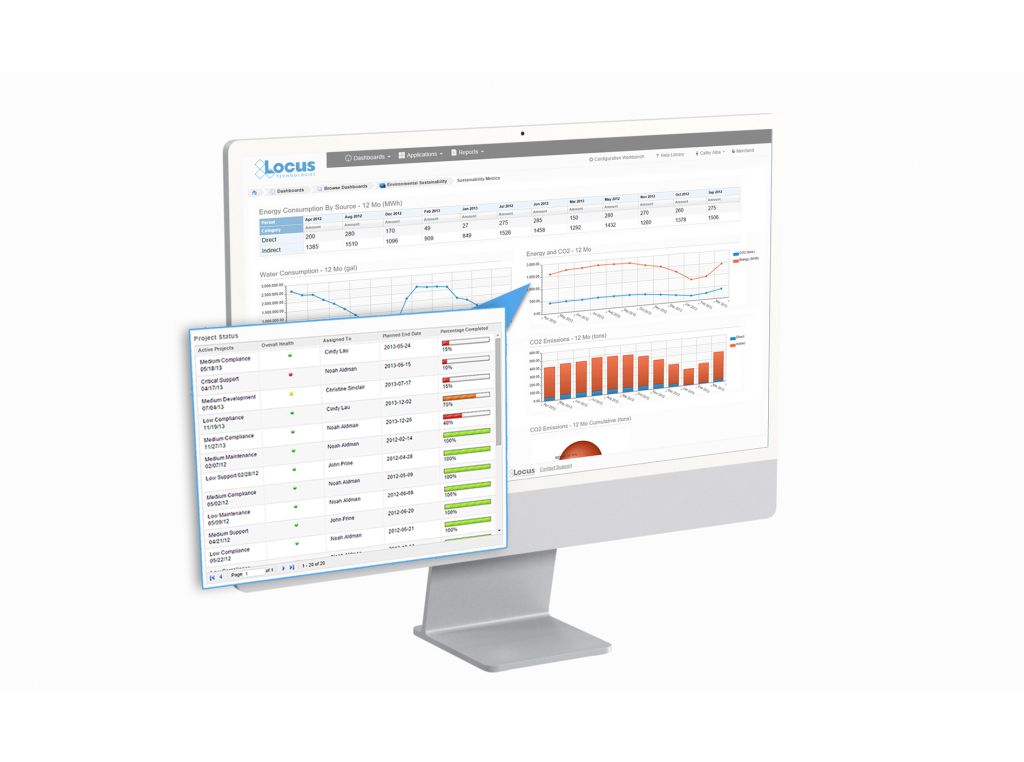
          2. Locus released a new pivot table tool that enables you to perform full data analysis on any query in the system.  Data may be grouped and organized by any value. Output options include bar charts, heatmaps, tables, area charts, scatter charts, and tree maps. In support of the output options, Locus has improved the ability for users to create dashboards more easily. [/sc_icon_with_text]

          [sc_icon_with_text icon=”audit” icon_shape=”circle” icon_color=”#ffffff” icon_background_color=”#3766b5″ icon_size=”big” level=”h3″]

          3. Complex inspection and audit forms require branching, sophisticated, scoring, and automated responses.  Locus added new question types to its inspection/ audit module, including conditional questions based on responses to one or more previous questions. Locus augmented the scoring calculation mechanism and automated creation and tracking of corrective action. [/sc_icon_with_text]

          [sc_icon_with_text icon=”tasks” icon_shape=”circle” icon_color=”#ffffff” icon_background_color=”#52a6ea” icon_size=”big” level=”h3″]

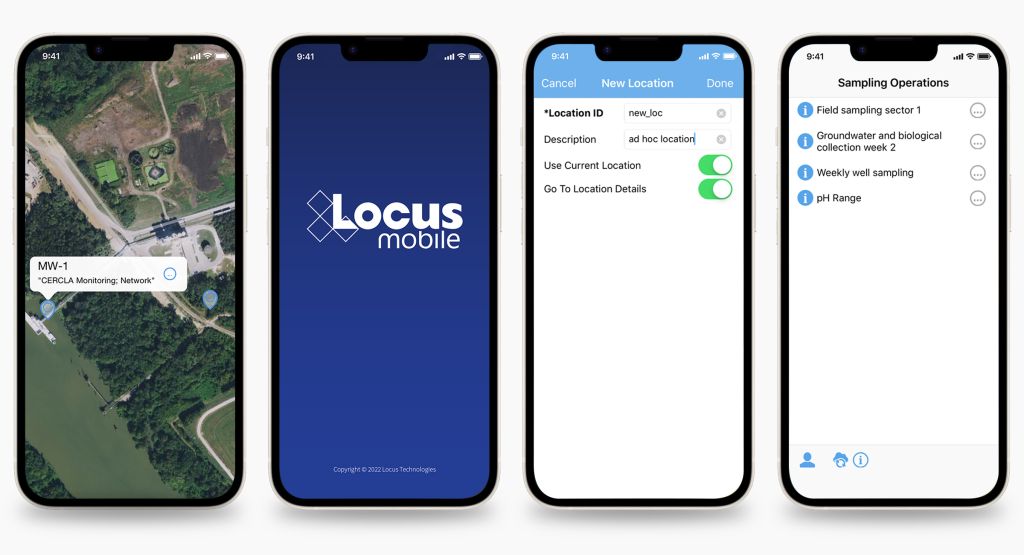
          4. In today’s world, users need access to environmental data on the go.  Locus augmented its mobile offerings to include configurable layouts for mobile users, with compact forms specially designed for smartphone and tablet access.   [/sc_icon_with_text]

          [sc_icon_with_text icon=”manage-entities” icon_shape=”circle” icon_color=”#ffffff” icon_background_color=”#9ac63f” icon_size=”big” level=”h3″]

          5. Today’s managers want immediate access to the data they need. Locus new Landing Page feature makes it simple to configure the dashboards, bookmarks, and record lists. This enables the user to review just the areas they need to see and navigate efficiently to complete the work.  [/sc_icon_with_text]

          Contact us to see a demo of Locus software and get a quote

            Name

            Company Email

            Phone

            Tell us about your company's needs

            Locus is committed to preserving your privacy.

            Today is GIS Day, a day started in 1999 to showcase the many uses of geographical information systems (GIS). Earlier Locus blog posts have explained how GIS and maps support visualization of objects in space and over time. This post covers a specific visualization method called data dashboards.  

            A data dashboard is a combination of charts, maps, text, and images that enables analysis of data and thereby promotes discovery of previously unknown relationships in the data. Companies and organizations use dashboards to develop insight into the overall status of a company or of a company division, process, or product line. Dashboards are also a common function in ‘business intelligence’ applications such as Microsoft Power BI and Tableau. A printed dashboard is static, but an online dashboard can be dynamic; in a dynamic dashboard, interacting with one item on the dashboard causes the other items to update. Taken together, the visualizations on a dynamic dashboard can help you find the story in your data. 

            One reason dashboards are so helpful is that they allow humans to partially ‘offload’ their thinking. Cognitive research has shown that human ‘working memory’ handles at most four items at a time. A good visualization, however, reduces the number of items to process in memory. 

            Consider a large table of carbon dioxide emissions by country for multiple years; it can be difficult to keep all the numbers in mind if you are trying to find trends.

            If you plot the data in a graph, however, each series of data in the chart becomes just one line on the graph. It is much easier to compare lines on the chart than to compare columns of numbers.

            Now consider making a map with countries color coded by emissions. Again, for each country, the map reduces multiple numbers to a single color for that country on the map. You can compare country colors more easily than columns of numbers.

            A dashboard that combines multiple visualizations further enhances data analysis. Imagine a dynamic dashboard showing you both the emissions chart and map described above. If you select a country on the map, the chart can highlight the line for that country, so you compare its emissions to other countries over time. Similarly, if you select a line on the chart for a specific country, the map can highlight the selected country to show how its emissions compare to nearby countries. This interactivity lets you drill into your data more effectively than using either the chart or the map by itself.

            Here are three examples of effective dashboards that are available online:

            Locus includes data dashboards in our applications. One example is the Site Metrics dashboard in EIM, Locus’s cloud-based, software-as-a-service application for environmental data management. The Site Metrics dashboard lets you perform roll-up queries across your portfolio of sites. A map on the dashboard shows all states with active sites. If you select one or more states, the dashboard updates the charts and tables on the right to show total sites, user logins, and record counts. Other dashboards can support showing sample locations of certain chemicals or counts of regulatory limit exceedances.

            A further example comes from the Locus Environmental Social and Governance (ESG) application. ESG metrics are becoming increasingly important measures for an organization’s performance. Data dashboards can help companies quickly visualize trends in their ESG metrics using intuitive mapping tools.

            This dashboard illustrates both spatial and time trends and provides the raw data necessary for auditability and transparent decision making. Having these features on a single combined view provides users with instant access to the key inputs for ESG prioritization, planning, and project implementation.

            As these examples from Locus show, data dashboards with integrated mapping are important tools for maximizing the value of your collected environmental and ESG data. For any dataset with a geographic component, it’s important to incorporate mapping elements in the outputs, to highlight trends and patterns that may not otherwise be visible in a chart or table. Modern software can combine these output formats in a way that tells the story shown by your data.


            Interested in Locus’ GIS solutions?

            Locus GIS+ features all of the functionality you love in EIM’s classic Google Maps GIS for environmental management—integrated with the powerful cartography, interoperability, & smart-mapping features of Esri’s ArcGIS platform!

            [sc_button link=”https://www.locustec.com/applications/gis-mapping/” text=”Learn more about Locus’ GIS solutions” link_target=”_self” color=”#ffffff” background_color=”#52a6ea” centered=”1″]


            [sc_image width=”150″ height=”150″ src=”16303″ style=”11″ position=”centered” disable_lightbox=”1″ alt=”Dr. Todd Pierce”]

            About the Author—Dr. Todd Pierce, Locus Technologies

            Dr. Pierce manages a team of programmers tasked with development and implementation of Locus’ EIM application, which lets users manage their environmental data in the cloud using Software-as-a-Service technology. Dr. Pierce is also directly responsible for research and development of Locus’ GIS (geographic information systems) and visualization tools for mapping analytical and subsurface data. Dr. Pierce earned his GIS Professional (GISP) certification in 2010.

            To celebrate a milestone 25 years of success in EHS and ESG software development, we sat down with Locus President, Wes Hawthorne for a brief discussion. In this post, we ask him a series of questions highlighting the past, present and future of EHS and ESG.

            1. What are the greatest challenges that environmental professionals are facing?

            One of the persistent challenges we’ve seen for the past 25 years is that the responsibilities of environmental professionals are continually expanding. Previously, almost all environmental work was localized, with facility-level permits for air, water, waste, etc. That has expanded over the years to include new regulations and reporting requirements for sustainability, social metrics, and other new compliance areas, while the old facility-level programs still continue. This has led to more pressure on environmental managers to keep up with these programs, and increased reliance on tools to manage that information. That’s where Locus has always focused our effort, to make that ever-expanding workload more manageable with modern solutions.

            2. What are the most interesting trends in EHS and ESG?

            The current flood of interest in ESG is certainly notable as far as bringing corporate attention to the environmental field, as well as having requirements originate from the SEC here in the US. We have become accustomed to managing oversight from multiple regulatory bodies at the local, state, and federal level, but SEC would be a newcomer in our line of work. Their involvement will be accompanied by a range of new requirements that are common for the financial world, but would be unfamiliar to environmental staff.

            Across other EHS fields, we are seeing increased demand for transparency in EHS functions. Overall, this is a positive move, as it brings more attention to EHS issues and develops a better EHS culture within organizations. But this also drives the need for better tools to make EHS information readily available across all levels of the organization.

            3. What are the most disruptive technologies available today?

            As far as technologies, the ones most likely to have significant impact in the environmental field are ones that don’t require a significant capital investment. Although there are definitely some practical advantages to installing smart monitoring devices and other new technologies, procuring the funding for those purchases is often difficult for environmental professionals. Fortunately, there are still many technologies that have already been implemented successfully in other fields, but only need to be adapted for environmental purposes. Even simple changes like using web-based software in place of spreadsheets can have a huge impact on efficiency. And we haven’t yet seen the full impact of the proliferation of mobile devices on EHS functions. We are still working on new ways to take advantage of mobile devices for data collection, analysis, and communication purposes.

            4. What do you think are the biggest innovations of the last 25 years in our field?

            We’ve seen a number of innovation milestones in the past 25 years, and while we didn’t invent SaaS, we’ve been largely responsible for adapting it and perfecting it for environmental purposes. One of the major innovations we’ve integrated into our products include online GIS tools where users can easily visualize their environmental data on maps without expensive desktop software. Another one was our fully configurable software platform with built-in form, workflow, and report builders tailored for environmental purposes, which allows anyone to build and deploy environmental software applications that exactly match their needs. There have been many other innovations we’ve incorporated into our software, but these two stand out as the most impactful.

            5. Where do you see Environmental and ESG reporting in the future?

            More and more, we are seeing all types of reporting being converted into pure data exchanges. Reports that used to include regulatory forms and text interpretations are being replaced with text or XML file submittals. This transition is being driven largely by availability of technology for EHS professionals to generate and read these files, but it is also promoted by regulatory agencies and other stakeholders receiving these reports. Stakeholders have less time to read volumes of interpretive text, and are becoming more skeptical of potential bias in how facts are presented in text. These are driving the need for more pure data exchanges, with increasing emphasis on quantifiable metrics. These types of reports are also more readily compared against regulatory or industry standards. For reporters, lengthy corporate reports with volumes of text and graphics are becoming less common, and the success of an organization’s programs will be increasingly reliant on robust data sets, since ultimately only the data will be reported.

            6. What has been the key reason for Locus’ success for the past 25 years?

            There are actually a few that immediately come to mind. One reason is the nature of our continually evolving products. By providing our solutions as SaaS, our software adapts with new environmental requirements, and with new technologies. If our software was still the same as it was 25 years ago, it simply wouldn’t be sufficient for today’s requirements. Since our software is updated multiple times each year, it is difficult to notice the incremental changes, but they can be readily seen if you compare today’s software with the original in 1997. And we’re committed to continuing the development of our products as environmental needs change.

            The other primary reason for our success is our excellent staff and the environmental expertise we bring to our customers. We simply could not provide the same level of support without our team of environmental engineers, scientists, geologists, chemists, and an array of others. Having that real-world understanding of environmental topics is how we’ve maintained customer relationships for multiple decades. And our software only has value because it is maintained and operated by staff who appreciate the complexity and importance of environmental work.


            Locus President Wes Hawthorne meets with Locus Platform dev team 2016Mr. Hawthorne has been with Locus since 1999, working on development and implementation of services and solutions in the areas of environmental compliance, remediation, and sustainability. As President, he currently leads the overall product development and operations of the company. As a seasoned environmental and engineering executive, Hawthorne incorporates innovative analytical tools and methods to develop strategies for customers for portfolio analysis, project implementation, and management. His comprehensive knowledge of technical and environmental compliance best practices and laws enable him to create customized, cost-effective and customer-focused solutions for the specialized needs of each customer.

            Mr. Hawthorne holds an M.S. in Environmental Engineering from Stanford University and B.S. degrees in Geology and Geological Engineering from Purdue University. He is registered both as a Professional Engineer and Professional Geologist, and is also accredited as Lead Verifier for the Greenhouse Gas Emissions and Low Carbon Fuel Standard programs by the California Air Resources Board.

            Want to discuss EHS and ESG solutions with our product specialists? Contact us today!

              Name

              Company Email

              Phone

              Tell us about your company's needs

              Locus is committed to preserving your privacy.

              In providing water quality data management software to organizations serving millions of customers a day, our experts have found some common red flags in alternative solutions. Many alternatives to Locus are more prohibitive than helpful, leading to more issues than they should. Your organization deserves to reduce the stress of data entry, regulatory and voluntary reporting, and more. Here are the top 5 signs that your organization is using outdated water quality software:

              1. You’re transcribing data more than once or still using paper forms.

              In order to ensure the highest level of data quality, you should not be risking human error at multiple levels. Enter your data once, and have it audit-ready, set to go on regulatory and voluntary reports, which are created directly from Locus Software.

              2. Product support is not helmed by specialists who support you adequately after implementation.

              Support doesn’t end after implementation. What we often hear from our customers when they switch from other providers is that they are delighted with the level of support that Locus brings with our software. Locus is proud to have the expertise and experience to back our software, and if there is anything you need, you can be sure that Locus support can get it done smoothly.

              3. Your software has regular or unexpected downtimes.

              You need reliability. Your software should be available to you on-demand. Locus is proud to be the only environmental software developer to publicly share our uptime, which is over 99.9%. If you are experiencing downtimes at inconvenient times or for long periods, you should switch.

              4. It’s not mobile-enabled.

              Field collection is key for most organizations managing water quality data. You should be able to enter that data into your system once, and from anywhere, reducing errors and extra time doing the same work twice (or more!). Also, being able to access historical data at your fingertips can help you solve problems on the fly.

              5. It doesn’t provide actionable insights.

              Sure, you may have all of your data collected, but what are you doing with it? If your software is not giving you meaningful findings from analyzing your data, then you are always going to be playing catch-up. Having the tools to help your organization look forward is essential in selecting water data management software.

              Want to learn more about our Water Data Management Solution? Reach out to our product specialists today!

                Name

                Company Email

                Phone

                Tell us about your company's needs

                Locus is committed to preserving your privacy.